The term "in situ processing" has evolved over the last decade to mean both a specific strategy for visualizing and analyzing data and an umbrella term for a processing paradigm. The resulting confusion makes it difficult for visualization and analysis scientists to communicate with each other and with their stakeholders. To address this problem, a group of over 50 experts convened with the goal of standardizing terminology. This paper summarizes their findings and proposes a new terminology for describing in situ systems. An important finding from this group was that in situ systems are best described via multiple, distinct axes: integration type, proximity, access, division of execution, operation controls, and output type. This paper discusses these axes, evaluates existing systems within the axes, and explores how currently used terms relate to the axes.
Because data analysis and visualization jobs are highly diverse in terms of their size-measured by core count, memory use, and requisite software-sophisticated, high-performance monitoring tools are needed to improve user support and facilitate resource allocation.
The use of increasingly sophisticated means to simulate and observe natural phenomena has led to the production of larger and more complex data. As the size and complexity of this data increases, the task of data analysis becomes more challenging. Determining complex relationships among variables requires new algorithm development. Addressing the challenge of handling large data necessitates that algorithm implementations target high performance computing platforms. In this work we present a technique that allows a user to study the interactions among multiple variables in the same spatial extents as the underlying data. The technique is implemented in an existing parallel analysis and visualization framework in order that it be applicable to the largest datasets. The foundation of our approach is to classify data points via inclusion in, or distance to, multivariate representations of relationships among a subset of the variables of a dataset. We abstract the space in which inclusion is calculated and through various space transformations we alleviate the necessity to consider variables' scales and distributions when making comparisons. We apply this approach to the problem of highlighting variations in climate model ensembles.
The success of the VisIt visualization system has been wholly dependent upon the culture and practices of software development that have fostered its welcome by users and embrace by developers and researchers. In the following paper, we, the founding developers and designers of VisIt, summarize some of the major efforts, both successful and unsuccessful, that we have undertaken in the last thirteen years to foster community, encourage research, create a sustainable open-source development model, measure impact, and support production software. We also provide commentary about the career paths that our development work has engendered.
The National Institute for Computational Sciences (NICS) at the University of Tennessee currently operates two computational resources for the eXtreme Science and Engineering Discovery Environment (XSEDE), Kraken, a 112,896-core Cray XT5 for general purpose computation, and Nautilus, a 1,024-core SGI Altix UV 1000 for data analysis and visualization. We analyze a year's worth of accounting logs for Kraken and Nautilus to understand how users take advantage of these two systems and how analysis jobs differ from general HPC computation We find that researchers take advantage of the flexibility offered by these systems, running a wide variety of jobs at many scales and using the full range of core counts and available memory for their jobs. The jobs on Nautilus tend to use less walltime and more memory per core than the jobs run on Kraken. Additionally, researchers are more likely to run interactive jobs on Nautilus than on Kraken. Small jobs experience a good quality of service on both systems. This information can be used for the management and allocation of time on existing HPC and analysis systems as well as for planning for deploying future HPC and analysis systems.
The chapters from Part II describe techniques for processing massive data sets while minimizing computation, memory footprint, and/or I/O. But these techniques’ benefits come at the cost of increased complexity, especially when compared with the “pure parallelism” technique described in Chapter 2. This chapter contributes to the motivation for these more complex techniques, by asking several related questions: Will it be possible to use the simpler pure parallelism technique to process tomorrow’s data? Can pure parallelism scale sufficiently to process massive data sets? And, restated, are the techniques described in Part II needed at all?
Analysis and visualization of the data generated by scientific simulation codes is a key step in enabling science from computation. However, a number of challenges lie along the current hardware and software paths to scientific discovery. First, only advanced parallelism techniques can take full advantage of the unprecedented scale of coming machines. In addition, as computational improvements outpace those of I/O, more data will be discarded and I/O-heavy analysis will suffer. Furthermore, the limited memory environment, particularly in the context of in situ analysis which can sidestep some I/O limitations, will require efficiency of both algorithms and infrastructure. Finally, advanced simulation codes with complex data models require commensurate data models in analysis tools. However, community visualization and analysis tools designed for parallelism and large data fall short in a number of these areas. In this paper, we describe EAVL, a new library with infrastructure and algorithms designed to address these critical needs for current and future generations of scientific software and hardware. We show results from EAVL demonstrating the strengths of its robust data model, advanced parallelism, and efficiency.
The coming generation of supercomputing architectures will require fundamental changes in programming models to effectively make use of the expected million to billion way concurrency and thousand-fold reduction in per-core memory. Most current parallel analysis and visualization tools achieve scalability by partitioning the data, either spatially or temporally, and running serial computational kernels on each data partition, using message passing as needed. These techniques lack the necessary level of data parallelism to execute effectively on the underlying hardware. This paper introduces a framework that enables the expression of analysis and visualization algorithms with memory-efficient execution in a hybrid distributed and data parallel manner on both multi-core and many-core processors. We demonstrate results on scientific data using CPUs and GPUs in scalable heterogeneous systems.
This article presents the results of experiments studying how the pure-parallelism paradigm scales to massive data sets, including 16,000 or more cores on trillion-cell meshes, the largest data sets published to date in the visualization literature. The findings on scaling characteristics and bottlenecks contribute to understanding how pure parallelism will perform in the future.
We present a data-level comparative visualization system that utilizes two key pieces of technology: (1) cross-mesh field evaluation - algorithms to evaluate a field from one mesh onto another - and (2) a highly flexible system for creating new derived quantities. In contrast to previous comparative visualization efforts, which focused on "A-B" comparisons, our system is able to compare many related simulations in a single analysis. Types of possible novel comparisons include comparisons of ensembles of data generated through parameter studies, or comparisons of time-varying data. All portions of the system have been parallelized and our results are applicable to petascale data sets.
Supercomputing centers are unique resources that aim to enable scientific knowledge discovery by employing large computational resources-the "Big Iron." Design, acquisition, installation, and management of the Big Iron are carefully planned and monitored. Because these Big Iron systems produce a tsunami of data, it's natural to colocate the visualization and analysis infrastructure. This infrastructure consists of hardware (Little Iron) and staff (Skinny Guys). Our collective experience suggests that design, acquisition, installation, and management of the Little Iron and Skinny Guys doesn't receive the same level of treatment as that of the Big Iron. This article explores the following questions about the Little Iron: How should we size the Little Iron to adequately support visualization and analysis of data coming off the Big Iron? What sort of capabilities must it have? Related questions concern the size of visualization support staff: How big should a visualization program be-that is, how many Skinny Guys should it have? What should the staff do? How much of the visualization should be provided as a support service, and how much should applications scientists be expected to do on their own?
NUMERICAL MODELING OF SPACE PLASMA FLOWS// ASTRONUM-2009 Proceedings of the 4th International Conference ASP Conference Series, Vol. 407, 2010 *NAMES OF EDITORS** Recent Advances in VisIt: AMR Streamlines and Query-driven Visualization G. H. Weber, 1,2 S. Ahern, 3 E. W. Bethel, 1 S. Borovikov, 4 H. R. Childs, 1,2 E. Deines, 2 C. Garth, 2 H. Hagen, 5,2 B. Hamann, 2,1 K. I. Joy, 2,1 D. Martin, 1 J. Meredith, 3 Prabhat, 1 D. Pugmire, 3 O. R¨ bel, 1,2,5 B. Van Straalen, 1 and K. Wu 1 u 1 Computational Research Division, Lawrence Berkeley National Laboratory, One Cyclotron Road, Berkeley, CA 94720, USA 2 Institute for Data Analysis and Visualization, Department of Computer Science, University of California, Davis, One Shields Avenue, Davis, CA 95616, USA 3 Oak Ridge National Laboratory, PO Box 2008, Oak Ridge, TN 37831-6016, USA 4 Center for Space Plasma and Aeronomic Research, The University of Alabama in Huntsville, 320 Sparkman Drive, Huntsville, AL 35899 5 International Research Training Group 1131, Technische Universit¨ t a Kaiserslautern, Erwin-Schro¨ dinger Strase, D-67653 Kaiserslautern, o Germany Abstract. Adaptive Mesh Refinement (AMR) is a highly effective method for simulations spanning a large range of spatiotemporal scales such as those en- countered in astrophysical simulations. Combining research in novel AMR visu- alization algorithms and basic infrastructure work, the Department of Energy’s (DOEs) Science Discovery through Advanced Computing (SciDAC) Visualiza- tion and Analytics Center for Enabling Technologies (VACET) has extended VisIt, an open source visualization tool that can handle AMR data without converting it to alternate representations. This paper focuses on two recent advances in the development of VisIt. First, we have developed streamline com- putation methods that properly handle multi-domain data sets and utilize ef- fectively multiple processors on parallel machines. Furthermore, we are working on streamline calculation methods that consider an AMR hierarchy and detect transitions from a lower resolution patch into a finer patch and improve inter- polation at level boundaries. Second, we focus on visualization of large-scale particle data sets. By integrating the DOE Scientific Data Management (SDM) Center’s FastBit indexing technology into VisIt, we are able to reduce parti- cle counts effectively by thresholding and by loading only those particles from disk that satisfy the thresholding criteria. Furthermore, using FastBit it be- comes possible to compute parallel coordinate views efficiently, thus facilitating interactive data exploration of massive particle data sets. Introduction Adaptive Mesh Refinement (AMR) (Berger & Colella 1989) plays an increasingly important role in astrophysical simulations. In general, AMR techniques have
Knowledge discovery from large and complex scientific data is a challenging task. With the ability to measure and simulate more processes at increasingly finer spatial and temporal scales, the growing number of data dimensions and data objects presents tremendous challenges for effective data analysis and data exploration methods and tools. The combination and close integration of methods from scientific visualization, information visualization, automated data analysis, and other enabling technologies -such as efficient data management- supports knowledge discovery from multi-dimensional scientific data. This paper surveys two distinct applications in developmental biology and accelerator physics, illustrating the effectiveness of the described approach.
State-of-the-art computational science simulations generate large-scale vector field data sets. Visualization and analysis is a key aspect of obtaining insight into these data sets and represents an important challenge. This article discusses possibilities and challenges of modern vector field visualization and focuses on methods and techniques developed in the SciDAC Visualization and Analytics Center for Enabling Technologies (VACET) and deployed in the open-source visualization tool, VisIt.
Author(s): Bethel, E Wes | Abstract: While the primary product of scientific visualization is images and movies, its primary objective is really scientific insight. Too often, the focus of visualization research is on the product, not the mission. This paper presents two case studies, both that appear in previous publications, that focus on using visualization technology to produce insight. The first applies Query-Driven Visualization concepts to laser wakefield simulation data to help identify and analyze the process of beam formation. The second uses topological analysis to provide a quantitative basis for (i) understanding the mixing process in hydrodynamic simulations, and (ii) performing comparative analysis of data from two different types of simulations that model hydrodynamic instability.
Author(s): Garth, Christoph; Deines, Eduard; Joy, Ken; Childs, Hank; Weber, Gunther H.; Bethel, Wes; Ahern, Sean; Pugmire, David; Johnson, Chris | Editor(s): Sanderson, Allen | Abstract: State-of-the-art computational science simulations generate large-scale vector field datasets. Visualization and analysis are key aspects of obtaining insight into these datasets and represent an important challenge. This article discusses possibilities and challenges of modern vector field visualization and focuses on methods and techniques developed in the SciDAC Visualization and Analytics Center for Enabling Technologies (VACET) and deployed in the open-source VisIt tool.
 Hank Childs合作论文数Lawrence Berkeley National Laboratory25
 Jeremy S. Meredith合作论文数Oak Ridge National Laboratory19
 Gunther H. Weber合作论文数Scientific Data Division, Lawrence Berkeley National Laboratory;University of California, Davis16
 Bernd Hamann合作论文数Stratovan Corporation;Department of Computer Science, University of California, Davis13
 E. W. Bethel合作论文数Lawrence Berkeley National Laboratory
The University of California
Berkeley,13
E. W. Bethel合作论文数Lawrence Berkeley National Laboratory
The University of California
Berkeley,13 George Ostrouchov合作论文数Department of Business Analytics & Statistics, Haslam College of Business, The University of Tennessee, Knoxville10
 E. Brugger合作论文数9
 Valerio Pascucci合作论文数Kahlert School of Computing, University of Utah;Center for Extreme Data Management Analysis and Visualization, University of Utah;Scientific Computing and Imaging Institute, School of Computing, University of Utah;National Science Data Fabric;Pacific Northwest National Laboratory9
 E. Wes Bethel合作论文数Lawrence Berkeley National Laboratory9Brad Whitlock合作论文数Lawrence Livermore National Laboratory9
 Christoph Garth合作论文数Scientific Visualization Laboratory, Department of Computer Science, Rheinland-Pfälzische Technische Universität Kaiserslautern-Landau8
 Hans Hagen合作论文数Kaiserslautern University of Technology7
 Claudio Silva合作论文数Polytechnic Institute, Tandon School of Engineering, New York University7
 Christopher R. Johnson合作论文数Scientific Computing and Imaging Institute, University of Utah7
 Dave Pugmire合作论文数Computer Science and Mathematics Division, Oak Ridge National Laboratory7Allen R. Sanderson合作论文数University of Utah7
 Kesheng Wu (John)合作论文数Berkeley Lab
One Cyclotron Road
MS50B-3238
Berkeley, CA 94720 US7
Kesheng Wu (John)合作论文数Berkeley Lab
One Cyclotron Road
MS50B-3238
Berkeley, CA 94720 US7 Charles (Chuck) Hansen合作论文数School of Computing, University of Utah;Scientific Computing and Imaging Institute, University of Utah;Linköping University6
 Oliver Rübel合作论文数Lawrence Berkeley National Laboratory6Ken Joy合作论文数5Steven Parker合作论文数NVIDIA5
 Xavier Tricoche合作论文数Department of Computer Science, Purdue University5
 Jamison Daniel合作论文数5
 Eduard Deines合作论文数5
 Peter G. Lindstrom合作论文数Center for Applied Scientific Computing, Lawrence Livermore National Laboratory4
 Robert Sisneros合作论文数University of Illinois at Urbana-Champaign4
 Timo Bremer合作论文数Center for Applied Scientific Computing, Lawrence Livermore National Laboratory;Scientific Computing and Imaging Institute, Center of Extreme Data Management Analysis and Visualization, University of Utah4
 Cameron Geddes合作论文数Accelerator Technology and Applied Physics Division, Lawrence Berkeley National Laboratory;BELLA Center, Lawrence Berkeley National Laboratory4Kenneth Joy合作论文数Institute for Data Analysis and Visualization4
 Mark Duchaineau合作论文数CogniGraph4Rich Cook合作论文数3Ken Lewis合作论文数3Jian Huang合作论文数3
 Peter Messmer合作论文数3
 Mark C. Miller合作论文数Lawrence Livermore National Laboratory3
 Kenneth I. Joy合作论文数Computer Science Department University of California3
 Kwan-Liu Ma (馬匡六)合作论文数Department of Computer Science, University of California, Davis3
 Estelle Cormier-Michel合作论文数3
 Jens Owen合作论文数3
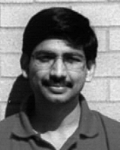 Prabhat合作论文数3
 Kathleen S. Bonnell合作论文数3
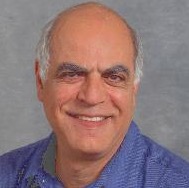 Arie Shoshani合作论文数Scientific Data Management Research and Development Group, Computing Research Department, Computational Research Division, Lawrence Berkeley National Laboratory3Mark R. Fahey合作论文数National Center for Computational Sciences, Oak Ridge National Laboratory;Argonne National Laboratory, U.S. Department of Energy Office of Science3
 Brian Paul合作论文数3E. Cormier‐Michel合作论文数2C. Hansen合作论文数2Daniela Ushizima合作论文数2P Messmer合作论文数2




