<p>As part of the Net Zero Carbon Water Cycle Program (NZCWCP) for Victoria state in Australia, we have sought to understand the potential to reduce household energy consumption and related Greenhouse Gas (GHG) emissions by influencing water use. Digital metering data disaggregated into 57 million discrete water usage events across 105 households at a resolution of 10 millilitres at 10 second intervals from June 2017 to March 2020, from a previous Yarra Valley Water (Melbourne, Australia) study, was analysed, together with the dynamic relationship between the multiple energy sources (natural gas, grid electricity, solar) used to heat water for showers in each hour of the day. Water-related energy (WRE) use, including water desalination and treatment, pumping, heating, wastewater collection and treatment, comprised 12.6% of Australia&#8217;s primary energy use in 2019. Water heating (by natural gas and electricity) comprised the largest component of WRE use for across residential, commercial, and industrial sectors. Furthermore, 69% of Victoria&#8217;s total water usage was by residential customers in 2020-2021. WRE GHG emissions were around 3.8% of Victoria&#8217;s total GHG emissions in 2018. Showers (~50% of residential WRE), system losses (~27% of residential WRE), and clothes washers (~9% of residential WRE) are the three largest components of WRE consumption. The main objective of this work is the creation of industry-accessible tools to improve knowledge and management options from the understanding of reductions in cost and GHG emissions from household showering WRE use. Potential options considered, to reduce water and energy use, as well as associated GHG emissions and customer utility bills, include (a) behaviour management such as water and energy pricing to change time of use behaviours, and (b) the adoption of efficient shower head improvements. Shower WRE and GHG emissions were found able to be strongly impacted by small changes in daily routines. GHG emissions reduction from showering could be reduced up to 20 (in summer) - 22% (in winter) by shifting demand time of showering or replacing residential showerheads. Extrapolated to state and Australian scales, reductions in water usage could be up to 14 GL (Victoria) and 144 GL (Australia), and reductions in GHG emissions 1,600 ktCO<sub>2</sub>eq (Victoria) and 17,300 ktCO<sub>2</sub>eq (Australia). It provides fundamental new information which could inform a suite of new management options to impact water-related energy from showers, and related GHG emissions and customer water and energy cost.</p>
The need for energy in water provision and use is obvious, however the drivers are often complex, difficult to assess, and often inconsistently presented. Here we build a clearer definition and conceptual framework of “water-related energy”. We apply this framework to harmonise data and results across disparate studies so that regional estimates of water-related energy can be compared in a consistent way for the first time. We show how widely different boundaries have been used for analysis including or excluding: water and wastewater utilities, as well as residential, commercial, industrial, and agricultural water users. Consequently, understanding of what constitutes “water-related energy” is widely divergent. We demonstrate how up to 12.6% of total national primary energy use can be influenced by water, when (i) water-related energy of water users, and (ii) energy use by water utilities, are all included. Water heating for residential, commercial, and industrial purposes is the dominant fraction. Water and wastewater utilities use 0.4–2.3% of primary energy or 0.6–6.2% of regional electricity, mostly for water pumping. This is substantial, but lower than frequent claims in the media and reports. To answer how is miscommunication influencing policy? we undertake a novel systematic tracking of communication to demonstrate distortion between research and its application in government reports, media and policy. We show that significant confusion is caused by (i) unclear or inconsistent boundaries (ii) widely differing use of terms for water “system”, “sector”, and “supply”, (iii) frequent failure to distinguish ‘energy’ from ‘electricity’ and (iv) wide use of non-standard units. While acknowledging that media is often less accurate than government reports, and that peer-reviewed articles generally have highest overall quality, we observe miscommunication and inconsistency in all publication forms. We argue a global protocol is needed to improve consistency of analysis and sharpen policy towards sustainable water end use because this is where most water-related energy occurs. We establish a foundational framework and definitions for this protocol while recognising much more needs to be done. The strong practical and theoretical implications of the work for sustainable cleaner production are elucidated. This is timely, as global quantification of water-related energy has yet to occur particularly for water end-use which is the dominant component.
Residential water use accounts for at least 80% of water-related energy (WRE) demand (primarily through water heating) in the residential urban water system. Cold water temperature (CWT) is a key determinant in predicting residential WRE but variation of CWT within water networks has not been quantified and is not accounted for in water heating energy consumption guidelines. Here, we analysed the spatiotemporal variability in CWT over the course of a year (2013) using 5760 measurements from 1255 urban water system sampling locations across the Yarra Valley Water region in Melbourne, Australia. CWT varied across the study site from 12-28 degrees C during summer and 9-15 degrees C during winter. Spatial clusters of higher CWT regions (hot spots) and lower CWT regions (cold spots) were also observed. The CWT variability impact on annual household WRE demand was estimated to be between 17 to +19% (-640 to +680 kWh/hh.yr) change in water heating for sample households, which is dependent on the geographical location of the household within the study site. However, households located in cold spot regions will have almost twice the amount of WRE demand than average, conversely, WRE demand will be lower than average in hot spot regions.Monthly mean CWTs diverged from the Australian Standards for hot water system energy consumption guidelines value by 21 to +47%. The magnitude of CWT variability and associated energy required for water heating are comparable with the total energy used by water utilities to deliver water supply and sewage disposal services. Variation in water heating could be as large as -4.6 kWh/hh.d (hot spot in March) and 3.6 kWh/hh.d (cold spot in July), more than three times the total energy used to deliver water supply and sewage disposal services for this region. Accounting for CWT variability could increase accuracy of regional-scale WRE demand and hot water system performance.
Water- and energy-efficient households are a necessary element of sustainable cities. Water-related energy usage in households is a point of overlap where water and energy utilities could work together. Improving the combined efficiency of water and energy management requires a better understanding of the inter-relationships between these systems and associated water and energy use. lt also requires collaboration with householders. In order to progress understanding of water-energy links within households, a research project has commenced with the Smart Water Fund and The University of Queensland. With funding support from the Australian Research Council, the research focuses on elucidating and quantifying water-carbon-energy links in individual households in Melbourne, as well as collective groups of households in a district. The work is a new initiative for Australian water utilities, in that it looks in detail at how water industry actions and policies influence energy use in private households. In this way, the work goes beyond the boundary of traditional water utility energy use analysis, which typically assesses the energy implications directly connected with the utilities themselves, such as the energy demands of the water and wastewater infrastructure and assets. The project runs between 2013 and 2016. This paper presents the background and objectives of the work, including preliminary results.
 Steven Kenway合作论文数Australian Centre for Water and Environmental Biotechnology, Faculty of Engineering, Architecture and Information Technology, The University of Queensland6
 Amanda Binks合作论文数3
 Brian Head合作论文数School of Political Science and International Studies, Faculty of Humanities and Social Sciences, The University of Queensland3
 francis pamminger合作论文数2
 Jennifer Stokes-Draut合作论文数Lawrence Berkeley Natl Lab2
 Paul Lant合作论文数Centre for Marine Science, Faculty of Science, The University of Queensland2
 Thomas Taimre合作论文数School of Mathematics and Physics, Faculty of Science, The University of Queensland2
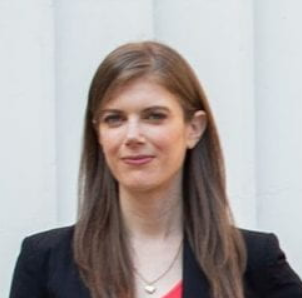 Kelly T. Sanders合作论文数Sonny Astani Department of Civil and Environmental Engineering, Viterbi School of Engineering, University of Southern California2
 Adam Gerace合作论文数2
 Ka-Leung Lam合作论文数Department of Chemical and Biomolecular Engineering, The Hong Kong University of Science and Technology2
 Gustaf Olsson合作论文数Department of Biomedical Engineering, Lund University2
 James E. Mcmahon合作论文数Lawrence Berkeley National Laboratory2
 Kate O'Brien合作论文数School of Chemical Engineering, Faculty of Engineering, Architecture and Information Technology, The University of Queensland1
 Sam Johnson合作论文数Microsoft Corporation1Hans-Peter Bader合作论文数1Ruth Scheidegger合作论文数1




