近年,防波堤の耐津波安定性に関する研究が多く実施されているが,サンゴ礁上の水深が浅い防波堤に対する研究成果の適用性は確認されていない.本研究では,サンゴ礁上の水深が浅い防波堤の耐津波安定性について検討した.サンゴ礁上の防波堤の耐津波安定性を検証する水理模型実験を実施し,港内側マウンド被覆材の安定性を示すイスバッシュの定数は,一般的に用いられている値よりやや大きい結果となると共に,港内側被覆ブロックの大きさと安定性に逆転現象を生じることがある結果を得た.CADMAS-SURF/3Dを用いた数値シミュレーションにより,サンゴ礁上の防波堤は水深が深い防波堤よりも越流水深が大きくなる可能性を確認した.
To diagnose performance problems in production systems, many OS kernel-level monitoring and analysis tools have been proposed. Using low level kernel events provides benefits in efficiency and transparency to monitor application software. On the other hand, such approaches miss application-specific semantic information which can be effective to differentiate the trace patterns from distinct application logic. This paper introduces new trace analysis techniques based on event features to improve kernel event based performance diagnosis tools. Our prototype, AppDiff, is based on two analysis features: system resource features convert kernel events to resource usage metrics, thereby enabling the detection of various performance anomalies in a unified way; program behavior features infer the application logic behind the low level events. By using these features and conditional probability, AppDiff can detect outliers and improve the diagnosis of application performance.
In this paper, we present CLUE, a system event analytics tool for black-box performance diagnosis in production Cloud Computing systems. CLUE provides an unified and extensible means of profiling service transactional behaviors, and builds structured data called event sketches. CLUE further offers a set of analytic tools for summarizing and analyzing event sketches by integrating data mining and statistical analysis. CLUE has been developed in NEC as an internal tool and applied in diagnosing a diverse set of real performance problems for multi-tiered IT applications running on multi-core servers of major platforms including Linux (Redhat, Fedora), Unix (HP-UX), and Windows (Windows Server 2008). We demonstrated the evaluation of our framework on real-world IT systems, and showed how it can enable visibility and effective diagnosis of service system performance problems.
Unified tracing is the process of collecting trace logs across the boundary of kernel and user spaces, and has been used to understand the in-depth correspondence between low level events and application program context for diagnosing system failures and performance problems. Crossing the boundary from the kernel space to a user space to collect trace events from dual spaces imposes challenges compared to crossing the boundary in the other way from a user space to the kernel space due to multiple scheduled programs and diverse code layouts in the user space regarding the tracing target. In this paper, we propose a novel unified tracing system called Uscope to systematically trace kernel and unprecedented user code with low overhead. The key idea is to use an efficient variant of stack walking. Uscope lowers stack walking overhead by adjusting the scope of walking in two ways: (1) a highly configurable focus within the call stack, and (2) a per-application tracing that systematically tracks a dynamic set of new, exiting, or transforming processes and threads of an application software. This system is realized by using a flexible stack walking algorithm and a runtime kernel structure, Trace Map. These key features lead to low run-time overhead under 6% relative to native execution on a set of widely used benchmarks.
The hindrances to the adoption of public cloud computing services include service reliability, data security and privacy, regulation compliant requirements, and so on. To address those concerns, we propose a hybrid cloud computing model which users may adopt as a viable and cost-saving methodology to make the best use of public cloud services along with their privately-owned (legacy) data centers. As the core of this hybrid cloud computing model, an intelligent workload factoring service is designed for proactive workload management. It enables federation between on- and off-premise infrastructures for hosting Internet-based applications, and the intelligence lies in the explicit segregation of base workload and flash crowd workload, the two naturally different components composing the application workload. The core technology of the intelligent workload factoring service is a fast frequent data item detection algorithm, which enables factoring incoming requests not only on volume but also on data content, upon a changing application data popularity. Through analysis and extensive evaluation with real-trace driven simulations and experiments on a hybrid testbed consisting of local computing platform and Amazon Cloud service platform, we showed that the proactive workload management technology can enable reliable workload prediction in the base workload zone (with simple statistical methods), achieve resource efficiency (e.g., 78% higher server capacity than that in base workload zone) and reduce data cache/replication overhead (up to two orders of magnitude) in the flash crowd workload zone, and react fast (with an X^2 speed-up factor) to the changing application data popularity upon the arrival of load spikes.
Recent advances in sensing and communication technologies enable us to collect round-the-clock monitoring data from a wide-array of distributed systems including data centers, manufacturing plants, transportation networks, automobiles, etc. Often this data is in the form of time series collected from multiple sensors (hardware as well as software based). Previously, we developed a time-invariant relationships based approach that uses Auto-Regressive models with eXogenous input (ARX) to model this data. A tool based on our approach has been effective for fault detection and capacity planning in distributed systems. In this paper, we first describe our experience in applying this tool in real-world settings. We also discuss the challenges in fault localization that we face when using our tool, and present two approaches - a spatial approach based on invariant graphs and a temporal approach based on expected broken invariant patterns - that we developed to address this problem.
With the increasing complexity of cyber-physical systems, it is essential to enhance their self-management capabilities (e.g., self-protection, self-optimization). This paper presents a data-oriented approach to achieving that goal, given that a large amount of measurements can be collected in current systems. We investigate typical data characteristics in physical systems, and identify that the collected data from those systems exhibit a wide range of diversities. Following those observations, a new analytic engine is proposed and developed to extract knowledge from measurement data streams in physical systems. The engine treats each attribute in measurements as a time series and contains an ensemble of models, each attempting to discover a specific data property accordingly, such as periodicity, pairwise dependency and so on. Therefore time series are profiled based on their properties captured by engine models. The extracted data profiles can be further used to facilitate several management tasks of system status monitoring and online anomaly detection. Our experimental results in a real power plant have demonstrated that our analytic engine can correctly profile heterogeneous time series in the system, and successfully detect a number of abnormal situations in the system operation including some system inspection events as well as component faults.
 Guofei Jiang (蒋国飞)合作论文数Ant Group65
 Haifeng Chen合作论文数Data Science and Systems Research Department, NEC Laboratories America, Inc.48
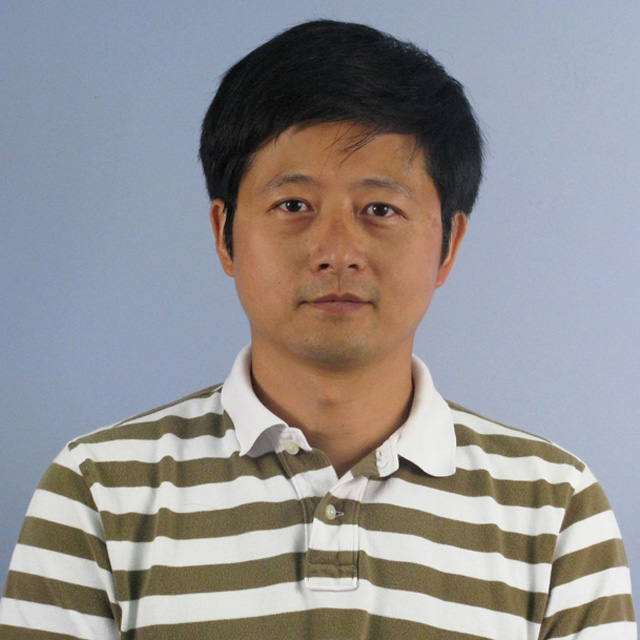 Hui Zhang合作论文数NEC Laboratories America32
 John Rhee合作论文数Department of Computer Science, College of Mathematics & Science, University of Central Oklahoma;Center for Cybersecurity Leaders, Education and Research, University of Central Oklahoma9
 Nipun Arora合作论文数8Akhilesh Saxena合作论文数8Xiaoqiao Meng合作论文数IBM T.J. Watson Research Center7
 Cristian Ungureanu合作论文数NEC Laboratories America7
 Abhishek B. Sharma合作论文数NEC Research Lab5Ya-Yunn Su合作论文数University of Michigan5Min Ding合作论文数National Institute of Standards and Technology4
 Ming Chen合作论文数University of Tennessee3
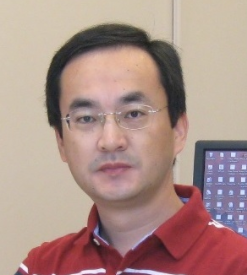 Xiaorui (Ray) Wang合作论文数Power-Aware Computer Systems Laboratory, Department of Electrical and Computer Engineering, The Ohio State University;Department of Computer Science and Engineering, The Ohio State University3
 Xia Ning (宁夏)合作论文数Department of Computer Science and Engineering, College of Engineering, Ohio State University;Department of Biomedical Informatics, College of Medicine, Ohio State University2
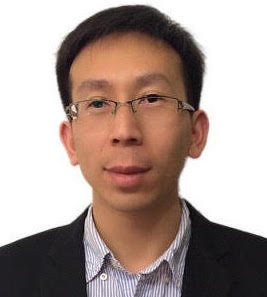 Bin Liu合作论文数Chambers College of Business and Economics, West Virginia University West Virginia University;John Chambers College of Business and Economics, West Virginia University;Lane Department of Computer Science and Electrical Engineering, West Virginia University2Hui Kang合作论文数2
 Lei Lu (路蕾)合作论文数Guangzhou Medical University2
 Haibin Cheng (程海斌)合作论文数State Key Laboratory of Advanced Technology for Materials Synthesis and Processing, School of Materials Science and Engineering, Wuhan University of Technology2
 Hanhuai Shan合作论文数Microsoft2Xiaozhu Kang合作论文数2
 Evgenia Smirni合作论文数Department of Computer Science, College of William and Mary2Geoff Jiang合作论文数1Takashi Maesato合作论文数1Satoshi Tanaka合作论文数1Jungwhan Rhee合作论文数1
 Dongyan Xu合作论文数Department of Computer Science, College of Science, Purdue University;Center for Education and Research in Information Assurance and Security, Purdue University1Yoshiyuki Takeda合作论文数1
 Sahan Gamage合作论文数1Nanyan Jiang (江南燕)合作论文数1




