International academic rankings of research universities are widely applied and heavily criticised. Amongst the many international rankings, the Shanghai ranking has been particularly influential. Although this ranking’s primary data are generally accessible and its methods are published in outline format, it does not follow that its outputs are predictable or straightforward. In practice, the annual and time series Shanghai rankings rely on data and rules that are complex, variable, and not fully revealed. Patterns and changes in the ranking may be misinterpreted as intrinsic properties of institutions or systems when they are actually beyond the influence of any university or nation. This article dissects the rules that connect raw institutional data to the published ranking, using the 2020 edition as a reference. Analysing an ARWU review of ranking changes over 2004–2016, we show how exogenous or methodological changes have often driven changes in ranking. Stakeholders can be misled if they believe that changes are intrinsic to institutions’ performance. We hope to inform and warn the media, governments, and institutions about the merits and risks of using the Shanghai ranking to evaluate relative institutional performance and its evolution.
Highly cited researchers are a category of researchers defined by scientometric rules relating to counts of citations to their scholarly articles. The designation often refers to researchers identified according to scientometric rules specified by the Institute of Scientific Information (ISI) and its commercial affiliates; we denote these categories as HCR. The 2001 ISI rules (HRC.1) used membership thresholds derived from the total citation counts to an author's corpus in a specified research field and time window. The modified 2013 rules also include counts of individual highly cited publications (HCR.2), while the foreshadowed 2018 rules introduce the concept of cross-field influence (HCR.3). The HCR category is a popular, albeit flawed, indicator of outstanding individual researchers. HCR membership has been used as the basis for many studies of research excellence, including the use of an institution's HCR count as an indicator in the Academic Ranking of World Universities (ARWU). The paper traces the development of the HCR category and its use by ARWU, providing insights into the social construction of research indicators and their potential to change research practice.
Links between institutional academic performance and academic resources are of relevance for university managers, country officials and the public at large. This study aims to shed light on the issues using reliable data on research performance indicators as well as educational and resource indicators from research universities in Spain, Italy, Australia and Canada. The four countries selected for the study represent different academic traditions and belong to different geopolitical regions, yet they have relatively similar higher education systems in terms of student population, institutional resources and research production. Our study explores differences and similarities among them to better assess the performance of research universities from the four countries in a global context. The indicator set includes research production (number of indexed articles per year) and its quality (citation impact and number of highly cited papers), education production (full-time equivalent FTE student load and degree completions per year) and the resource base (annual ordinary expenditure and FTE number of faculty). We consider the raw indicators as well as a set of composite indicators normalised by measures of scale. Across the profile of universities in our complete sample, institutional size is the prime determinant of research production, with systematic differences in quality related to country, research intensity and resourcing level. Our data show that research universities allocate resources to research and education in country-specific and size-specific ways that are reflected in research performance.
We employ high-spatial-resolution solar observations of the weak Fe n >13969.4 line to study non-local thermodynamic equilibrium (NLTE) effects in Fe n line formation. This line is superposed on the wing of the Ca n H line, which raises its height of formation. The line shows extraordinary spatial intensity variations, including emission features whose contrast increases toward the limb. Observed profiles of the Fe n resonance lines in the UV are used to define formation parameters in a 15-level atomic model computation, which shows that Fe n subordinate lines are generally formed out of local thermodynamic equilibrium (LTE) as a result of pumping by UV line-wing photons from the deep photosphere. For the 23969.4 line, this pumping results in large sensitivity to the atmospheric structure in layers deeper than the layer of formation of the H-wing background intensity. We discuss the absence of intense emission cores in the Fe n resonance lines, the effects of partially coherent scattering, and the effects of chromospheric and photospheric inhomogeneities. We find that emission of 23969.4 provides a diagnostic of the inhomogeneous structure of the deep photosphere, for the Sun and for late-type stars. Subject headings: line formation — radiative transfer — Sun : atmosphere
University rankings frequently struggle to delineate the separate contributions of institutional size and excellence. This presents a problem for public policy and university leadership, for example by blurring the pursuit of excellence with the quest for growth. This paper provides some insight into the size/excellence debate by exploring the explicit contribution of institutional size to the results of the Shanghai ranking indicators. Principal components analysis of data from the Shanghai ranking (2013 edition) is used to explore factors that contribute to the variation of the total score. The analysis includes the five non-derived ARWU indicators (Alumni, Award, HiCi, S&N and PUB) and uses the number of equivalent full-time academic staff (FTE) as a measure of size. Two significant but unequal factors are found, together explaining almost 85 % of the variance in the sample. A factor clearly associated with the size of the institution explains around 30 % of the variance. To sharpen the interpretation of the smaller factor as a measure of the effect of size, we extend the analysis to a larger set of institutions to eliminate size-dependent selection effects. We also show that eliminating outlying universities makes little difference to the factors. Our inferences are insensitive to the use of raw data, compared with the compressed and scaled indicators used by ARWU. We conclude that around 30 % of the variation in the ARWU indicators can be attributed to variation in size. Clearly, size-related factors cannot be overlooked when using the ranking results. Around 55 % of the variation arises from a component which is uncorrelated with size and which measures the quality of research conducted at the highest levels. The presence of this factor encourages further work to explore its nature and origins.
The growing influence of the idea of world-class universities and the associated phenomenon of international academic rankings are intriguing issues for contemporary comparative analyses of higher education. Although the Academic Ranking of World Universities (ARWU or the Shanghai ranking) was originally devised to assess the gap between Chinese universities and world-class universities, it has since been credited with roles in stimulating higher education change on many scales, from increasing the labor value of individual high-performing scholars to wholesale renovation of national university systems including mergers. This paper exhibits the response of the ARWU indicators and rankings to institutional mergers in general, and specifically analyses the universities of France that are engaged in a major amalgamation process motivated in part by a desire for higher international rankings.
The Academic Ranking of World Universities (ARWU) published by researchers at Shanghai Jiao Tong University has become a major source of information for university administrators, country officials, students and the public at large. Recent discoveries regarding its internal dynamics allow the inversion of published ARWU indicator scores to reconstruct raw scores for 500 world class universities. This paper explores raw scores in the ARWU and in other contests to contrast the dynamics of rank-driven and score-driven tables, and to explain why the ARWU ranking is a score-driven procedure. We show that the ARWU indicators constitute sub-scales of a single factor accounting for research performance, and provide an account of the system of gains and non-linearities used by ARWU. The paper discusses the non-linearities selected by ARWU, concluding that they are designed to represent the regressive character of indicators measuring research performance. We propose that the utility and usability of the ARWU could be greatly improved by replacing the unwanted dynamical effects of the annual re-scaling based on raw scores of the best performers.
We present the results of a study of a sample of 375 extremely red galaxies (ERGs) in the Phoenix Deep Survey, 273 of which constitute a subsample which is 80% complete to Ks = 18.5 over an area of 1160 arcmin2. The angular correlation function for ERGs is estimated, and the association of ERGs with faint radio sources explored. We find tentative evidence that ERGs and faint radio sources are associated at z ≳ 0.5. A new overdensity-mapping algorithm has been used to characterize the ERG distribution, and identify a number of cluster candidates, including a likely cluster containing ERGs at 0.5 < z < 1. Our algorithm is also used in an attempt to probe the environments in which faint radio sources and ERGs are associated. We find limited evidence that the I − Ks > 4 criterion is more efficient than R − Ks > 5 at selecting dusty star-forming galaxies, rather than passively evolving ERGs.
An abstract is not available for this content so a preview has been provided. As you have access to this content, a full PDF is available via the ‘Save PDF’ action button.
The Chandra Deep Field South (CDFS) is one of the most extensively observed regions of the sky, with some of the deepest multiwavelength coverage ever. The richness of the available data makes this the field of choice for performing studies of distant, often elusive, galaxy populations. Deep radio observations of the CDFS have been performed at 1.4 GHz and 327 MHz, with the ATCA and the GMRT, respectively. Using the data available at other wavelengths, we explore the nature of the faint radio population in the CDFS, addressing in particular the optically unidentified microJansky radio sources. Finally, using the 327 MHz data, we offer a first glimpse of a new project aimed at detecting the population of Ultra Steep Spectrum sources, known to be efficient tracers of high redshift radio galaxies, at the very faintest radio flux levels.
The Molonglo radio telescope near Canberra, Australia, is an east-west array of two collinear cylindri- cal parabolic reflectors with a total length of 1.6 km. Its 18,000 m2 collecting area is the largest of any radio tele- scope in the Southern Hemisphere. We will prototype on the telescope technologies relevant to the next generation radio telescope, the square kilometre array (SKA). We plan to equip the telescope with new wide-band feeds, low-noise amplifiers, digital filterbanks and FX correlator, and demon- strate 300-1420 MHz continuous frequency coverage and multibeam mode operation. This will allow us to develop and test several new technologies and will provide a new capability for low-frequency radio astronomy in Australia, reflector. The prototype will use the existing mechanical structure of the cylindrical parabolic Molonglo telescope (2), shown in Fig. 1, but replace, in stages, all the other elements of the signal path. The stages are timed to avoid disruption of the telescope's current task, the 843 MHz Sydney University Molonglo Sky Survey (SUMSS) (3), due for completion in 2003. The initial stages involve installation and testing of the 'back-end' of the instrument, the digital filterbank, FX correlator and signal processing software and hardware (4). These will initially take inputs from the existing 843 MHz feeds and can be operated in parallel with the 843 MHz survey. At the completion of the survey, the new 'front-end' feeds, low-noise amplifiers (LNAs) and beamformer (5), will be installed and tested. At this time, around 2005, with the SKA technology prototyping phase completed the science program (6) will begin in earnest. Below we describe the SKA technologies that we intend to develop for the prototype, followed by a brief description of the major new science projects that will be possible with the prototype.
One of the many scientific goals of the Square Kilometre Array (SKA) will be the investigation of the extragalactic radio source population at flux densities two to three orders of magnitude fainter than the limits of existing observations. We present simulations of the radio sky at 1.4 GHz down to a flux density limits of Jy using extrapolations of known radio luminosity functions for two different population scenarios. The resulting simulations confirm that a resolution of is necessary to avoid formal confusion, but source blending may still dominate if the intrinsic size of such faint sources is larger than a few kiloparsecs.
We present optical and X-ray identifications for the sixty-four radio sources in the GOODS-S ACS field revealed in the ATCA 1.4 GHz survey of the Chandra Deep Field South. Optical identifications are made using the ACS images and catalogs, while the X-ray view is provided by the Chandra X-ray Observatory 1 Ms observations. Redshifts for the identified sources are drawn from publicly available catalogs of spectroscopic observations and multi-band photometric-based estimates. Using this multiwavelength information we provide a first characterization of the faint radio source population in this region. The sample contains a mixture of star-forming galaxies and active galactic nuclei, as identified by their X-ray properties and optical spectroscopy. A large number of morphologically disturbed galaxies is found, possibly related to the star-formation phenomena. In spite of the very deep optical data available in this field, seven of the sixty-four radio sources have no optical identification to z(850) 28 mag. Only one of these is identified in the X-rays.
The Phoenix Deep Survey (PDS) is a multiwavelength survey based on deep 1.4 GHz radio observations used to identify a large sample of star forming galaxies to z=1. Photometric redshifts are estimated for the optical counterparts to the radio-detected galaxies, and their uncertainties quantified by comparison with spectroscopic redshift measurements. The photometric redshift estimates and associated best-fitting spectral energy distributions are used in a stacking analysis exploring the mean radio properties of U-band selected galaxies. Average flux densities of a few μJy are measured.
 Bahram Mobasher合作论文数Department of Physics and Astronomy, University of California, Riverside26
 Andrew M. Hopkins合作论文数Astrophysics and Space Technologies Research Centre, Faculty of Science and Engineering, Macquarie University;School of Mathematical and Physical Sciences, Faculty of Science and Engineering, Macquarie University24
 J. Afonso合作论文数16
 Antonis Georgakakis合作论文数Institute for Astronomy, Astrophysics, Space Applications and Remote Sensing, National Observatory of Athens15
 John H. Thomas合作论文数Fort Environmental Laboratories12
 A. H. Nye合作论文数11
 Ron Ekers合作论文数Australia Telescope National Facility, CSIRO Astronomy & Space Science7
 Domingo Docampo合作论文数Universidade de Vigo;Departamento de Teoría do Sinal e Comunicacions;Departamento de Teoría do Sinal e Comunicacions, Universidade de Vigo6
 Mark Sullivan合作论文数School of Physics & Astronomy, University of Southampton5
 Ray Norris合作论文数CSIRO Australia Telescope National Facility;CSIRO Astronomy and Space Science;School of Science, University of Western Sydney4M. I. Large合作论文数4B. Chan合作论文数3leonard v kuhi合作论文数3Fadel A. Bukhari合作论文数3
 Elaine Sadler合作论文数Faculty of Science, The University of Sydney;Commonwealth Scientific and Industrial Research Organisation3Richard W Hunstead合作论文数3
 Robert J. Rutten合作论文数Astronomical Institute3A. D. Gray合作论文数3R. E. Loughhead合作论文数3
 Duncan Campbell-Wilson合作论文数Molonglo Radio Observatory, School of Physics, University of Sydney;Sydney Institute of Astronomy, University of Sydney3
 Michael Rowan-Robinson合作论文数Department of Physics, Faculty of Natural Sciences, Imperial College London;Space Laboratory, Imperial College London3S. L. Keil合作论文数3Morris A. Davis合作论文数2Chiara Aime合作论文数2J. W. O'Byrne合作论文数2R Twardy合作论文数2J. W. Brosius合作论文数2ben hiu pan chan合作论文数2K. W. F. Lam合作论文数2s w amy合作论文数2Alex Hons合作论文数2K. S. Russell合作论文数2JJ BRANTS合作论文数2Cj Durrant合作论文数2
 Anton M. Koekemoer合作论文数Space Telescope Science Institute2David B Guenther合作论文数2Richard D. Robinson合作论文数2
 Andre Basil Fletcher合作论文数Massachusetts Institute of Technology2Peter D. Edmonds合作论文数2Richard D Robinson合作论文数2
 Anne M. Green合作论文数Particle Cosmology Group, School of Physics & Astronomy, Faculty of Science, University of Nottingham2N. E. B. Killeen合作论文数2Jean Aboudarham合作论文数2
 Rogier Windhorst合作论文数School of Earth and Space Exploration, Arizona State University2
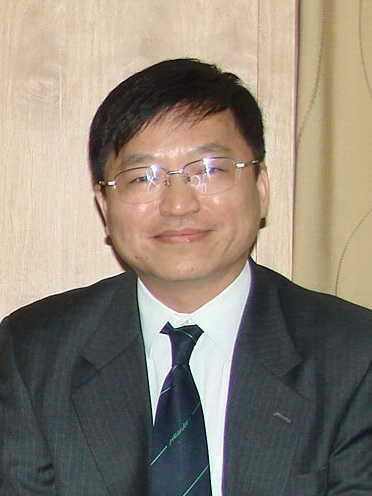 Weiqun Gan (甘为群)合作论文数Purple Mountain Observatory, Chinese Academy of Sciences2Cornelis Zwaan合作论文数2Alan H. Nye合作论文数2B. Rocca-Volmerange合作论文数2
 David john Cooke合作论文数Department of Psychology, Glasgow Caledonian University2




