In Paper I (Rowan-Robinson 2024), models derived in 2009 to fit mid-infrared (8-24 micron) source counts from the IRAS, ISO and Spitzer missions, were found to provide an excellent fit to deep counts at 7.7-21 mu with JWST, demonstrating that the evolution of dusty star-forming galaxies is well understood. Here the treatment of optical spectral energy distributions (SEDs) is improved and the counts are extended to 5.6 mu and optical wavelengths. The models proved a good fit to the latest, deeper, JWST counts. The models are also extended to radio and X-ray wavelengths. Predicted redshift distributions are given for a range of wavelengths and flux-densities.
Models derived in 2009 to fit mid-infrared (8-24 micron) source counts from the IRAS, ISO and Spitzer missions, provide an excellent fit to deep counts with JWST, demonstrating that the evolution of dusty star-forming galaxies is well understood. The evolution of dust in galaxies at high redshifts is discussed and a simple prescription is proposed to model this. This allows more realistic models for source-counts at submillimetre wavelength. A reasonable fit to 250, 500, 850 and 1100 micron counts is obtained. This paper therefore draws together the IRAS, ISO, Spitzer, Akari, Herschel, submillimetre ground-based, and JWST surveys into a single picture.
We discuss the synergies between heliospheric and dust science, the open science questions, the technological endeavors and programmatic aspects that are important to maintain or develop in the decade to come. In particular, we illustrate how we can use interstellar dust in the solar system as a tracer for the (dynamic) heliosphere properties, and emphasize the fairly unexplored, but potentially important science question of the role of cosmic dust in heliospheric and astrospheric physics. We show that an Interstellar Probe mission with a dedicated dust suite would bring unprecedented advances to interstellar dust research, and can also contribute-through measuring dust - to heliospheric science. This can, in particular, be done well if we work in synergy with other missions inside the solar system, thereby using multiple vantage points in space to measure the dust as it `rolls' into the heliosphere. Such synergies between missions inside the solar system and far out are crucial for disentangling the spatially and temporally varying dust flow. Finally, we highlight the relevant instrumentation and its suitability for contributing to finding answers to the research questions.
I have carried out a search for Planet 9 in the IRAS data. At the distance range proposed for Planet 9, the signature would be a 60 micron unidentified IRAS point source with an associated nearby source from the IRAS Reject File of sources which received only a single hours-confirmed (HCON) detection. The confirmed source should be detected on the first two HCON passes, but not on the third, while the single HCON should be detected only on the third HCON. I have examined the unidentified sources in three IRAS 60micron catalogues: some can be identified with 2MASS galaxies, Galactic sources or as cirrus. The remaining unidentified sources have been examined with the IRSA Scanpi tool to check for the signature missing HCONs, and for association with IRAS Reject File single HCONs. No matches of interest survive. For a lower mass planet (< 5 earth masses) in the distance range 200-400 AU, we expect a pair or triplet of single HCONs with separations 2-35 arcmin. Several hundred candidate associations are found and have been examined with Scanpi. A single candidate for Planet 9 survives which satisfies the requirements for detected and non-detected HCON passes. A fitted orbit suggest a distance of 225+-15 AU and a mass of 3-5 earth masses. Dynamical simulations are needed to explore whether the candidate is consistent with existing planet ephemerides. If so, a search in an annulus of radius 2.5-4 deg centred on the 1983 position at visible and near infrared wavelengths would be worthwhile.
ABSTRACTWe study stellar and black hole mass assembly in a sample of 42 infrared-luminous galaxy mergers at z < 0.3 by combining results from radiative transfer modelling with archival measures of molecular gas and black hole mass. The ratios of stellar mass, molecular gas mass, and black hole mass to each other are consistent with those of massive gas-rich galaxies at z < 0.3. The advanced mergers may show increased black hole mass to stellar mass ratios, consistent with the transition from active galactic nucleus (AGN) to ellipticals and implying substantial black hole mass growth over the course of the merger. Star formation rates are enhanced relative to the local main sequence, by factors of ∼100 in the starburst and ∼1.8 in the host, respectively. The starburst star formation rates appear distinct to star formation in the main sequence at all redshifts up to at least z ∼ 5. Starbursts may prefer late-stage mergers, but are observed at any merger stage. We do not find evidence that the starbursts in these low-redshift systems substantially increase the total stellar mass, with a soft upper limit on the stellar mass increase from starburst activity of about a factor of two. In contrast, 12 objects show evidence for super-Eddington accretion, associated with late-stage mergers, suggesting that many AGN in infrared-luminous mergers go through a super-Eddington phase. The super-Eddington phase may increase black hole mass by up to an order of magnitude at an accretion efficiency of $42\pm 33{{\ \rm per\ cent}}$ over a period of 44 ± 22 Myr. Our results imply that super-Eddington accretion is an important black hole growth channel in infrared-luminous galaxies at all redshifts.
We present the ultraviolet to submillimetre spectral energy distributions (SEDs) of the HERschel Ultra Luminous Infrared Galaxy Survey (HERUS) sample of 42 local ultraluminous infrared galaxies (ULIRGs) and fit them with a Markov chain Monte Carlo (MCMC) code using the CYprus models for Galaxies and their NUclear Spectra (CYGNUS) radiative transfer models for starbursts, active galactic nucleus (AGN) tori and host galaxy. The Spitzer IRS spectroscopy data are included in the fitting. Our bayesian SED fitting method takes comparable time to popular energy balance methods but it is more physically motivated and versatile. All HERUS galaxies harbor high rates of star formation but we also find bolometrically significant AGN in all of the galaxies of the sample. We estimate the correction of the luminosities of the AGN in the ULIRGs due to the anisotropic emission of the torus and find that it could be up to a factor of ∼10 for nearly edge-on tori. We present a comparison of our results with the smooth torus model of Fritz et al. and the two-phase models of Siebenmorgen et al. and SKIRTOR. We find that the CYGNUS AGN torus models fit significantly better the SEDs of our sample compared to all other models. We find no evidence that strong AGN appear either at the beginning or end of a starburst episode or that starbursts and AGN affect each other. IRAS 01003-2238 and Mrk 1014 show evidence for dual AGN in their SED fits suggesting a minimum dual AGN fraction in the sample of 5
There is significant scientific value to be gained from combining AKARI fluxes with data at other far-IR wavelengths from the IRAS and Herschel missions. To be able to do this we must ensure that there are no systematic differences between the datasets that need to be corrected before the fluxes are compatible with each other. One such systematic effect identified in the BSCv1 data is the issue of beam corrections. We determine these for the BSCv2 data by correlating ratios of appropriate IRAS and AKARI bands with the difference in 2MASS J band extended and point source magnitudes for sources cross matched between the IRAS FSC, AKARI BSCv2 and 2MASS catalogs. We find significant correlations (p<< 10^-13) indicating that beam corrections are necessary in the 65 and 90 micron bands. We then use these corrected fluxes to supplement existing data in spectral energy distribution (SED) fits for ultraluminous infrared galaxies in the HERUS survey. The addition of AKARI fluxes makes little difference to the results of simple (T,beta) fits to the SEDs of these sources, though there is a general decrease in reduced chi^2 values. The utility of the extra AKARI data, however, is in allowing physically more realistic SED models with more parameters to be fit to the data. We also extend our analysis of beam correction issues in the AKARI data by examining the Herschel Reference Sample, which have Herschel photometry from 100 to 500 microns and which are more spatially extended than the HERUS ULIRGs. Thirty-four of the HRS sources have good Herschel SEDs and matching data from AKARI. This investigation finds that our simple 2MASS-based beam correction scheme is inadequate for these larger and more complex sources. There are also indications that additional beam corrections at 140 and 160 microns are needed for these sources, extended on scales >1 arcminute.
We explore the relationship between the hard X-ray and submillimetre populations using deep Chandra observations of a large, contiguous SCUBA survey. In agreement with other recent findings, we confirm that the direct overlap is small. Of the 17 submillimetre sources detected in this field at 850 μm, only one is coincident with a Chandra source. The resulting limits imply that the majority of SCUBA sources are not powered by acive galactic nuclei (AGN), unless the central engine is obscured by Compton-thick material with a low (<1 per cent) scattered component. Furthermore, since Chandra detects only ∼ 5 per cent of SCUBA sources, the typical obscuration would need to be almost isotropic. The X-ray upper limits are so strong that in most cases we can also rule out a starburst spectral energy distribution at low redshift, suggesting that the majority of SCUBA sources lie at z > 1, even if they are purely starburst galaxies. Despite the low detection rate, we find evidence for strong angular clustering between the X-ray and submillimetre populations. The implication is that AGN and SCUBA sources trace the same large-scale structure but do not generally coincide. If bright submillimetre sources represent massive elliptical galaxies in formation, we suggest that (for a given galaxy) the major episode of star formation must be distinct from the period of observable quasar
Aims. We aim to study the far-infrared radio correlation (FIRC) at 150 MHz in the local Universe (at a median redshift ⟨z⟩∼0.05) and improve the use of the rest-frame 150 MHz luminosity, L150, as a star-formation rate (SFR) tracer, which is unaffected by dust extinction.Methods. We cross-match the 60 μm selected Revised IRAS Faint Source Survey Redshift (RIFSCz) catalogue and the 150 MHz selected LOFAR value-added source catalogue in the Hobby-Eberly Telescope Dark Energy Experiment (HETDEX) Spring Field. We estimate L150 for the cross-matched sources and compare it with the total infrared (IR) luminosity, LIR, and various SFR tracers.Results. We find a tight linear correlation between log L150 and log LIR for star-forming galaxies, with a slope of 1.37. The median qIR value (defined as the logarithm of the LIR to L150 ratio) and its rms scatter of our main sample are 2.14 and 0.34, respectively. We also find that log L150 correlates tightly with the logarithm of SFR derived from three different tracers, i.e., SFRHα based on the Hα line luminosity, SFR60 based on the rest-frame 60 μm luminosity and SFRIR based on LIR, with a scatter of 0.3 dex. Our best-fit relations between L150 and these SFR tracers are, log L150 (L⊙) = 1.35(±0.06) × log SFRHα (M⊙ yr−1) + 3.20(±0.06), log L150 (L⊙) = 1.31(±0.05) × log SFR60 (M⊙ yr−1) + 3.14(±0.06), and log L150 (L⊙) = 1.37 (±0.05) × log SFRIR (M⊙ yr−1) + 3.09(±0.05), which show excellent agreement with each other.
The z 1⁄4 2:286 IRAS galaxy F10214 þ 4724 remains one of the most luminous galaxies in the Universe, despite its gravitational lens magnification. We present optical and near-infrared spectra of F10214 þ 4724, with clear evidence for three distinct components: lines of width ,1000 km s from a Seyfert 2 nucleus; & 200 km s lines which are likely to be associated with star formation; and a broad (,4000 km s) C III] 1909-Å emission line which is blueshifted by ,1000 km s with respect to the Seyfert 2 lines. Our study of the Seyfert 2 component leads to several new results. (i) From the double-peaked structure in the Lya line, and the lack of Lyb, we argue that the Lya photons have emerged through a neutral column of NH , 2:5 × 10 m, possibly located within the AGN narrow-line region, as proposed for several high-redshift radio galaxies. (ii) The resonant O VI 1032, 1036-Å doublet (previously identified as Lyb) is in an optically thick (1:1) ratio. At face value this implies an extreme density (ne , 10 17 m) more typical of broad-line region clouds. However, we attribute this instead to the damping wings of Lyb from the resonant absorption. (iii) A tentative detection of He II 1086 suggests little extinction in the rest frame ultraviolet.
We have used two catalogues, a Herschel catalogue selected at 500 μm (HerMES) and an IRAS catalogue selected at 60 μ m (RIFSCz), to contrast the sky at these two wavelengths. Both surveys demonstrate the existence of “extreme” starbursts, with star-formation rates (SFRs) > 5000 M ⊙ yr −1 . The maximum intrinsic star-formation rate appears to be ~30 000 M ⊙ yr −1 . The sources with apparent SFR estimates higher than this are in all cases either lensed systems, blazars, or erroneous photometric redshifts. At redshifts between three and five, the time-scale for the Herschel galaxies to make their current mass of stars at their present rate of star formation is ~10 8 yr, so these galaxies are making a significant fraction of their stars in the current star-formation episode. Using dust mass as a proxy for gas mass, the Herschel galaxies at redshift three to five have gas masses comparable to their mass in stars. Of the 38 extreme starbursts in our Herschel survey for which we have more complete spectral energy distribution (SED) information, 50% show evidence for QSO-like optical emission, or exhibit AGN dust tori in the mid-infrared SEDs. In all cases however the infrared luminosity is dominated by a starburst component. We derive a mean covering factor for AGN dust as a function of redshift and derive black hole masses and black hole accretion rates. There is a universal ratio of black-hole mass to stellar mass in these high redshift systems of ~10 −3 , driven by the strong period of star-formation and black-hole growth at z = 1−5.
We discuss a new IRAS Faint Source Catalog galaxy redshift catalogue (RIFSCz) which incorporates data from Galex, SDSS, 2MASS, WISE, Akari and Planck. Akari fluxes are consistent with photometry from other far infrared and submillimetre missions provided an aperture correction is applied. Results from the Hermes-SWIRE survey in Lockman are also discussed briefly, and the strong contrast between the galaxy populations selected at 60 and 500 mu is summarized.
We present the implications for cosmic inflation of the Planck measurements of the cosmic microwave background (CMB) anisotropies in both temperature and polarization based on the full Planck survey, which includes more than twice the integration time of the nominal survey used for the 2013 release papers. The Planck full mission temperature data and a first release of polarization data on large angular scales measure the spectral index of curvature perturbations to be n(s) = 0.968 +/- 0.006 and tightly constrain its scale dependence to dn(s)/dln k = -0.003 +/- 0.007 when combined with the Planck lensing likelihood. When the Planck high-l polarization data are included, the results are consistent and uncertainties are further reduced. The upper bound on the tensor-to-scalar ratio is r(0).(002) < 0.11 (95% CL). This upper limit is consistent with the B-mode polarization constraint r < 0.12 (95% CL) obtained from a joint analysis of the BICEP2/Keck Array and Planck data. These results imply that V(phi) proportional to phi(2) and natural inflation are now disfavoured compared to models predicting a smaller tensor-to-scalar ratio, such as R-2 inflation. We search for several physically motivated deviations from a simple power-law spectrum of curvature perturbations, including those motivated by a reconstruction of the inflaton potential not relying on the slow-roll approximation. We find that such models are not preferred, either according to a Bayesian model comparison or according to a frequentist simulation-based analysis. Three independent methods reconstructing the primordial power spectrum consistently recover a featureless and smooth P-R (k) over the range of scales 0.008 Mpc(-1) less than or similar to k less than or similar to 0.1 Mpc(-1). At large scales, each method finds deviations from a power law, connected to a deficit at multipoles l approximate to 20-40 in the temperature power spectrum, but at an uncompelling statistical significance owing to the large cosmic variance present at these multipoles. By combining power spectrum and non-Gaussianity bounds, we constrain models with generalized Lagrangians, including Galileon models and axion monodromy models. The Planck data are consistent with adiabatic primordial perturbations, and the estimated values for the parameters of the base Lambda cold dark matter (Lambda CDM) model are not significantly altered when more general initial conditions are admitted. In correlated mixed adiabatic and isocurvature models, the 95% CL upper bound for the non-adiabatic contribution to the observed CMB temperature variance is vertical bar alpha(non-adi)vertical bar < 1.9%, 4.0%, and 2.9% for CDM, neutrino density, and neutrino velocity isocurvature modes, respectively. We have tested inflationary models producing an anisotropic modulation of the primordial curvature power spectrum finding that the dipolar modulation in the CMB temperature field induced by a CDM isocurvature perturbation is not preferred at a statistically significant level. We also establish tight constraints on a possible quadrupolar modulation of the curvature perturbation. These results are consistent with the Planck 2013 analysis based on the nominal mission data and further constrain slow-roll single-field inflationary models, as expected from the increased precision of Planck data using the full set of observations.
We use 3035 Herschel-SPIRE 500 mu m sources from 20.3 deg(2) of sky in the HerMES Lockman, ES1 and XMM-LSS areas to estimate the star formation rate density at z = 0-6. 500 mu m sources are associated first with 350 and 250 mu m sources, and then with Spitzer 24 mu m sources from the SWIRE photometric redshift catalogue. The infrared and submillimetre data are fitted with a set of radiative-transfer templates corresponding to cirrus (quiescent) and starburst galaxies. Lensing candidates are removed via a set of colour-colour and colour-redshift constraints. Star formation rates are found to extend from <1 to 20 000 M-circle dot yr(-1). Such high values were also seen in the all-sky IRAS Faint Source Survey. Star formation rate functions are derived in a series of redshift bins from 0 to 6, combined with earlier far-infrared estimates, where available, and fitted with a Saunders et al (1990) functional form. The star formation rate density as a function of redshift is derived and compared with other estimates. There is reasonable agreement with both infrared and ultraviolet estimates for z < 3, but we find higher star formation rate densities than ultraviolet estimates at z = 3-6. Given the considerable uncertainties in the submillimetre estimates, we cannot rule out the possibility that the ultraviolet estimates are correct. But the possibility that the ultraviolet estimates have seriously underestimated the contribution of dust-shrouded star formation can also not be excluded.
We present the most significant measurement of the cosmic microwave background (CMB) lensing potential to date (at a level of 40 sigma), using temperature and polarization data from the Planck 2015 full-mission release. Using a polarization-only estimator we detect lensing at a significance of 5 sigma. We cross-check the accuracy of our measurement using the wide frequency coverage and complementarity of the temperature and polarization measurements. Public products based on this measurement include an estimate of the lensing potential over approximately 70% of the sky, an estimate of the lensing potential power spectrum in bandpowers for the multipole range 40<L<400 and an associated likelihood for cosmological parameter constraints. We find good agreement between our measurement of the lensing potential power spectrum and that found in the best-fitting LCDM model based on the Planck temperature and polarization power spectra. Using the lensing likelihood alone we obtain a percent-level measurement of the parameter combination $\sigma_8 \Omega_m^{0.25} = 0.591\pm 0.021$. We combine our determination of the lensing potential with the E-mode polarization also measured by Planck to generate an estimate of the lensing B-mode. We show that this lensing B-mode estimate is correlated with the B-modes observed directly by Planck at the expected level and with a statistical significance of 10 sigma, confirming Planck's sensitivity to this known sky signal. We also correlate our lensing potential estimate with the large-scale temperature anisotropies, detecting a cross-correlation at the 3 sigma level, as expected due to dark energy in the concordance LCDM model.
We used wide-area surveys over 39 deg^2 by the HerMES (Herschel Multi-tiered Extragalactic Survey) collaboration, performed with the Herschel Observatory SPIRE multiwavelength camera, to estimate the low-redshift, 0.02 \lt z \lt 0.5, monochromatic luminosity functions (LFs) of galaxies at 250, 350 and 500 μm. Within this redshift interval, we detected 7087 sources in five independent sky areas, \tilde40 per cent of which have spectroscopic redshifts, while for the remaining objects photometric redshifts were used. The SPIRE LFs in different fields did not show any field-to-field variations beyond the small differences to be expected from cosmic variance. SPIRE flux densities were also combined with Spitzer photometry and multiwavelength archival data to perform a complete spectral energy distribution fitting analysis of SPIRE detected sources to calculate precise k-corrections, as well as the bolometric infrared (IR; 8-1000 μm) LFs and their low-z evolution from a combination of statistical estimators. Integration of the latter prompted us to also compute the local luminosity density and the comoving star formation rate density (SFRD) for our sources, and to compare them with theoretical predictions of galaxy formation models. The LFs show significant and rapid luminosity evolution already at low redshifts, 0.02 \lt z \lt 0.2, with L_\IR\^\*\ \prop (1+z)^\6.0\plusmn 0.4\ and Φ _\IR\^\*\ \prop (1+z)^\-2.1\plusmn 0.4\, L_\250\^\*\ \prop (1+z)^\5.3\plusmn 0.2\ and Φ _\250\^\*\ \prop (1+z)^\-0.6\plusmn 0.4\ estimated using the IR bolometric and the 250 μm LFs, respectively. Converting our IR LD estimate into an SFRD assuming a standard Salpeter initial mass function and including the unobscured contribution based on the UV dust-uncorrected emission from local galaxies, we estimate an SFRD scaling of SFRD_0 + 0.08z, where SFRD_0 ∼e (1.9 \plusmn 0.03) × 10^-2 [M_⊙ Mpc^-3] is our total SFRD estimate at z \tilde 0.02.
The Planck High Frequency Instrument (HFI) has observed the full sky at six frequencies (100, 143, 217, 353, 545, and 857 GHz) in intensity and at four frequencies in linear polarization (100, 143, 217, and 353 GHz). In order to obtain sky maps, the time-ordered information (TOI) containing the detector and pointing samples must be processed and the angular response must be assessed. The full mission TOI is included in the Planck 2015 release. This paper describes the HFI TOI and beam processing for the 2015 release. HFI calibration and map-making are described in a companion paper. The main pipeline has been modified since the last release (2013 nominal mission in intensity only), by including a correction for the non-linearity of the warm readout and by improving the model of the bolometer time response. The beam processing is an essential tool that derives the angular response used in all the Planck science papers and we report an improvement in the effective beam window function uncertainty of more than a factor 10 relative to the 2013 release. Noise correlations introduced by pipeline filtering function are assessed using dedicated simulations. Angular cross-power spectra using datasets which are decorrelated in time are immune to the main systematic effects.
 David L Clements合作论文数Department of Physics, Faculty of Natural Sciences, Imperial College London149
 Alberto Franceschini合作论文数Department of Physics and Astronomy, Padova University;Science Faculty, Padua University129
 s oliver合作论文数124
 Duncan Farrah合作论文数Department of Physics & Astronomy, University of Hawai'i at Manoa114
 Mattia Vaccari合作论文数Department of Physics and Astronomy, University of the Western Cape101
 Douglas Scott合作论文数Department of Physics & Astronomy, The University of British Columbia95
 Stephen Serjeant合作论文数Centre for Astrophysics and Planetary Science;School of Physical Sciences;University of Kent;School of Physical Sciences, University of Kent93
 James J. (Jamie) Bock合作论文数The Division of Physics, Mathematics and Astronomy, California Institute of Technology;Jet Propulsion Laboratory, California Institute of Technology91David L. Shupe合作论文数86
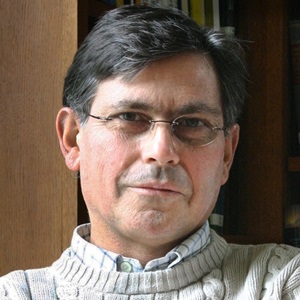 George Efstathiou合作论文数Institute of Astronomy, University of Cambridge;King's College, University of Cambridge78
 Guilaine Lagache合作论文数Galaxies, Etoiles et COsmologie Department, Laboratoire d’Astrophysique de Marseille74
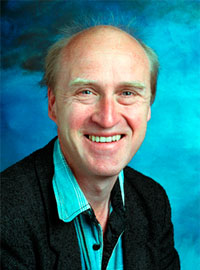 Andy Lawrence合作论文数Institute for Astronomy, School of Physics and Astronomy, University of Edinburgh70
 Andreas Efstathiou合作论文数Department of Computer Science and Engineering, School of Sciences, European University Cyprus70I. Pérez Fournon合作论文数68
 Richard Mcmahon合作论文数Institute of Astronomy, University of Cambridge66
 Luigi Danese合作论文数SISSA65
 Evanthia Hatziminaoglou合作论文数European Southern Observatory63
 Eduardo González Solares合作论文数Institute of Astronomy, University of Cambridge60
 Dimitra Rigopoulou合作论文数Department of Physics, University of Oxford;Brasenose College, University of Oxford60S. J. Oliver合作论文数58
 Bruno Maffei合作论文数Sch. of Phys. & Astron., Univ. of Manchester;c;Sch. of Phys. & Astron., Univ. of Manchester56
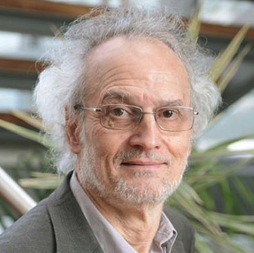 Jean-Loup Puget合作论文数Institut d'Astrophysique Spatiale, Centre National de la Recherche Scientifique;Institut d'Astrophysique Spatiale, University of Paris-Sud 1155
 Matt Griffin合作论文数Cardiff Hub for Astrophysics Research and Technology, School of Physics and Astronomy, Cardiff University53T. Babbedge合作论文数52
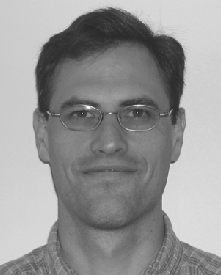 J. Glenn合作论文数University of Colorado51
 Rob Ivison合作论文数European Southern Observatory;University of Edinburgh;Macquarie University;Dublin Institute for Advanced Studies51m j page合作论文数50L. Wang合作论文数48I. Perez-Fournon合作论文数48
 Andrew Blain合作论文数Astrophysics Division, School of Physics and Astronomy, University of Leicester47Marian Douspis合作论文数Université Paris-Saclay47Maria Del Carmen Polletta合作论文数Center for Astrophysics and Space Sciences;University of California , San Diego;Center for Astrophysics and Space Sciences, University of California , San Diego47R. J. Laureijs合作论文数ISO Science Operations, ESA Astronomy Division47
 Carol J. Lonsdale合作论文数46
 Francois-Xavier Désert合作论文数Institut de Planétologie et d'Astrophysique de Grenoble;Université Grenoble Alpes46
 François Bouchet合作论文数Laboratoire d'Informatique de Paris 6, Sorbonne Université;CNRS;Institut d'Astrophysique de Paris46H. Dole合作论文数45
 Francesco Piacentini合作论文数Dipartimento di Fisica, Sapienza - Università di Roma45Etienne Pointecouteau合作论文数45
 Ivan Valtchanov合作论文数CEA45
 Daniel Mortlock合作论文数Astrophysics Group, Department of Physics, Faculty of Natural Sciences, Imperial College London;Department of Mathematics, Imperial College London;Stockholm University45
 Guillaume Patanchon合作论文数45
 Eduardo Ibar Plasser合作论文数Universidad de Valparaíso45
 Jacques Delabrouille合作论文数Astronomy Department, Shanghai Jiao Tong University;Laboratoire AstroParticule et Cosmologie45
 n mandolesi合作论文数44
 Andrea Zacchei合作论文数Osservatorio Astronomico di Trieste44
 Gianfranco De Zotti合作论文数INAF - Astronomical Observatory of Padova44
 D. Novikov合作论文数Astro-Space Center, P.N.Lebedev Physical Institute44
 Mike Hobson合作论文数The Cavendish Laboratory, Department of Physics, University of Cambridge;Trinity Hall College, University of Cambridge;Cambridge Inference Ltd44




