Surveys collected with a 10-m-long lighter amphibious resupply cargo (LARC) vessel and a 3.3-m-long jetski are evaluated by comparison with surveys using the 11-m-tall coastal research amphibious buggy (CRAB) in calm and rough sea states representing the lower and upper operational bounds when considering safety and data quality. The centimeter-level accuracy of CRAB surveys, performed since 1981, is well established. The field test consisted of repetitively surveying two cross-shore profile lines from near the shoreline to 6-m water depth, 700 m offshore. The survey lines were repeated four times by the CRAB and nine to ten times by the LARC and jetski. The CRAB data were averaged to define a reference cross-shore elevation and profile shape to serve as ground truth to determine the accuracy of the LARC and jetski surveys. The two systems compare best with the CRAB surveys on the mildly sloping shoreface, seaward of the nearshore sandbar, where alongshore currents were weakest, depth-limited breaking waves were infrequent, and small-scale morphological features that may not be resolved by the CRAB were minimal. The root mean square (RMS) elevation error between the LARC measurements and the CRAB mean profile was 0.03 m under calm conditions and 0.05 m under rougher conditions, whereas the jetski RMS was 0.09 and 0.10 m, respectively.
Currents in the swash zone on a sandy Atlantic coast beach estimated with near-field optical remote sensing by tracking breaking-wave-generated foam with particle image velocimetry (PIV) are similar to those measured with in situ acoustic Doppler velocimeters (ADVs). The observations were obtained from a 40-m-tall tower located about 60 m inland of the beach over a 2-month period, yielding 180 h of data during a wide range of incident wave and local foam conditions. A smaller, overlapping set of observations also was obtained from a drone. The remote sensing estimates of mean alongshore flows, and the magnitude and phase of cross-shore flows, are highly correlated with the in situ measurements. However, the remote sensing estimates tend to underestimate the in situ measurements of downrush flows and overestimate the uprush flows, with the differences becoming smaller as the amount of foam increases. Analysis with drone-based images suggests that higher image resolution improves agreement between remotely sensed and in situ measurements, particularly for time-averaged cross-shore flows, but a nadir view angle does not eliminate persistent cross-shore bias. The remote sensing estimates allow for swash zone currents to be estimated both across and along the swash zone with relatively high spatial resolution, and show strong cross-shore gradients, including direction reversals in alongshore currents. In addition, the remote sensing estimates indicate flow patterns associated with the formation of beach cusps during times of submergence when low-tide topographic surveys are not feasible.
Currents transport sediment, larvae, pollutants, and people across and along the surfzone, creating a dynamic interface between the coastal ocean and shore. Previous fi eld studies of nearshore fl ows primarily have relied on relatively low spatial resolution deployments of in situ sensors, but the development of remote sensing techniques using optical imagery and naturally occurring foam as a fl ow tracer has allowed for high spatial resolution observations (on the order of a few meters) across the surfzone. Here, algorithms optical current meter (OCM) and particle image velocimetry (PIV) are extended from previous surfzone applications and used to estimate both cross-shore and alongshore 2-, 10-, and 60-min mean surface currents in the nearshore using imagery from both oblique and nadir viewing angles. Results are compared with in situ current meters throughout the surfzone for a wide range of incident wave heights, directions, and directional spreads. Differences between remotely sensed fl ows and in situ current meters are smallest for nadir viewing angles, where georectification is simplified. Comparisons of 10-min mean fl ow estimates from a nadir viewing angle with in situ estimates of alongshore and cross-shore currents had correlations r 2 = 0.94 and 0.51 with root-mean-square differences (RMSDs) = 0.07 and 0.16 ms21 for PIV and r 2 = 0.88 and 0.44 with RMSDs = 0.08 and 0.22 ms21 for OCM. Differences between remotely sensed and in situ cross-shore current estimates are at least partially owing to the difference between onshore-directed mass fl ux on the surface and offshore-directed undertow in the mid-water column.
High‐tide flooding—minor, disruptive coastal inundation—is expected to become more frequent as sea levels rise. However, quantifying just how quickly high‐tide flooding rates are changing, and whether some places experience more high‐tide flooding than others, is challenging. To quantify trends in high‐tide flooding from tide‐gauge observations, flood thresholds—elevations above which flooding begins—must be specified. Past studies of high‐tide flooding in the United States have used different data sets and approaches for specifying flood thresholds, only some of which directly relate to coastal impacts, which has lead to sometimes conflicting and ambiguous results. Here we present a novel method for quantifying, with uncertainty, high‐tide flooding thresholds along the United States coast based on sparsely available impact‐based flood thresholds. We use those newly modeled thresholds to make an updated assessment of changes in high‐tide flooding across the United States over the past few decades. From 1990–2000 to 2010–2020, high‐tide flooding rates almost certainly (probability ) increased along the United States East Coast, Gulf Coast, California, and Pacific Islands, while they very likely decreased along Alaska during that time; significant changes in high‐tide flooding rates between the two decades were not detected in Oregon, Washington, and the Caribbean. Averaging spatially, we find that high‐tide flooding rates probably more than doubled nationally between 1990–2000 and 2010–2020. Our approach lays a foundation for future studies to more accurately model high‐tide flood thresholds and trends along the global coastline.
Nearshore circulation patterns such as rip currents and eddies transport bacteria, sediment, and people across and along the surf zone, affecting beach safety, coastal morphology, and marine wildlife (Grant et al. 2005). Recent phase-resolving modeling studies suggest nearshore circulation patterns and the associated vorticity are linked to bathymetric and incident wave conditions. Persistent eddies correspond to the length scales of the underlying bathymetric variations (order 100 m), whereas small-scale (order 10 m) vorticity increases with wave directional spread (O’Dea et al. 2021, Baker et al. 2021). However, these numerically generated hypotheses have not been tested with field observations, largely due to the challenge of instrumenting the surf zone with sufficient spatial resolution (Holman and Haller 2013). Here, remote sensing techniques provide high spatial resolution estimates of surface flows in the surfzone for a range of conditions, allowing hypotheses about the impacts of bathymetry and incident waves on surfzone vorticity to be examined with field data.
Waves running up and down the beach ('swash') at the landward edge of the ocean can cause changes to the beach topology, can erode dunes, and can result in inland flooding. Despite the importance of swash, field observations are difficult to obtain in the thin, bubbly, and potentially sediment laden fluid layers. Here, swash excursions along an Atlantic Ocean beach are estimated with a new framework, V-BeachNet, that uses a fully convolutional network to distinguish between sand and the moving edge of the wave in rapid sequences of images. V-BeachNet is trained with 16 randomly selected and manually segmented images of the swash zone, and is used to estimate swash excursions along 200 m of the shoreline by automatically segmenting four 1-h sequences of images that span a range of incident wave conditions. Data from a scanning lidar system are used to validate the swash estimates along a cross-shore transect within the camera field of view. V-BeachNet estimates of swash spectra, significant wave heights, and wave-driven setup (increases in the mean water level) agree with those estimated from the lidar data.
Low-frequency, many-minute-period horizontal surfzone eddies are an important mechanism for the dispersion of material, transporting larvae, pollutants, sediment, and swimmers both across and along the nearshore. Previous numerical, laboratory, and field observations on alongshore uniform bathymetry with no or roughly uniform mean background flows suggest that the low-frequency eddies may be the result of a two-dimensional inverse energy cascade that transfers energy from relatively small spatial-scale vorticity injected by depth limited breaking waves to larger and larger spatial scales. Here, using remotely sensed high-spatial resolution estimates of currents, those results are extended to surfzones with strong complex mean circulation patterns [flows O(1 m/s)] owing to nonuniform bathymetry. Similar to previous results, wavenumber spectra and second-order structure functions calculated from the observations are consistent with a two-dimensional inverse energy cascade. The size of the largest eddies is shown to depend on the surfzone width and the spatial scales of the mean currents. Third-order structure functions also are consistent with an inverse cascade for spatial scales greater than ∼50 m. At smaller scales, the third-order structure functions suggest a mixture of inverse and forward cascades.
Storms can have long-term impacts on the groundwater flows and subsurface salinity structure in coastal aquifers. Previous studies have shown that tides, wave driven infiltration, and storm surge elevate the groundwater level within the beach (Nielsen 1999, Cartwright 2004). The resulting bulge of high groundwater propagates inland, and may cause flooding up to several days after a storm has passed (Gallien 2016). In addition, waves, tides, and storm surge force saltwater to infiltrate into the aquifer above the fresher terrestrial groundwater, and storm-driven pulses of salinity may persist for months (Robinson et al. 2014). Here, observations of groundwater heads and salinities collected continuously for three years are used to examine the effects of ocean storms, wind-driven fluctuations in sound water levels, and morphological changes on a barrier island aquifer.
Extreme storms can cause rapid morphological changes that pose high risk to society (Sallenger 2000). Semiempirical and process-based models often are used to simulate storm-induced coastal processes (Roelvink et al. 2009, Palmsten & Holman 2012, Stockdon et al. 2014, Overbeck et al. 2017). However, there are few observations of surfzone waves and currents during extreme storms. Therefore, parameterizations often are calibrated by minimizing model-data errors for pre- to post-storm bathymetric and topographic changes, and the accuracy of the simulated processes during the storm is unknown. Here, surf, swash, and dune observations collected near Duck, NC, USA, will be used to investigate wave processes and dune erosion during the passage of recent (2015-2017) Hurricanes.
Prior studies have shown that frictional changes owing to evolving geometry of an inlet in a multiple inlet-bay system can affect tidally driven circulation. Here, a step between a relatively deep inlet and a shallow bay also is shown to affect tidal sea-level fluctuations in a bay connected to multiple inlets. To examine the relative importance of friction and a step, a lumped element (parameter) model is used that includes tidal reflection from the step. The model is applied to the two-inlet system of Katama Inlet (which connects Katama Bay on Martha's Vineyard, MA to the Atlantic Ocean) and Edgartown Channel (which connects the bay to Vineyard Sound). Consistent with observations and previous numerical simulations, the lumped element model suggests that the presence of a shallow flood shoal limits the influence of an inlet. In addition, the model suggests an increasing importance of friction relative to the importance of the step as an inlet shallows, narrows, and lengthens, as observed at Katama Inlet from 2011 to 2014.
Bacterial pathogens in coastal sediments may pose a health risk to users of beaches. Although recent work shows that beach sands harbor both indicator bacteria and potential pathogens, it is not known how deep within beach sands the organisms may persist nor if they may be exposed during natural physical processes. In this study, sand cores of approximately 1 m depth were collected at three sites across the beach face in Kitty Hawk, North Carolina before, during and after large waves from an offshore hurricane. The presence of DNA from the fecal indicator bacterium Enterococci was detected in subsamples at different depths within the cores by PCR amplification. Erosion and accretion of beach sand at the three sites also was determined for each sampling day. The results indicate that ocean beach sands with persisting enterococci signals could be exposed and redistributed when wind, waves, and currents cause beach erosion or accretion.
 Steve Elgar合作论文数Applied Ocean Physics & Engineering Department, Woods Hole Oceanographic Institution11
 Britt Raubenheimer合作论文数Woods Hole Oceanographic Institution11
 Mara M. Orescanin合作论文数Department of Oceanography, Naval Postgraduate School, 1 University Circle, SP-331B, Monterey, CA 939432
 Heidi Wadman合作论文数1Nick Spore合作论文数1Rachel Housego合作论文数1
 Reza Salatin合作论文数Dept Civil & Environm Engn, Northeastern Univ1
 Sönke Dangendorf合作论文数Old Dominion University1
 Philip R. Thompson合作论文数University of Hawaii Honolulu1
 Annika O'Dea合作论文数Sch Civil & Construct Engn, Oregon State Univ1
 Qin Chen合作论文数Department of Civil & Environmental Engineering, College of Engineering, Northeastern University;Marine Science Center, Department of Marine and Environmental Sciences, College of Engineering, Northeastern University;Coastal Hazards Research Collaboratory, Louisiana State University;Department of Civil and Environmental Engineering, Louisiana State University;Center for Computation & Technology, Louisiana State University1
 Thomas Wahl合作论文数School of Engineering, Faculty of Engineering and Physical Sciences, University of Southampton1
 Xin Li (李昕)合作论文数Section of Visual Computing and Computational Media, College of Performance, Visualization, and Fine Arts, Texas A&M University;Department of Computer Science and Engineering, College of Engineering, Texas A&M University1
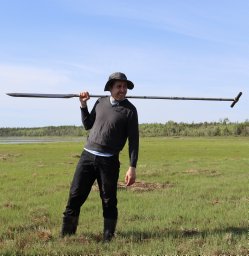 Christopher G. Piecuch合作论文数Atmospheric and Environmental Research, Inc.1
 Jesse McNinch合作论文数1
 Benjamin Hamlington合作论文数Jet Propulsion Laboratory, California Institute of Technology1Patrick J. Dickhudt合作论文数1
 Sarah B. Das合作论文数Department of Geosciences and Environment Institute;Pennsylvania State University;University Park;Department of Geosciences and Environment Institute, Pennsylvania State University1
 Rebecca J. Gast合作论文数Biology Department1




