To identify baseline imaging features in patients with liver cancer that best correlate with Yttrium-90 (90Y) distribution on immediate post-procedural single photon emission computed tomography (SPECT) and predict tumor response to radioembolization (RE). This retrospective study included 38 patients with hepatocellular carcinoma (HCC) (n=23) and non-HCC hepatic malignancies (n=15) who underwent 40 resin-based RE treatments. Multi-phasic contrast-enhanced MR or CT imaging was obtained prior to and bremsstrahlung SPECT within two hours after RE. Total (TTV, cm³) and enhancing tumor volume (ETV, cm³, and percent), tumor (TB, percent) and enhancing tumor burden (ETB percent) were volumetrically assessed on baseline imaging. After multimodal image registration of baseline MRI or CT and SPECT/CT, 90Y distribution was quantified on SPECT as tumor-to-normal-liver-ratio (TNR). Up to two dominant lesions per treated lobe were analyzed. Follow-up imaging within 4 months was available for 23 patients with 25 lobar treatments, and was used for response assessment according to the quantitative European Association for the Study of the Liver (qEASL) criteria. Statistical tests included Mann-Whitney-U, Pearson correlation, and linear regression. In HCC patients (18/23 males, mean age 62.39±8.62 years) with 34 dominant lesions, high baseline ETV% significantly correlated with a high TNR on SPECT, demonstrating greater 90Y uptake in the tumor relative to the liver parenchyma (p<0.001). In non-HCC patients (9/15 males, mean age 61.13±11.51 years) with 24 dominant lesions, a correlation between ETV% and TNR was observed as well (p=0.039). With regards to tumor response, the change of ETV% significantly correlated with TNR in HCC (p=0.039) but not in non-HCC patients (p=0.886). Additionally, Child-Pugh class B patients had significantly more 90Y deposition in non-tumorous liver (p=0.021) and had a greater lung shunt fraction (p=0.049) compared to Child-Pugh A patients. This study identified ETV% as a quantifiable imaging biomarker on pre-procedural MRI and CT to predict 90Y distribution on post-RE SPECT. Additionally, this study validated the 90Y dose-response-relationship for HCC treated with RE.
The study investigates semi-automated segmentation and classification of tumor components in hepatocellular carcinoma (HCC) by comparing performances of different mathematical models. This retrospective analysis included 67 patients (mean age=63.89 years, 7 females, 60 males) post-transarterial chemoembolization (TACE) presenting with advanced stage nodular HCC tumors with central necrosis. Tumor and necrosis ground truth masks were manually segmented on arterial-phase MRI scans with a 3D segmentation software1. Four 3D image analysis algorithms2 (Gaussian Mixture Model [GMM], isocluster and two variants of qEASL3 (qEASL Sub (qSub) and qEASLy (qY)) which threshold using remote regions) were run on ground truth to generate output masks classifying viable tumor and necrosis. Each algorithm was evaluated by comparing its generated masks to the ground truth using the Dice Similarity Coefficient2 (DSC). Within-subjects ANOVA and pairwise t-tests with Bonferroni corrections were performed to compare accuracy of each model. Mean DSCs for viable tumor and necrosis were the following: GMM (0.80±0.10,0.43±0.24), Isocluster (0.80±0.10,0.37±0.24), qSub (0.74±0.23,0.38±0.22) and qY (0.64±0.27,0.35±0.20). Statistically significant differences were noted between mean DSCs for viable tumor (p<0.0005) and necrosis (p=0.003). Table 1 indicates pairwise comparisons of models for viable tumor and necrosis with statistically significant differences. Viable tumor was better targeted by GMM, Isocluster and qSub than qY. Necrosis was better targeted by GMM than Isocluster, qSub and qY. Findings suggest GMM is a more accurate model considering both viable tumor and necrosis classification. Limitations include strict tumor selection criterion and requirement of detailed segmentations as input volumes for each model. Used as verification tool these results can guide and help post-treatment prognosis.Table 1SignificanceTestingMean Difference/StdP ValueTUMGMM-qY0.163/0.035<0.0005Iso-qY0.167/0.036<0.0005qSub-qY0.107/0.0280.002NECGMM-Iso0.056/0.0180.02GMM-qSub0.049/0.0160.02GMM-qY0.078/0.0190.001 Open table in a new tab
The purpose of this study was to compare the efficacy and safety of conventional transarterial chemoembolization (cTACE) with drug-eluting beads (DEB)-TACE in patients with hepatocellular carcinoma (HCC) without portal venous thrombosis (PVT). This retrospective analysis included a total of 370 patients with HCC, who were treated with either cTACE (N = 248) or DEB-TACE (N = 122) between 2000 and 2014. Clinical and biochemical toxicities of Grade ≥3 (CTAEv4) were recorded for all patients. Survival analysis was conducted using uni- and multivariate Cox proportional hazards models and Kaplan-Meier analysis using log-rank test and propensity score weighting via a generalized boosted model. In addition, sub-group analysis was performed to compare survival after cTACE and DEB-TACE stratified according to tumor size (>3 cm or >5 cm) and tumor morphology (infiltrative vs. nodular) on baseline imaging. There was no significant difference in the prevalence of adverse events except for abdominal pain/discomfort which occurred more frequently after DEB-TACE (87.1%) than after cTACE (75.1%, p = .02). The median overall survival (MOS) of the entire cohort was 28.1 mo. There was no significant difference in MOS between cTACE (19.5 mo) and DEB-TACE (22.2 mo) patients after propensity score weighing (p = .405). However, in patients with infiltrative disease, cTACE achieved significantly longer MOS (12.1 mo) compared to DEB-TACE (8.6 mo; p = .033). Conversely, in patients with nodular disease, DEB-TACE patients (25.4 mo) demonstrated significantly greater survival compared to cTACE patients (23.5 mo; p = .023). Stratification according to tumor size did not achieve a significant separation of survival curves. This study did not demonstrate a significant difference in efficacy and toxicity between cTACE and DEB-TACE for the treatment of HCC without PVT. However, subgroup analysis of the cohort revealed that cTACE showed superior efficacy in patients with infiltrative disease whereas DEB-TACE was more effective in nodular tumors. Thus, tumor morphology and distribution on baseline imaging should be used as a parameter to inform decisions on the selection of embolic materials for TACE.
To evaluate Lipiodol washout time after conventional transarterial chemoembolization (cTACE) in different hepatic malignancies including intrahepatic cholangiocarcinoma (ICC) as well as hepatic metastatic neuroendocrine tumors (NET) and colorectal carcinoma (CRC). This retrospective study included 41 patients, who underwent cTACE for the treatment of ICC (n = 9), NET (n = 14) or CRC metastases to the liver (n = 12). Lipiodol volume (LV) in cm3 was analyzed on follow-up non-contrast CT imaging obtained within 24 hours (LV1) as well as 40-220 days (LV2) after cTACE using a volumetric segmentation and image analysis software (qEASL; Medisys, Philips Research, Suresnes, France). The lipiodol washout rate was calculated as the ratio of (LV1-LV 2) to the interval (in days) between both CT scans. Additionally, tumor response on contrast-enhanced MRI was assessed 1 month after cTACE according to qEASL criteria. Lipiodol was visible on all follow-up CT scans. The LV2 was significantly lower than LV1 in all three tumors types (p<0.001). The mean lipiodol washout rate was -0.034 for ICC, -0.045 for NET, and -0.034 cm3/day for CRC metastases. No significant difference in lipiodol washout rates was observed between the three types of tumors (p>0.05). As for tumor response, 2/9 ICC patients, 4/14 NET patients and 5/18 CRC patients demonstrated response to cTACE according to qEASL criteria. However, no difference in lipiodol washout rate was revealed between responders and non-responders (p>0.05). This study showed that lipiodol washout rates after cTACE were similar for different hepatic malignancies including ICC, NET and CRC metastases. All observed tumors showed consistent washout regardless of response suggesting that lipiodol washout rate may not be predictive of tumor response to treatment.
Imaging based response assessment after transcatheter arterial chemoembolization (TACE) plays a crucial role for therapeutic decision and especially challenging in patients with infiltrative, ill-delineated tumor masses. In this work, we evaluated the ability of 3D quantitative European Association for the Study of the Liver [qEASL] analysis in patients with multi-focal or infiltrative (ambiguous tumor border) HCC on a whole liver basis. This retrospective study included 104 patients with infiltrative or multifocal (≥3 lesions) HCC treated by TACE from 2001-13. Semi-automated 3D quantification software was used to segment the whole liver (Philips Research, Suresnes, France) and calculate the enhancing tumor burden [ETB] on multi-phasic contrast-enhanced MR imaging upon registration before and 1 month after first TACE. The MR bias field image artifacts were corrected (BioImage Suite, Yale). The calculation of the ETB before and after TACE was used to assess response. Survival analysis included Kaplan-Meier curves with log-rank test and Cox regression. Cutoffs distinguishing responders from non-responders including baseline volumetric ETB, from 400-cm3, 439 cm3, 500 cm3, 600 cm3 and % change in volumetric ETB, from 30%, 35%, 39%, 40%, 45% and 50%. Akaike information criterion (AIC) was used to determine optimal cutoff threshold to predict survival. Mean ETB decreased significantly after TACE from 449.4 cm3 to 326.2 cm3 (p<0.01). There was significant survival difference between baseline ETB responders (16.8-22.2months) and non-responders (10.2-12.7months); all cutoffs p<0.01. Based on AIC, the 400-cm3 response cutoff provided the best predictive model (HR:2.00, 95%CI: 1.27-3.16, p<0.01). There also was significant survival difference in % volume change of volumetric ETB between responders (18.0-18.5months) and non-responders (6.9-10.2months); cutoffs only 30%, 35%, 39%, 40% p<0.01. The 30% response cutoff provided the best predictive model (HR:0.47, 95%CI: 0.29-0.75, p<0.01). Volumetric changes in ETB after the first TACE and baseline ETB can be used to evaluate the tumor response and predict survival early in patients with infiltrative, multifocal HCC.
To evaluate the use of volumetric enhancement of hepatocellular carcinoma (HCC) lesions on dual-phase C-arm cone-beam computed tomography (DP-CBCT) acquired immediately before drug-eluting beads transarterial chemoembolization (DEB-TACE) as a predictor of tumor response. This single-institution retrospective study was HIPAA-compliant and IRB-approved. 16 HCC lesions in 16 patients (10 men, mean age: 66.1 years) were treated with DEB-TACE. Three sets of images were obtained for each patient: Baseline contrast enhanced magnetic resonance imaging (CE-MRI) 4-6 weeks before TACE, intra-procedural DP-CBCT immediately before TACE, and CE-MRI 4-6 weeks post TACE. Volumetric tumor enhancement on arterial phase images was assessed on a voxel-by-voxel basis for all modalities and characterized using qEASL criteria. Findings on follow-up MRI were compared to baseline MRI to assess response and this response was compared to findings on DP-CBCT assessed immediately before therapy using linear regression. The mean enhancement on DP-CBCT was calculated and used as a threshold to separate patients into two groups. Each group was then correlated separately with treatment response. The relative tumor enhancement (in %) observed immediately before therapy on DP-CBCT demonstrated a strong correlation with therapy-related reduction of MR enhancement (R2 = .835; P < .0001). Patients with greater relative volumetric enhancement of lesions directly before TACE demonstrated substantially higher reduction of volumetric enhancement on follow-up MRI and thus a higher rate of response. 6/16 patients were classified as responders according to qEASL criteria. The mean enhancement calculated on DP-CBCT was 55.3% and separated patients into two groups of 8. Enhancement below the mean on DP-CBCT was correlated with 0% response at follow-up while enhancement above the mean was associated with 75% response. 3D quantitative assessment of HCC lesionenhancement on DP-CBCT immediately before DEB-TACEis strongly coorelated with volumetric reduction of tumorenhancement on follow-up CE-MRI.Greater tumorenhancement on DP-CBCT immediately prior to treatmentmay be an early predictor of treatment response.
To determine the predictive value of tumor enhancement on baseline imaging in patients with liver-dominant colorectal cancer metastases undergoing loco-regional tumor therapies. This retrospective study included 86 patients with colorectal cancer (CRC) liver metastases, treated with TACE (n = 42) or Y90 radioembolization (n = 46) between 2001 and 2014. All patients received contrast-enhanced MRI prior to therapy. Semi-automated whole-liver and tumor segmentations of three dominant lesions were performed on baseline MRI to calculate total tumor and liver volumes (TTV and TLV). Quantitative 3D analysis was performed to calculate enhancing tumor volume (ETV), enhancing tumor burden (ETB, calculated as ETV/TLV), and enhancing liver volume (ELV). 1 A 65 cm3 cutoff was chosen for TTV and ETV, and 4% was chosen as the cutoff for ETB. 2 For ELV, absolute and relative cutoff values (1081 cm3 for volume and 50% for relative enhancement) were chosen, respectively. The predictive value of each parameter was assessed by Cox proportional hazard model and Kaplan-Meier survival analysis was performed (statistical significance defined as p < .05). Significant correlation of the tumor load with survival was seen for ETV (HR 2.2 [95% CI 1.4-3.6], p = 0.001) and ETB (HR 2.2 (95% CI 1.3-3.7], p = 0.004) but not for TTV or ELV. In a multivariate analysis, age, gender, treatment modality, ECOG status were not identified as confounders. Tumor enhancement of CRC liver metastases on baseline MR imaging is strongly associated with patient survival after loco-regional tumor therapy, suggesting that ETV and ETB are better prognostic indicators than non-predictive total tumor volume. A potential implication of these findings as novel staging markers warrants prospective validation.
To determine clinical outcome of patients with vestibular schwannoma (VS) after treatment with fractionated stereotactic radiotherapy (FSRT) and single-session stereotactic radiosurgery (SRS) by using 3D quantitative response assessment on MRI.
This study explored the ability of 3D quantitative CT image analysis to predict the hepato-pulmonary shunt fraction (HPSF) in patients with hepatocellular carcinoma (HCC) before Yttrium90 (Y90) radioembolization.
To evaluate the clinical utility of cone beam CT (CBCT) navigation software during chemoembolization of liver tumors using clinical metrics such as radiation dose, contrast dose and procedure time. An IRB approved prospective randomized multicenter trial (NCT01818440) enrolled patients undergoing chemoembolization for liver tumors and randomized them to standard CBCT and angiography or CBCT with navigation. Patients were eligible if they were scheduled for selective or sub-selective chemoembolization. Contrast use, procedure time, number of vessels supplying tumor and selectivity of injection, were recorded. Optical stimulated luminescent dosimeters (OSLD) were placed on all 4 quadrants to measure radiation. Various other radiation dose metrics were recorded. The study enrolled 28 patients (average age 65 years) who underwent 36 chemoembolization sessions. Preliminary data analysis on subset of patients demonstrated that contrast use was 97mL for CBCT navigation vs. 134mL for CBCT/DSA. The mean radiation dose measured by OSLD for CBCT/DSA 167914mRad 160961mRad in CBCT navigation, a 4% radiation dose reduction. There was minimal difference in procedure time between the two groups. CBCT navigation resulted in 38mL less contrast used. CBCT navigation resulted in 4% reduction of mean skin radiation dose measured by OSLD compared to CBCT/DSA.
 Jeff Geschwind合作论文数Vein Clinics and Oncology Centers, USA Clinics Group;Syntactx;Clinical and Scientific Affairs, Imaging Endpoints, LLC;Cage Pharma;Philips Healthcare30
 R. Duran合作论文数19Gocke Christopher D合作论文数Dept Pathol, Johns Hopkins Univ19James R. Eshleman合作论文数Dept Pathol, Johns Hopkins Univ19J. Chapiro合作论文数16Ruediger Schernthaner合作论文数14Jean-Francois H. Geschwind合作论文数13
 Vania Tacher合作论文数12Nikhil Bhagat合作论文数11
 Julius Chapiro合作论文数Bioimaging Sciences, Radiology & Biomedical Imaging, Yale School of Medicine, Yale University10L. Haley合作论文数8
 Romaric Loffroy合作论文数CHU Dijon Bourgogne;University of Bourgogne8
 Sohn Jae Ho合作论文数Phillips Exeter Academy8R. Xian合作论文数6d lesage合作论文数6K. Beierl合作论文数6
 Roberto Ardon合作论文数Aff1 Aff26zhenlian wang合作论文数5Pramod Rao合作论文数5Li-Hui Tseng合作论文数5
 Benoit Mory合作论文数Philips Medical Systems Research Paris5
 Olivier Pellerin合作论文数Radiologie Cardiovasculaire, HEGP5G. Zheng合作论文数4
 Constantine Frangakis合作论文数Department of Biostatistics, Bloomberg School of Public Health, Johns Hopkins University;Center for Global Health, Bloomberg School of Public Health, Johns Hopkins University4
 Todd Schlachter合作论文数Interventional Radiology, Radiology & Biomedical Imaging, Yale School of Medicine, Yale University4
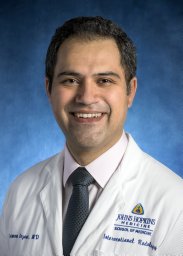 Nezami Nariman合作论文数Drug Appl Res Ctr, Tabriz Univ Med Sci4
 Cornish Toby C合作论文数Dept Pathol, Johns Hopkins Univ4
 Lynn Jeanette Savic合作论文数Berlin Institute of Health in der Charité;Department of Radiology, Campus Virchow-Klinikum, Charité – Universitätsmedizin Berlin4
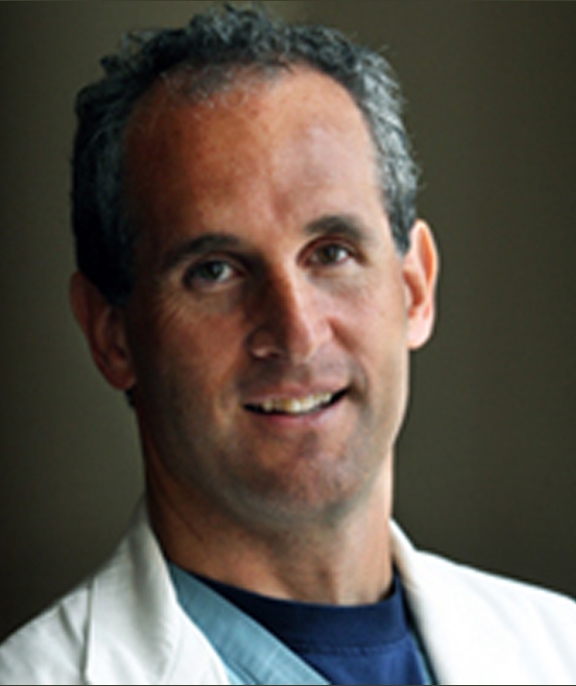 Bradford Wood合作论文数Center for Interventional Oncology, National Institutes of Health, U.S. Department of Health & Human Services;Clinical Center, National Institutes of Health, U.S. Department of Health & Human Services4
 Rafael Duran合作论文数4Pallavajjala Aparna合作论文数4
 Andrew L Lewis合作论文数School of Engineering and Materials Science, Queen Mary University of London;University of Brighton;Owen Mumford Ltd;Alchemed Bioscience Consulting Ltd4Diane K. Reyes合作论文数4
 Alessandro Radaelli合作论文数4Matthew R. Dreher合作论文数4
 Karun V. Sharma合作论文数Medical College of Virginia School of Medicine, Virginia Commonwealth University4S. Mosier合作论文数3w shao合作论文数3V Charu合作论文数3z wang合作论文数3Susanne Smolka合作论文数Sch Med, Yale Univ3
 Michael G. Goggins合作论文数Department of Pathology, School of Medicine, Johns Hopkins University;Division of Gastroenterology and Hepatology, The Johns Hopkins Hospital;Early Detection of Pancreatic Cancer Laboratory, Johns Hopkins University3
 Hans J. Lee合作论文数Department of Medicine, School of Medicine, Johns Hopkins Univeristy3
 Christopher Wolfgang合作论文数Department of Surgery, School of Medicine, New York University;Johns Hopkins School of Medicine3Gacchina Carmen合作论文数3
 Ralph Hruban合作论文数Department of Oncology, Johns Hopkins University School of Medicine;The Sol Goldman Pancreatic Cancer Research Center, Johns Hopkins University3
 Michael Grass合作论文数Philips Research Europe Sector Medical Imaging Systems3Yiqing Tang合作论文数3
 Sahar Mirpour合作论文数3




