The potential of dense Sentinel-2 time series to serve as a basis for operational crop monitoring systems is hindered by cloud cover, especially at high latitudes. Sentinel-1 data can overcome this limitation, but similar to optical data, are prone to saturation, i.e. when changes in vegetation biomass are not reflected in the remote sensing signal. Time-integration is a strategy commonly used in optical remote sensing to mitigate saturation effects. In this pilot study, we tested whether this approach can also improve the relationship between Sentinel-1 backscatter and maize traits, using Sentinel-1 A and B backscatter data. Our test site consisted of a forage maize experimental field in Sweden. Evaluated plant traits included the number of leaves, the phenological stage, the leaf area index, the dry matter yield and the dry matter content. Linear and logistic models were adjusted between time-integrated values of the backscattering coefficient ([Formula: see text], [Formula: see text], [Formula: see text] and [Formula: see text]) and field-measured traits. Our results indicate a good agreement between Sentinel-1 time-integrated signal and maize traits, with [Formula: see text] of 0.97, 0.93, 0.94, 0.95 and 0.86 for phenological stage, leaf number, leaf area index, dry matter yield and dry matter content, respectively, and systematically outperformed models built with non-cumulative [Formula: see text] values. Our findings also indicate that the time-integrated models perform equally well with data acquired from a single Sentinel-1 satellite. These results, if confirmed for a wider range of geographical extent and management conditions, could pave the way for a remote sensing-based, weather-independent and saturation-insensitive decision support tool.
I projektet utvecklade och utvärderade vi ett modelleringsupplägg för satellitbaserad skördekartering på regional nivå, fältnivå och inom fält. Modelleringen baserades på Sentinel‑2‑bilder i kombination med medelskördar per gård insamlade av SCB. Genomsnittligt medelabsolutfel (MAE) för predikterade gårdsmedelskördar var 0,7 t ha⁻¹ för höstvete (Triticum aestivum L.) och 0,8 t ha⁻¹ för vårkorn (Hordeum vulgare L.) när prediktionerna gjordes efter skörd, och något högre (0,9 respektive 0,8 t ha⁻¹) vid skördeprognoser i slutet av juni. Prognoser på regional nivå var mer träffsäkra (MAE: 0,6 respektive 0,5 t ha⁻¹ för de båda grödorna), och regionala medelskördar kunde skattas med bibehållen noggrannhet även när antalet gårdsmedelskördar i kalibreringen minskades med en tredjedel. Jämförelser mellan satellitbaserade skördekartor och skördekartor från tröskor (20 m upplösning) visade varierande överensstämmelse, vilket förmodligen till stor del förklaras av osäkerheter i tröskdata, men även i viss mån av osäkerhet i de satellitbaserade kartorna samt den utjämnande effekt som modelleringen ger. Båda datakällorna har begränsningar, men satellitbaserade kartor har fördelen att de kan tas fram utan extra utrustning och med mindre krav på databearbetning. För den aktuella tillämpningen fungerade enkla linjära modeller med två vegetationsindex (NDWI och NDRE76) lika bra eller bättre än mer komplex maskininlärning med många index, vilken tenderade till överanpassning och sämre generalisering till nya gårdar och år. Detta betonar vikten av robust validering när kalibreringsdata är osäkra. Satellitbaserade skördekartor från flera år lades samman och två typer av kartor togs fram: relativa skördekartor och frekvenskartor för låg skörd. Dessa användes för att identifiera stabila och instabila problemområden inom fält. Variationsmönstren stämde ofta överens med lantbrukarnas lokalkännedom om till exempel dräneringsproblem, viltskador och markanvändningshistorik, men kartorna avslöjade också tidigare mindre uppmärksammade områden med låg skörd. Kartunderlagen kan användas både för att stödja åtgärder för att höja skörden (där det är möjligt) och för att anpassa insatser till den faktiska skördepotentialen (där förbättring inte är möjlig). Moln, molnskuggor och dis begränsar ibland möjligheten till satellitbaserad skördekartering. Ett mindre test med syntetiska molnfria Sentinel‑2‑tidsserier indikerade att sådana data kan vara en gångbar lösning. Testet visade också att sambandet mellan optiska vegetationsindex och spannmålsskörd ofta är starkast i senare delen av juni (sen blomning–tidig mjölkmognad). Mot bakgrund av resultaten rekommenderas fortsatt utveckling av användarvänliga system med: (i) förbättrad och förenklad hantering av skördedata från tröskor, (ii) integrering av skördekartering (både trösk- och satellitbaserad) i beslutsstödsystem för precisionsodling, (iii) funktioner för flerårsanalyser och manuell tolkning av dessa med stöd av kompletterande data, samt (iv) möjligheter att analysera relativa skördar inom närområden (t.ex. inom några kilometers radie) som underlag för rådgivning och en produktiv och resurseffektiv växtodling.
This chapter presents an overview of proximal sensing techniques used in practical precision agriculture, with the overall aim of contributing to more sustainable crop production. To provide perspective on the usefulness of crop sensors, the chapter starts with an example of why site-specific crop management is important and how it relates to sustainable production. The basics of crop canopy reflectance are then presented, followed by an introduction to two practical precision agriculture techniques, site-specific weed management and real-time crop sensing, mainly focusing on within-field nitrogen application. Two case studies in which different types of proximal sensors are used, individually or in combination with other techniques (UAVs and satellites), are described. Finally, potential future developments are briefly discussed.
Cadmium (Cd) is a toxic metal, which in some production areas reaches levels above allowed limits in cereals. Thus, reducing its concentration in cereals is crucial for mitigating health risks and complying with food safety regulations. This review evaluates strategies to reduce Cd accumulation in cereal grains by mitigating soil Cd contamination and its bioavailability to plants. It covers methods for Cd estimation in soil and explores biological, chemical, and genetic approaches to limit Cd uptake by crops. The effectiveness of these strategies depends on genetic factors, soil properties, and crop type. Key approaches include traditional breeding, genome editing, digital and predictive soil mapping, and silicon (Si) and selenium (Se) supplementation. Traditional breeding, enhanced by modern genetic tools, enables the development of high-yielding, low-Cd cultivars but is time-consuming. Genome editing, particularly CRISPR-Cas9, offers precise gene modifications to reduce Cd uptake but faces regulatory constraints. Digital and predictive soil mapping provide high-resolution maps for targeted interventions but require extensive calibration. Silicon supplementation is a promising approach, as it competes with Cd for uptake sites, and limits Cd translocation to edible plant parts. Additionally, Si enhances plant tolerance to abiotic stresses, making it a multifunctional solution. Selenium supplementation can also reduce Cd accumulation while offering health benefits. However, the effectiveness of both Si and Se vary with dosage and crop type. An integrated approach combining these strategies is essential for effective Cd reduction in cereals. Continued research, technological advancements, and supportive policies are crucial for ensuring safe and sustainable cereal production.
Det är utmanande att producera tillräckliga volymer spannmål som uppfyller kvalitetskriterierna för barnmatsråvara, främst på grund av strikta gränsvärden för tungmetaller och mykotoxiner. Med bättre underlag i form av digitala kartor och väderbaserade riskmodeller, som tillgängliggörs i ändamålsenliga beslutssystem, kan man arbeta mer effektivt med sourcing (råvaruförsörjning), spårbarhet och kvalitetssäkring. Det ger möjlighet att öka kapaciteten att producera svensk spannmålsråvara med barnmatskvalitet, både för inhemsk konsumtion och export, och samtidigt ställa hållbarhetskrav på odlingen. Med förbättrade modeller i digitala beslutsstöd för växtodlare kan man lättare optimera resurseffektiviteten, vilket bidrar till förverkligandet av nationella och internationella miljö- och klimatmål. T.ex. kan satellitbaserade kartunderlag användas för att med högre rumslig upplösning anpassa gödselgivor till lokala behov (s.k. precisionsodling). I projektet Baby Grain Passport har vi arbetat med följande frågor i fyra arbetspaket: 1) Till vilka områden bör man styra barnmatsodlingen för att säkerställa att kadmiumhalten i grödan är så låg som möjligt? 2) Hur kan man kartera – och ta hänsyn till – varierande skördenivåer inom fält när man anpassar gödselgivor? 3) Hur kan man undvika mykotoxiner som kan bildas vid odling och lagring? 4) Hur kan man ta kombinera statiska och dynamiska beslutsunderlag för effektivare sourcing och logistik av spannmål med specialkvalitet? Markinformation från miljöövervakning och mätkampanjer som Mark- och grödoinventeringen samt Jordbruksverkets åkermarksprovtagning, utgör en värdefull grund för att kunna kartlägga och undvika risk för höga kadmiumhalter i spannmålspartier. Genom att kombinera punktobservationer med högupplöst bakgrundsinformation enligt principer för digital markkartering togs detaljerade riskkartor för höga kadmiumhalter i matjord fram. I samverkan med SLUs miljöövervakning har sedan metoden generaliserats till ett ramverk för digital åkermarkskartering (Åkermarksdatakuben, ÅMDK), som kan användas för att förhållandevis snabbt ta fram nya eller uppdaterade kartprodukter även över flera andra tungmetaller – i projektet gjordes en test med kartläggning av nickelhalter i mark och i havre. I kartläggningsarbetet blev det tydligt att vissa geografiska områden är särskilt lämpade för produktion av spannmål till barnmat. Risken för att påträffa kadmiumhalter (och nickelhalter) över gränsen för barnmat i havre och vete är liten i t.ex. stora delar av Västsverige (Halland, Västra Götaland och Värmland). Resultat från kadmiumkarteringen i marken finns tillgänglig här: https://bit.ly/sannolika_kadmiumhalter.. Precisionsstyrning av växtnäring tillämpas idag ganska brett men det finns utrymme till ytterligare förbättring, t.ex. genom att hänsyn tas till varierande skördepotential inom fält. För att kunna göra det behövs effektiva metoder att generera underlag i form av detaljerade skördekartor. Fritt tillgängliga satellitdata kan nyttjas för förenklad skördekartering, utan krav på egen utrustning. När det gäller satellitbaserad skördekartering är det lämpligt att arbeta på en något grövre upplösning än den ursprungliga upplösningen hos satellitbilderna, t.ex. 40 m eller ett antal homogena zoner inom fält. Modellerna blir mer tillförlitliga om de bygger på ett vegetationsindex som är känsligt får grödans vattenstatus (NDWI) och om man använder satellitdata från ett relativt sent utvecklingsstadium (nära mjölkmognad), alternativt tidsserier av data från uppkomst fram till detta stadium. Prognossystem och mätprogram för mykotoxinerna DON och T2+HT2 är nödvändiga för att under pågående säsong informera inköpsprocessen samt för fortsatt kunskapsuppbyggnad kring biologi och utbredning av de fusariumsvampar som bildar toxinerna. För att säkert komma under det nya gränsvärde för T2+HT2, som från och med 2024 gäller för skalad havre till barnmat, bör man ha halter <40 ppb i oskalad havre (vilket är vad som mäts vid spannmålsmottagning). I de provtagningar och kartläggningar som gjorts kan vi se att förekomsten av höga halter av DON och T2+HT2 varierar geografiskt och mellan år. Högre halter av T2+HT2-toxinerna (vilka är mindre väl undersökta och mer toxiska än DON) är kopplade till varmare och torrare väder under juli samt förekomst av T2+HT2 i närområdet föregående år. När det gäller DON bör halten ligga under 200 ppb i obearbetad spannmål för att man med säkerhet ska komma under gränsvärdet för barnmat i bearbetade produkter. Baserat på data från 80 fältförsök i havre utvecklades fler väderbaserade prognosmodeller för att bedöma om den halten kommer att överskridas. Den prognosmodell som fungerade bäst gav 70 % korrekta klassificeringar, vilket bedöms tillräckligt bra för att vara användbart som riskindikator. Det är viktigt att övervaka lagrad spannmål för att tidigt upptäcka, avvikelser och risk för mykotoxin-bildning. Experiment i små testsilor visade att när koldioxidhalterna steg över 500 ppm, kunde man observera en tydlig tillväxt av mögelsvampar i lagrad vete. Koldioxidövervakning kan därför vara lovande som metod för tidig detektion av lagermögeltillväxt med risk för toxinbildning. Inköp av spannmål med särskilda kvalitetskrav är en kritisk process som i grova drag innebär att man utifrån ställda krav hittar de volymer som är bäst lämpade. Lantmännen utvecklar nu sina interna strategier och system för inköp och logistik av spannmål med specialkvaliteter. Genom att nyttja bl.a. framtagna riskkartor och riskmodeller från projektet som underlag, kan man få en säkrare urvalsbas och bli effektivare. I processen kan man samtidigt ställa krav på att råvaran är hållbart odlad. Det är denna levande infrastuktur av data, metoder och rutiner som utgör Baby Grain Passport.
Within precision agriculture, yield mapping is important in the evaluation of crop management and delineation of management zones. It can also be used to assess within-field yield potential, in order to guide different precision agriculture practices. However, some farmers do not have a yield monitoring system, and some who do may obtain incomplete or erroneous yield data. This study examined the accuracy with which winter wheat (Triticum aestivum L.) yield could be mapped in 18 fields in southern Sweden using a simple empirical relationship between Sentinel-2 (ESA, Paris, France) data, vegetation index (VI) maps and combined harvester data collected in nearby fields. The results showed that a decrease in map resolution to 40 m reduced the error in the yield maps obtained. Normalised difference water index (NDWI) was the most efficient VI, while a combination of satellite data from earlier and later plant development (booting and milk development stages) performed slightly better than data for other development stages and combinations. The best-performing model at a within-field scale (40-m resolution) had an average mean absolute error (MAE) of 0.40 tonnes ha-1 in a leave-one-field-out cross validation. When the prediction model at field-means scale was applied on 69 farms in a 1055 km2 area, MAE was 0.75 tonnes ha-1 when comparing predictions with mean yields reported by farmers in a phone survey. Therefore, if adequate combined harvester and/or mean yield data are available, a modelling framework that translates satellite imagery into yield maps on-the-fly could be made available for different stakeholders via decision support systems for precision agriculture.
Yield mapping is important for evaluation of crop management and for delineation of management zones. In this study, a simple approach was developed to map winter wheat (Triticum aestivum L.) yield in fields missing combine yield data, based on yield data from other fields in the neighbourhood combined with Sentinel-2 data (ESA, EU). The study focused on which vegetation index (VI), which growth stage and which spatial resolution was optimal for yield mapping. The results showed that the VI map resolution did not significantly affect the mapping model, a combination of bands in the short-wave infrared and near infrared region was the most efficient in yield mapping and that satellite data from later growth stages (in the milk development stage) were better in mapping the final yield if compared with earlier stages.
Forages are the most important kind of crops at high latitudes and are the main feeding source for ruminant-based dairy industries. Maximizing the economic and ecological performances of farms and, to some extent, of the meat and dairy sectors require adequate and timely supportive field-specific information such as available biomass. Sentinel-2 satellites provide open access imagery that can monitor vegetation frequently. These spectral data were used to estimate the dry matter yield (DMY) of harvested forage fields in northern Sweden. Field measurements were conducted over two years at four sites with contrasting soil and climate conditions. Univariate regression and multivariate regression, including partial least square, support vector machine and random forest, were tested for their capability to accurately and robustly estimate in-season DMY using reflectance values and vegetation indices obtained from Sentinel-2 spectral bands. Models were built using an iterative (300 times) calibration and validation approach (75% and 25% for calibration and validation, respectively), and their performances were formally evaluated using an independent dataset. Among these algorithms, random forest regression (RFR) produced the most stable and robust results, with Nash–Sutcliffe model efficiency (NSE) values (average ± standard deviation) for the calibration, validation and evaluation of 0.92 ± 0.01, 0.55 ± 0.22 and 0.86 ± 0.04, respectively. Although relatively promising, these results call for larger and more comprehensive datasets as performances vary largely between calibration, validation and evaluation datasets. Moreover, RFR, as any machine learning algorithm regression, requires a very large dataset to become stable in terms of performance.
Intake of cadmium (Cd) via vegetable food poses a possible health risk. Cereals are one of the major sources of Cd, and the Cd concentration in the soil has a great effect on the levels in the grain. The aim of the study was to produce decision support for identification of areas suitable for low-Cd winter wheat production in the form of a detailed digital soil map covering an important agricultural region in southern Sweden. A two-step approach was used: (1) we increased the number of soil Cd observations by combining two sets of soil samples, one with laboratory Cd analyses (304 samples) and one with predicted Cd from a portable x-ray fluorescent (PXRF) sensor (2097 samples); and (2) a digital soil mapping (DSM) model (gradient boosting regression) was calibrated on all 2401 soil samples to create a soil Cd concentration map using a number of covariates, of which airborne gamma ray data was identified as the most important. In the first step, cross-validation of the PXRF model obtained a model efficiency (E) of 0.82 and mean absolute error (MAE) of 0.08 mg kg−1. The DSM model had an E of 0.69 and MAE of 0.11 mg kg−1. The map of predicted soil Cd concentrations were compared against 307 winter wheat (Triticum aestivum L.) grain samples with laboratory-analyzed Cd concentrations. Areas in the map with low soil Cd concentrations had a high frequency of lower grain Cd concentrations. The map thus seemed to have potential for finding areas suitable for production of low-Cd winter wheat; e.g., for baby food.
Optimised nitrogen (N) fertilisation can be used to increase farm profits, to realise the achievement of quality goals for produce, and to reduce environmental risks in the form of leaching and/or volatilisation of N compounds from the fields. This study examined options and challenges for remote sensing-based variable rate supplemental N fertilisation in winter wheat (Triticum aestivum L.). The models were based on data from ten field trials conducted in different regions across Sweden over three years. A two-step approach for modelling optimal N rates, suitable for practical implementation in precision agriculture, was developed and evaluated. The expected accuracies for new sites and years were assessed by leave-one-entire-trial-out cross-validation. In a first step, the average N rate was modelled from site-specific information, including data that can be obtained from on-farm experiments, i.e. N uptake in plots without N fertilisation (zero-plots) and N uptake in plots with nonlimiting N supply (max-plots). In the second step, additions or subtractions from this average N rate was modelled based on vegetation indices (VIs) mapped by remote sensing. Mean absolute error of the best prediction was 14 kg N ha (-1). In a practical application, however, there will be additional uncertainty from several sources, e.g. uncertainty in the assessment of yield potential. The best mean N rate model was based on geographical region, cultivar, N uptake in zero-plots and yield potential, while the best model of relative N rate within the field used a new multispectral index (d75r6), which was designed to give a standardized measure of the steepness of the red edge of reflectance of a crop canopy spectrum. Several other multispectral VIs also performed well but red-green-blue indices were less useful. We conclude that remote sensing (to capture within-field spatial variation patterns), on-farm experiments (to determine the field mean N rate), and the farmers' experience and knowledge on local conditions (e.g. to assess the yield potential), is a useful combination of information sources in decision support systems for variable rate application of N. Options and remaining research needs for the setup of such a system are discussed.
Digital soil mapping (DSM) of topsoil copper (Cu) concentrations and prediction intervals covering 90% of agricultural land in Sweden was performed, in order to identify areas at risk of Cu deficiency. A total of 12,527 soil samples were used to calibrate the DSM model, using airborne gamma radiation data, climate data, topographical data and soil texture class data. Among the samples included, 11,093 had no laboratory-analysed Cu concentrations, so their Cu concentrations were predicted using portable X-ray fluorescence (PXRF) measurements. Cross-validation of the PXRF model resulted in Nash-Sutcliffe model efficiency coefficient (E) of 0.66 and mean absolute error (MAE) of 3.3 mg kg(-1). Cross-validation of the DSM model showed somewhat lower performance (E = 0.57, MAE = 4.1 mg kg(-1)). Based on the lower bound of the prediction interval (5th percentile), 48% of agricultural soils in Sweden are most likely not at risk of Cu deficiency (>7 mg kg(-1)). The Cu map was also validated against concentrations in soil samples from five fields (25-47 ha in size; four samples per ha). The field means were predicted with a MAE of 1.0 mg kg(-1) and within-field variation was reproduced with a field-wise squared Pearson correlation coefficient (r(2)) of 0-0.36. The classification metric 'recall' showed that the map of soil Cu concentrations might not predict all possible areas at risk of being Cu deficient, as observational data indicates that about 22% of soils in the mapped area should have Cu concentrations below the risk limit. However, the metric 'precision' showed that when the soil map predicted a concentration at or below 7 mg kg(-1), it was generally correct. Increasing the limit resulted in the recall and precision increasing rapidly. The remaining 52% of agricultural soils at risk of being below the Cu concentration limit can be targeted by laboratory analysis or monitoring.
Prediction models for crude protein concentration (CP) in winter wheat (Triticum aestivum L.) based on multispectral reflectance data from field trials in 2019 and 2020 in southern Sweden were developed and evaluated for independent trial sites. Reflectance data were collected using an unpiloted aerial vehicle (UAV)-borne camera with nine spectral bands having similar specification to nine bands of Sentinel-2 satellite data. Models were tested for application on near-real time Sentinel-2 imagery, on the prospect that CP prediction models can be made available in satellite-based decision support systems (DSS) for precision agriculture. Two different prediction methods were tested: linear regression and multivariate adaptive regression splines (MARS). Linear regression based on the best-performing vegetation index (the chlorophyll index) was found to be approximately as accurate as the best performing MARS model with multiple predictor variables in leave-one-trial-out cross-validation (R-2 = 0.71, R-2 = 0.70 and mean absolute error 0.64%, 0.60% CP respectively). Models applied on satellite data explained to a small degree between-field variations in CP (R-2 = 0.36), however did not reproduce within-field variation accurately. The results of the different methods presented here show the differences between methods used and their potential for application in a DSS.
Precision agriculture (PA) has a huge potential for growth in sub-Saharan Africa (SSA), but it faces a number of social-economic and technological challenges. This study sought to map existing PA research and application in SSA countries following the methodology for systematic mapping in environmental sciences. After screening for relevance, the initial about 7715 articles was reduced to 128. Results show that most of the studies were conducted in countries with socio-economic and technological advancement, mainly South Africa followed by Nigeria and Kenya. The studies were conducted at various scales ranging from field to country level with field scale studies being the most common. Most studies were conducted in relatively small farms typical of most farmlands in SSA. Studies done in relatively large farms are fewer, and such farms would likely belong to a few organisations and individuals with high economic capacity. Many of these studies have been conducted by researchers from outside SSA and a combination of researchers from within and outside SSA. However, based on authorship of the articles, it appears that most of the studies conducted in SSA on precision agriculture have either involved or depended on non-African researchers. It is concluded that there have been significant strides towards use of precision agriculture in SSA. However, with about 21 countries having no research done, there exists greater potential for precision agriculture in the region. Besides, there is need for more research to investigate the low usage of precision agriculture for livestock management.
Total nitrogen (N) content in aboveground biomass (N-uptake) in winter wheat ( Triticum aestivum L . ) as measured in a national monitoring programme was scaled up to full spatial coverage using Sentinel-2 satellite data and implemented in a decision support system (DSS) for precision agriculture. Weekly field measurements of N-uptake had been carried out using a proximal canopy reflectance sensor (handheld Yara N-Sensor) during 2017 and 2018. Sentinel-2 satellite data from two processing levels (top-of-atmosphere reflectance, L1C, and bottom-of-atmosphere reflectance, L2A) were extracted and related to the proximal sensor data (n = 251). The utility of five vegetation indices for estimation of N-uptake was compared. A linear model based on the red-edge chlorophyll index (CI) provided the best N-uptake prediction (L1C data: r 2 = 0.74, mean absolute error; MAE = 14 kg ha −1 ) when models were applied on independent sites and dates. Use of L2A data, rather than L1C, did not improve the prediction models. The CI-based prediction model was applied on all fields in an area with intensive winter wheat production. Statistics on N-uptake at the end of the stem elongation growth stage were calculated for 4169 winter wheat fields > 5 ha. Within-field variation in predicted N-uptake was > 30 kg N ha −1 in 62% of these fields. Predicted N-uptake was compared against N-uptake maps derived from tractor-borne Yara N-Sensor measurements in 13 fields (1.7–30 ha in size). The model based on satellite data generated similar information as the tractor-borne sensing data (r 2 = 0.81; MAE = 7 kg ha −1 ), and can therefore be valuable in a DSS for variable-rate N application.
Opportunities exist for adoption of precision agriculture technologies in all parts of the world. The form of precision agriculture may vary from region to region depending on technologies available, knowledge levels and mindsets. The current review examined research articles in the English language on precision agriculture practices for increased productivity among smallholder farmers in Sub-Saharan Africa. A total of 7715 articles were retrieved and after screening 128 were reviewed. The results indicate that a number of precision agriculture technologies have been tested under SSA conditions and show promising results. The most promising precision agriculture technologies identified were the use of soil and plant sensors for nutrient and water management, as well as use of satellite imagery, GIS and crop-soil simulation models for site-specific management. These technologies have been shown to be crucial in attainment of appropriate management strategies in terms of efficiency and effectiveness of resource use in SSA. These technologies are important in supporting sustainable agricultural development. Most of these technologies are, however, at the experimental stage, with only South Africa having applied them mainly in large-scale commercial farms. It is concluded that increased precision in input and management practices among SSA smallholder farmers can significantly improve productivity even without extra use of inputs.
We performed a systematic mapping of validation methods used in digital soil mapping (DSM), in order to gain an overview of current practices and make recommendations for future publications on DSM studies. A systematic search and screening procedure, largely following the RepOrting standards for Systematic Evidence Syntheses (ROSES) protocol, was carried out. It yielded a database of 188 peer‐reviewed DSM studies from the past two decades, all written in English and all presenting a raster map of a continuous soil property. Review of the full‐texts showed that most publications (97%) included some type of map validation, while just over one‐third (35%) estimated map uncertainty. Most commonly, a combination of multiple (existing) soil sampe datasets was used and the resulting maps were validated by single data‐splitting or cross‐validation. It was common for essential information to be lacking in method descriptions. This is unfortunate, as lack of information on sampling design (missing in 25% of 188 studies) and sample support (missing in 45% of 188 studies) makes it difficult to interpret what derived validation metrics represent, compromising their usefulness. Therefore, we present a list of method details that should be provided in DSM studies. We also provide a detailed summary of the 28 validation metrics used in published DSM studies, how to interpret the values obtained and whether the metrics can be compared between datasets or soil attributes.
 Kristin Piikki合作论文数38
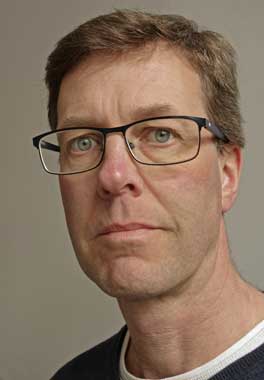 Bo Stenberg合作论文数Department of Soil and Environment, Swedish University of Agricultural Sciences18
 Johanna Wetterlind合作论文数Department of Soil and Environment, Swedish University of Agricultural Sciences15
 Knud Nissen合作论文数13Jan Eriksson合作论文数13
 Thomas Borjesson合作论文数11P. Stenborg合作论文数Univ Gothenburg10Stenberg Maria合作论文数9henrik stadig合作论文数7Christopher Sevara合作论文数6
 Rolf Sommer合作论文数Alliance Biovers Int & Int Ctr Trop Agr CI, ICIPE6
 Olle Hagner合作论文数6Jonas Tornberg合作论文数6Johan Ling合作论文数6Liane Thuvander合作论文数6S. Wolters合作论文数5
 Karl Adler合作论文数5anders larsolle合作论文数4
 Sylvia S. Nyawira合作论文数4
 Wuletawu Abera合作论文数Alliance Biovers Int & Int Ctr Trop Agr CIAT4
 Christian Isendahl合作论文数4Carl-Göran Pettersson合作论文数4
 Lulseged Tamene Desta合作论文数International Center for Tropical Agriculture;Consultative Group on International Agricultural Research4lars wijkmark合作论文数3Omran Alshihabi合作论文数3lina nolin合作论文数3niklas loren合作论文数3
 Dp Schaan合作论文数Federal University of Pará3
 Nicholas Jarvis合作论文数Department of Soil and Environment, Sveriges lantbruksuniversitet3
 David Parsons合作论文数3Mayesse Aparecida Da Silva合作论文数3
 Julien Morel合作论文数LPSC Grenoble3
 Sara Hallin合作论文数Department of Forest Mycology and Plant Pathology, Swedish University of Agricultural Sciences3Anna Rydberg合作论文数3c g pettersson合作论文数2
 Ronald Koomans合作论文数2J. Limburg合作论文数2carlanders helander合作论文数2
 Steven van der Veeke合作论文数2
 Bezaye Tessema合作论文数2
 Assefa Abegaz合作论文数2
 Justine M. Nyaga合作论文数Department of Biological Sciences, University of Embu2
 Lilian Rebellato合作论文数Department of Anthropology and Archaeology, Universidade Federal do Oeste do Pará2Mats Olvmo合作论文数2
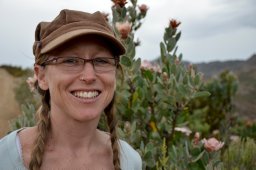 Winowiecki Leigh合作论文数World Agroforestry Centre (ICRAF), Nairobi, Kenya2
 Suzana Romeiro Araujo合作论文数Department of Soil Science, University of São Paulo2
 Anders T.A. Jonsson合作论文数2
 E.R. (Emiel) Van Der Graaf合作论文数Department of Radiation Oncology, University Medical Center Groningen University of Groningen;Faculty of Medical Sciences, University of Groningen2




