The increasing online availability of biodiversity data and advances in ecological modeling have led to a proliferation of open-source modeling tools. In particular, R packages for species distribution modeling continue to multiply without guidance on how they can be employed together, resulting in high fidelity of researchers to one or several packages. Here, we assess the wide variety of software for species distribution models (SDMs) and highlight how packages can work together to diversify and expand analyses in each step of a modeling workflow. We also introduce the new R package 'sdmverse' to catalog metadata for packages, cluster them based on their methodological functions, and visualize their relationships. To demonstrate how pluralism of software use helps improve SDM workflows, we provide three extensive and fully documented analyses that utilize tools for modeling and visualization from multiple packages, then score these tutorials according to recent methodological standards. We end by identifying gaps in the capabilities of current tools and highlighting outstanding challenges in the development of software for SDMs.
Creating software tools that address the needs of a wide range of decision-makers requires the inclusion of differing perspectives throughout the development process. Software tools for biodiversity conservation often fall short in this regard, partly because broad decision-maker needs may exceed the toolkits of single research groups or even institutions. We show that participatory, collaborative codesign enhances the utility of software tools for better decision-making in biodiversity conservation planning, as demonstrated by our experiences developing a set of integrated tools in Colombia. Specifically, we undertook an interdisciplinary, multi-institutional collaboration of ecological modelers, software engineers, and a diverse profile of potential end users, including decision-makers, conservation practitioners, and biodiversity experts. We leveraged and modified common paradigms of software production, including codesign and agile development, to facilitate collaboration through all stages (including conceptualization, development, testing, and feedback) to ensure the accessibility and applicability of the new tools to inform decision-making for biodiversity conservation planning.
Esta es una actualización de “Species’ Distribution Modeling for Conservation Educators and Practitioners” (Pearson 2008). Esta actualización es una versión condensada del original, con referencias actualizadas y una introducción y un marco simplificados para reflejar los desarrollos recientes en el campo y, especialmente, para brindar mayor énfasis en los enfoques de aprendizaje automático para el modelado de distribución de especies.
Conservation planning and decision-making rely on evaluations of biodiversity status and threats that are based upon species' distribution estimates. However, gaps exist regarding automated tools to delineate species' current ranges from distribution estimates and use those estimates to calculate both species- and community-level biodiversity metrics. Here, we introduce changeRangeR, an R package that facilitates workflows to reproducibly transform estimates of species' distributions into metrics relevant for conservation. For example, by combining predictions from species distribution models (SDMs) with other maps of environmental data (e.g., suitable forest cover), researchers can characterize the proportion of a species' range that is under protection, metrics used under the IUCN Criteria A and B guidelines (Area of Occupancy and Extent of Occurrence), and other more general metrics such as taxonomic and phylogenetic diversity and endemism. Further, changeRangeR facilitates temporal comparisons among biodiversity metrics to inform efforts toward complementarity and consideration of future scenarios in conservation decisions. changeRangeR also provides tools to determine the effects of modeling decisions through sensitivity tests. Transparent and repeatable workflows for calculating biodiversity change metrics from SDMs such as those provided by changeRangeR are essential to inform conservation decision-making efforts and represent key extensions for SDM methodology and associated metadata documentation.
Released 4 years ago, the Wallace EcoMod application (R package wallace) provided an open-source and interactive platform for modeling species niches and distributions that served as a reproducible toolbox and educational resource. wallace harnesses R package tools documented in the literature and makes them available via a graphical user interface that runs analyses and returns code to document and reproduce them. Since its release, feedback from users and partners helped identify key areas for advancement, leading to the development of wallace 2. Following the vision of growth by community expansion, the core development team engaged with collaborators and undertook a major restructuring of the application to enable: simplified addition of custom modules to expand methodological options, analyses for multiple species in the same session, improved metadata features, new database connections, and saving/loading sessions. wallace 2 features nine new modules and added functionalities that facilitate data acquisition from climate-simulation, botanical and paleontological databases; custom data inputs; model metadata tracking; and citations for R packages used (to promote documentation and give credit to developers). Three of these modules compose a new component for environmental space analyses (e.g., niche overlap). This expansion was paired with outreach to the biogeography and biodiversity communities, including international presentations and workshops that take advantage of the software's extensive guidance text. Additionally, the advances extend accessibility with a cloud-computing implementation and include a suite of comprehensive unit tests. The features in wallace 2 greatly improve its expandability, breadth of analyses, and reproducibility options, including the use of emerging metadata standards. The new architecture serves as an example for other modular software, especially those developed using the rapidly proliferating R package shiny, by showcasing straightforward module ingestion and unit testing. Importantly, wallace 2 sets the stage for future expansions, including those enabling biodiversity estimation and threat assessments for conservation.
Models that predict distributions of species by combining known occurrence records with digital layers of environmental variables have much potential for application in conservation. Through using this module, teachers will enable students to develop species distribution models, to apply the models across a series of analyses, and to interpret predictions accurately. In addition to its original components, this module features an updated and condensed synthesis document ("A Brief Introduction to Species Distribution Modeling for Conservation Educators and Practitioners," which provides theoretical and practical guidance for the expanding field of species distribution modeling. The synthesis is supplemented by a new exercise where learners create and optimize species distribution models using Wallace, an R-based GUI (Graphical User Interface) application for ecological modeling that currently focuses on building, evaluating, and visualizing models of species niches and distributions. Additionally, there are four new PowerPoint presentations on species distribution models (the history and theory, data and algorithms, and evaluating SDMs), as well as a presentation on how to use Wallace. The original Synthesis, "Species' Distribution Modeling for Conservation Educators and Practitioners," introduces learners to the modeling approach, outlines key concepts and terminology, and describes questions that may be addressed using the approach. A theoretical framework that is fundamental to ensuring that students understand the uses and limitations of the models is then described. Additionally, it details the main steps in building and testing a distribution model, and describes three case studies that illustrate applications of the models. This module is targeted at a level suitable for teaching graduate students and conservation professionals.
The field of distributional ecology has seen considerable recent attention, particularly surrounding the theory, protocols, and tools for Ecological Niche Modeling (ENM) or Species Distribution Modeling (SDM). Such analyses have grown steadily over the past two decades—including a maturation of relevant theory and key concepts—but methodological consensus has yet to be reached. In response, and following an online course taught in Spanish in 2018, we designed a comprehensive English-language course covering much of the underlying theory and methods currently applied in this broad field. Here, we summarize that course, ENM2020, and provide links by which resources produced for it can be accessed into the future. ENM2020 lasted 43 weeks, with presentations from 52 instructors, who engaged with >2500 participants globally through >14,000 hours of viewing and >90,000 views of instructional video and question-and-answer sessions. Each major topic was introduced by an “Overview” talk, followed by more detailed lectures on subtopics. The hierarchical and modular format of the course permits updates, corrections, or alternative viewpoints, and generally facilitates revision and reuse, including the use of only the Overview lectures for introductory courses. All course materials are free and openly accessible (CC-BY license) to ensure these resources remain available to all interested in distributional ecology.
Estimates of species’ ranges can inform many aspects of biodiversity research and conservation-management decisions. Many practical applications need high-precision range estimates that are sufficiently reliable to use as input data in downstream applications. One solution has involved expert-generated maps that reflect on-the-ground field information and implicitly capture various processes that may limit a species’ geographic distribution. However, expert maps are often subjective and rarely reproducible. In contrast, species distribution models (SDMs) typically have finer resolution and are reproducible because of explicit links to data. Yet, SDMs can have higher uncertainty when data are sparse, which is an issue for most species. Also, SDMs often capture only a subset of the factors that determine species distributions (e.g., climate) and hence can require significant post-processing to better estimate species’ current realized distributions. Here, we demonstrate how expert knowledge, diverse data types, and SDMs can be used together in a transparent and reproducible modeling workflow. Specifically, we show how expert knowledge regarding species’ habitat use, elevation, biotic interactions, and environmental tolerances can be used to make and refine range estimates using SDMs and various data sources, including high-resolution remotely sensed products. This range-refinement approach is primed to use various data sources, including many with continuously improving spatial or temporal resolution. To facilitate such analyses, we compile a comprehensive suite of tools in a new R package, maskRangeR, and provide worked examples. These tools can facilitate a wide variety of basic and applied research that requires high-resolution maps of species’ current ranges, including quantifications of biodiversity and its change over time.
There is a clear demand for quantitative literacy in the life sciences, necessitating competent instructors in higher education. However, not all instructors are versed in data science skills or research-based teaching practices. We surveyed biological and environmental science instructors (n = 106) about the teaching of data science in higher education, identifying instructor needs and illuminating barriers to instruction. Our results indicate that instructors use, teach, and view data management, analysis, and visualization as important data science skills. Coding, modeling, and reproducibility were less valued by the instructors, although this differed according to institution type and career stage. The greatest barriers were instructor and student background and space in the curriculum. The instructors were most interested in training on how to teach coding and data analysis. Our study provides an important window into how data science is taught in higher education biology programs and how we can best move forward to empower instructors across disciplines.
Aim With plant biodiversity under global threat, there is an urgent need to monitor the spatial distribution of multiple axes of biodiversity. Remote sensing is a critical tool in this endeavour. One remote sensing approach for detecting biodiversity is based on the hypothesis that the spectral diversity of plant communities is a surrogate of multiple dimensions of biodiversity. We investigated the generality of this 'surrogacy' for spectral, species, functional and phylogenetic diversity across 1,267 plots in the Greater Cape Floristic Region (GCFR), a hyper-diverse region comprising several biomes and two adjacent global biodiversity hotspots. Location The GCFR centred in south-western and western South Africa. Time period All data were collected between 1978-2014. Major taxa studied Vascular plants within the GCFR. Methods Spectral diversity was calculated using leaf reflectance spectra (450-950 nm) and was related to other dimensions of biodiversity via linear models. The accuracy of different spectral diversity metrics was compared using 10-fold cross-validation. Results We found that a distance-based spectral diversity metric was a robust predictor of species, functional and phylogenetic biodiversity. This result serves as a proof-of-concept that spectral diversity is a potential surrogate of biodiversity across a hyper-diverse biogeographic region. While our results support the generality of spectral diversity as a biodiversity surrogate, we also find that relationships vary between different geographic subregions and biomes, suggesting that differences in broad-scale community composition can affect these relationships. Main conclusions Spectral diversity was shown to be a robust surrogate of multiple dimensions of biodiversity across biomes and a widely varying biogeographic region. We also extend these surrogacy relationships to ecological redundancy to demonstrate the potential for additional insights into community structure based on spectral reflectance.
There is a clear and concrete need for greater quantitative literacy in the biological and environmental sciences. Data science training for students in higher education necessitates well-equipped and confident instructors across curricula. However, not all instructors are versed in data science skills or research-based teaching practices. Our study sought to survey the state of data science education across institutions of higher learning, identify instructor needs, and illuminate barriers to teaching data science in the classroom. We distributed a survey to instructors around the world, focused on the United States, and received 106 complete responses. Our results indicate that instructors across institutions use, teach, and view data management, analysis, and visualization as important for students to learn. Code, modeling, and reproducibility were less valued by instructors, although there were differences by institution type (doctoral, masters, or baccalaureate), and career stage (time since terminal degree). While there were a variety of barriers highlighted by respondents, instructor background, student background, and space in the curriculum were the greatest barriers of note. Interestingly, instructors were most interested in receiving training for how to teach code and data analysis in the undergraduate classroom. Our study provides an important window into how data science is taught in higher education as well as suggestions for how we can best move forward with empowering instructors across disciplines.
Analysis of herbaria records allows for an examination of patterns of spatial spread of nonnative plants in novel ranges, aiding in understanding the processes that govern nonnative species invasions. I used herbaria records to investigate the rate of spread and pattern of establishment for the invasive plant Frangula alnus (Rhamnaceae) in northeastern and central North America. I collected records spanning a temporal range from ca. 1880 to the present and a spatial range covering the entire invaded area in northeast North America. To address unequal sampling effort in specimen collection, I compared temporal and spatial patterns of F. alnus accessions with patterns in a group of ecologically similar native species. Frangula alnus likely had multiple initial introductions into North America that were geographically separated, ranging from southern Ontario to the coastal Mid-Atlantic region. Trends in record collection in time and space show that the rate of spread of F alnus was initially slow, then increased rapidly during the early 20th century, and reached a relatively constant rate of spread in the later 20th century. Examining the spread of this species at the continental scale, it appears to have experienced an extended lag phase early in its invasion history, but has steadily increased in area of occupancy since ca. 1920. This counters previous reports suggesting a lag lasting to ca. 1970. These results raise the question of whether extended lag phases may be a spatial-scale-specific pattern. The analytical methods presented here provide one way to investigate this question further.
The presence of human activity and development affects the distribution and behavior of carnivore species in various ways. It is necessary to examine the effects of urbanization and associated habitat fragmentation on the spatial ecology of predators, in order to develop a comprehensive understanding and formulate a proactive approach towards biodiversity protection in such areas. In this study, we observed patterns of occurrence and activity of carnivores in four preserves in metropolitan the New York and New Jersey region. Over the course of a ten-month trail camera study, 104 randomly positioned camera stations (5642 trap nights) yielded 793 total captures of 7 species: black bear (Ursus americanus), bobcat (Lynx rufus), coyote (Canis latrans), opossum (Didelphis virginiana), raccoon (Procyon lotor), red fox (Vulpes vulpes), and striped skunk (Mephitis mephitis). We found correlations between captures and level of human development, preserve size, and time of day of capture. Further, we found that the relative abundance of carnivores was higher in preserves with a higher level of surrounding development, suggesting the use of these habitat fragments as refuges. Coyotes and raccoons were more likely to be observed in areas with higher development. All carnivores combined were more likely to be observed at night in areas wither higher development, indicating a temporal response of carnivores to human activity. Our results emphasize the value of preserving intact habitat fragments in urban and suburban areas, and strongly suggest that carnivore use of parkland and greenspace should be monitored continuously to measure impacts on these species as conversion of surrounding land persists.
Ecological models often strive to inform conservation and management decisions. Occurrence-based distribution models may aid regional management strategies, though many management decisions require information beyond the likely presence of a species provided by such models. Process-based distribution models predict geographic distributions using environmental relationships with biological processes, providing more detailed predictions and a key opportunity for data-driven management. Here, we develop and characterize a novel demography-based regional distribution model and illustrate its use by comparing four management strategies for glossy buckthorn (Frangula alnus), a bird-dispersed shrub invasive throughout the northeastern United States. On a gridded landscape in southern New Hampshire and Maine, this population-level simulation includes fruiting, seed dispersal, seed bank dynamics, germination and establishment, and annual survival, with land cover as the dominant environmental driver. We parameterize the model with field and lab studies, supplementing with published data, expert knowledge, and pattern-oriented parameterization with historical records. In a comprehensive sensitivity analysis, we found that the age at which individuals are capable of reproduction and the frequency of long distance dispersal had the strongest influence on the distribution. In our management simulations, we found that immigration prevents total eradication within any property regardless of management frequency or coordination, though management impacts are detectable in nearby un-managed cells via reduced seed deposition. The flexible model structure combines multiple disparate data sources similar to those available for many species into a synthetic framework of local and regional biological processes, allows the incorporation of specific management actions targeting particular processes and life stages into the regional context of a process-based species distribution model, and provides a robust method for evaluating potential management strategies.
Aim Species with broader environmental tolerances are expected to be more widely distributed than specialist species, implying a positive correlation between niche breadth and geographic range size. When this relationship is evaluated using data derived from broad-scale geographic distributions of species, spatial autocorrelation of species distribution data and environments may inflate niche breadth-range size relationships, bringing into question the causal relationship between environmental tolerance and range size. Using null models, we quantify the contribution of spatial autocorrelation to the frequently reported relationship between species' range size and niche breadth. Location Time period South Africa. Current. Major taxa studied Methods Eighty species in the genus Pelargonium. Using phylogenetic least squares regression, we examined the extent to which variation in range size of Pelargonium species is related to temperature and precipitation niche breadths. We developed null models that randomized the spatial distribution of the climatic variables, but retained their broad spatial autocorrelation structure. We tested whether observed niche breadth-range size relationships were stronger than expected, given spatial autocorrelation of climatic variables. Results Main conclusion We found the expected positive relationships between measures of niche breadth and range size, but these were no stronger than expected based on our spatial null models. Including spatial structure in simulations reduced expected niche breadths compared to simulations based on fully randomized environmental variables, resulting in steeper slopes for the simulated niche breadth-range size relationships. Our results indicate that spatial autocorrelation may positively bias niche breadth-range size relationships. This bias suggests that previously reported relationships between range size and niche breadth based on broad-scale distributional data may be, at least in part, artefactual. Future studies need to explicitly account for spatial autocorrelation, and inferences on the role of environmental tolerance in driving patterns of species range size variation should be derived in conjunction with laboratory and field-based experiments.
Multiple stressors negatively impact species and ecosystems throughout any given watershed. Understanding these impacts helps resource managers develop and implement plans that protect species, communities, and habitats. For reptiles and amphibians in particular, road mortality can decrease a population’s viability. This is especially true in the lower Hudson River watershed of New York, where human population density and development are high. Road culverts, installed to divert water and reduce flooding, may provide habitat connections that reduce road mortality. We developed integrated demographic and distribution models for sixteen species of amphibians and reptiles, and performed extensive model sensitivity analyses, to prioritize culvert management for the sake of increasing habitat connectivity. We found that locations where culverts are currently sited could play an important role in increasing habitat connectivity, and thus decreasing the threats to local population persistence. However, not all culverts locations are the same, and many locations may not be considered “ideal habitat connectors” a priori. Thus, our findings could have a substantial effect on management planning. However, our results are highly dependent on the actual utilization of culverts as habitat connectors by these species, which must be further investigated.
 Cory Merow合作论文数Department of Ecology & Evolutionary Biology, College of Liberal Arts and Sciences, University of Connecticut14
 Jamie M Kass合作论文数San Francisco Estuary Institute12
 Robert P. Anderson合作论文数Department of Biology, The Division of Science, The City College of New York;American Museum of Natural History10
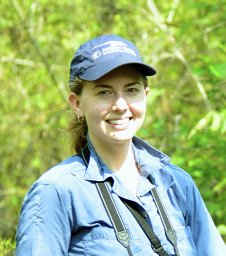 Blair Mary E合作论文数Department of Ecology, Evolution and Environmental Biology, Columbia University9
 H. Resit Akçakaya合作论文数Department of Ecology and Evolution, College of Arts and Sciences, Stony Brook University9
 John A. Silander合作论文数Department of Ecology and Evolutionary Biology, University of Connecticut8
 Bethany A. Johnson合作论文数7
 David Borsook合作论文数Center for Pain and the Brain, Boston Children's Hospital;Harvard Medical School7
 Andrea Paz合作论文数7
 Eric A. Moulton合作论文数Pain/Analgesia Imaging Neuroscience (P.A.I.N.) Group, Brain Imaging Center, McLean Hospital, Harvard Medical School, Belmont, MA, 02478-1064, USA.6Peter J. Galante合作论文数5
 Gonzalo E. Pinilla-Buitrago合作论文数Biol Dept, City Univ New York5Gautam Pendse合作论文数5
 Matteo Convertino合作论文数Hokkaido University5Hayley Kilroy Mollmann合作论文数4lino becerra合作论文数4
 Beth E. Gerstner合作论文数City College of New York, City University of New York4
 Gregory A. Kiker合作论文数Dept. Agricultural & Biological Engineering, University of Florida4Susie Morris合作论文数4Jasper A. Slingsby合作论文数Fynbos Node, South African Environm Observat Network4
 Rafael Muñoz-Carpena合作论文数Department of Agricultural and Biological Engineering, University of Florida;Institute of Food and Agricultural Sciences, University of Florida4
 Igor Linkov合作论文数US Army Corps of Engineers4
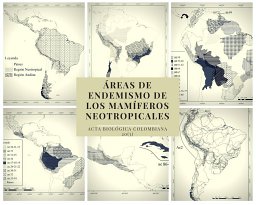 Elkin A. Noguera-Urbano合作论文数Inst Invest Recursos Biol Alexander Von Humboldt3
 Hannah Lois Owens合作论文数Integrated Program in Neuroscience, McGill University3
 Robert Muscarella合作论文数3
 Barry Brook合作论文数School of Biological Sciences, University of Tasmania3
 Ryu Hae Yeong合作论文数3
 Damien A. Fordham合作论文数School of Earth and Environmental Sciences, University of Adelaide Research Institute for Climate Change and Sustainability3
 Richard A. Fischer合作论文数CEERD-EE-E, US Army Engineer Research and Development Center3Cynthia S. Jones合作论文数Department of Ecology;University of Connecticut;Department of Ecology, University of Connecticut3Peter J. Ersts合作论文数3
 Richard Pearson合作论文数Centre for Biodiversity and Environment Research, Department of Genetics, Evolution and Environment, University College London;Division of Biosciences, University College London3Timothy E. Moore合作论文数2Adam M. Wilson合作论文数2M. L. Chu-Agor合作论文数2Sarah I. I. Meenan合作论文数2Kelly L O'Donnell合作论文数2
 Douglas Euston-Brown合作论文数2Caitlin J. Karanewsky合作论文数2
 Olivier Broennimann合作论文数2Valentina Grisales-Betancur合作论文数2
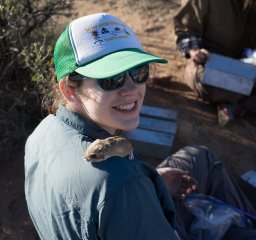 Ellen K Bledsoe合作论文数School of Natural Resources and the Environment, University of Arizona2
 Ian Ondo合作论文数2M Caitlin Fisher-Reid合作论文数2Erika Crispo合作论文数2
 Abigail Cahill合作论文数2
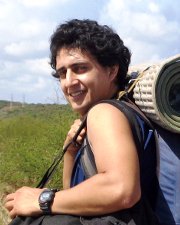 Marlon E. Cobos合作论文数Biodiversity Institute, University of Kansas2
 Jorge Ivan Velasquez-Tibata合作论文数Natl Audubon Soc2
 Andrea Sánchez-Tapia合作论文数Instituto de Pesquisas Jardim Botânico do Rio de Janeiro2




