Background:Metabolic dysfunction-associated steatotic liver disease affects 1 in 3 people worldwide. Ultrasound shear wave elastography (SWE) in obese patients, the target population for testing, is hampered by beam attenuation, leading to unreliable liver fibrosis quantification. Purpose:We assess the safety and efficacy of increased push mechanical index (IPMI) above U.S. Food and Drug Administration limits to improve SWE. Materials and methods:This single-center prospective trial (July 2023-April 2024) (NCT05792423) enrolled healthy adults stratified by body mass index (BMI). Participants underwent conventional push pulse (mechanical index [MI] 1.4) and IPMI (MI 2.5) SWE (GE Healthcare LOGIQ E10) performed by 1 of 3 sonographers and serial liver function testing (LFT) before and up to 7 days after imaging. Liver injury was defined as increased serum alanine transaminase (ALT), aspartate aminotransferase (AST), or alkaline phosphatase (ALP) (non-inferiority margins: AST 7.5 U/L, ALT 12 U/L, ALP 17.5 U/L). Secondary endpoints included SWE variability and measurement number. Results:Twenty-two analyzable participants (mean age 39.6 ± 16.3 years; 15 women) had normal BMI (6), overweight (6), class 1 obesity (7), and class 2 obesity (3). Conventional shear wave speed was 1.34 ± 0.21 m/s, and IPMI yielded 1.36 ± 0.20 m/s (velocities ≤ 1.34 m/s indicate minimal or no fibrosis). The mean [95% CI] LFT change from baseline to day 1 was 1) AST: -0.86 [-2.34, 0.61], P = .24, 2) ALT: 0.32 [-1.04, 1.68], P = .63, 3) ALP: 1.73 [-1.02, 4.47], P = .21. The upper 95% CI for all biomarkers met non-inferiority criteria. Mean IPMI interquartile range (IQR) to median ratio decreased 0.019 (29.2% relative reduction) (P = .01) with 0.68 [IQR: 0.0.75] (P = .058), fewer average attempts. Conclusion:IPMI SWE in healthy volunteers did not cause injury and reduced measurement variability. IPMI SWE should be developed to improve examination quality and reliability in obese patients.
Shear wave elastography (SWE) is a promising tool to quantify tissue stiffness variations with increasing applications in tissue characterization. In SWE, the tissue is excited by an acoustic radiation force pulse sequence induced by an ultrasound probe. The generated shear waves propagate laterally away from the push location. The shear wave speed (SWS) can be measured to estimate elasticity, which is a physical property that can be used to characterize the tissue. SWS estimation requires two steps: speckle tracking from radiofrequency (RF)/IQ data to obtain particle displacement or velocity, and SWS estimation from the estimated velocity, which aims to find the speed of wave propagating in the lateral direction. The SWS can be calculated by comparing the velocity-time profiles at two locations separated by a few millimeters. In the supervised deep learning methods of SWS estimation, simulation data generated by finite element analysis is employed to train the network. However, the computational cost and complexity of modeling the wave propagation contribute to the limited practicality of supervised methods. In this paper, we present an unsupervised physics-inspired learning method for SWS estimation using equations governing the wave propagation in a viscoelastic medium. The proposed method does not require any finite element simulated data, and training data is synthetically generated using forward modeling of the wave propagation equation. Furthermore, unlabeled experimental data is utilized to train/fine-tune the network. We validated the proposed method using experimental data imaged by different machines and data created by placing pork fat on top of a phantom. The findings validate that the suggested approach can demonstrate comparable (or superior) performance compared to the traditional cross-correlation method.
Acoustic beam shaping with high degrees of freedom is critical for applications such as ultrasound imaging, acoustic manipulation, and stimulation. However, the ability to fully control the acoustic pressure profile over its propagation path has not yet been achieved. Here, we demonstrate an acoustic diffraction–resistant adaptive profile technology (ADAPT) that can generate a propagation-invariant beam with an arbitrarily desired profile. By leveraging wave number modulation and beam multiplexing, we develop a general framework for creating a highly flexible acoustic beam with a linear array ultrasonic transducer. The designed acoustic beam can also maintain the beam profile in lossy material by compensating for attenuation. We show that shear wave elasticity imaging is an important modality that can benefit from ADAPT for evaluating tissue mechanical properties. Together, ADAPT overcomes the existing limitation of acoustic beam shaping and can be applied to various fields, such as medicine, biology, and material science.
Nonalcoholic fatty liver disease (NAFLD) is a common cause of morbidity and mortality. Nonfocal liver biopsy is the historical reference standard for evaluating NAFLD, but it is limited by invasiveness, high cost, and sampling error. Imaging methods are ideally situated to provide quantifiable results and rule out other anatomic diseases of the liver. MRI and US have shown great promise for the noninvasive evaluation of NAFLD. US is particularly well suited to address the population-level problem of NAFLD because it is lower-cost, more available, and more tolerable to a broader range of patients than MRI. Noninvasive US methods to evaluate liver fibrosis are widely available, and US-based tools to evaluate steatosis and inflammation are gaining traction. US techniques including shear-wave elastography, Doppler spectral imaging, attenuation coefficient, hepatorenal index, speed of sound, and backscatter-based estimation have regulatory clearance and are in clinical use. New methods based on channel and radiofrequency data analysis approaches have shown promise but are mostly experimental. This review discusses the advantages and limitations of clinically available and experimental approaches to sonographic liver tissue characterization for NAFLD diagnosis as well as future applications and strategies to overcome current limitations.
Excessive liver fat (steatosis) is now the most common cause of chronic liver disease worldwide and is an independent risk factor for cirrhosis and associated complications. Accurate and clinically useful diagnosis, risk stratification, prognostication, and therapy monitoring require accurate and reliable biomarker measurement at acceptable cost. This article describes a joint effort by the American Institute of Ultrasound in Medicine (AIUM) and the RSNA Quantitative Imaging Biomarkers Alliance (QIBA) to develop standards for clinical and technical validation of quantitative biomarkers for liver steatosis. The AIUM Liver Fat Quantification Task Force provides clinical guidance, while the RSNA QIBA Pulse-Echo Quantitative Ultrasound Biomarker Committee develops methods to measure biomarkers and reduce biomarker variability. In this article, the authors present the clinical need for quantitative imaging biomarkers of liver steatosis, review the current state of various imaging modalities, and describe the technical state of the art for three key liver steatosis pulse-echo quantitative US biomarkers: attenuation coefficient, backscatter coefficient, and speed of sound. Lastly, a perspective on current challenges and recommendations for clinical translation for each biomarker is offered.
ObjectivesTo quantify the bias of shear wave speed (SWS) measurements between different commercial ultrasonic shear elasticity systems and a magnetic resonance elastography (MRE) system in elastic and viscoelastic phantoms.MethodsTwo elastic phantoms, representing healthy through fibrotic liver, were measured with 5 different ultrasound platforms, and 3 viscoelastic phantoms, representing healthy through fibrotic liver tissue, were measured with 12 different ultrasound platforms. Measurements were performed with different systems at different sites, at 3 focal depths, and with different appraisers. The SWS bias across the systems was quantified as a function of the system, site, focal depth, and appraiser. A single MRE research system was also used to characterize these phantoms using discrete frequencies from 60 to 500 Hz.ResultsThe SWS from different systems had mean difference 95% confidence intervals of ±0.145 m/s (±9.6%) across both elastic phantoms and ± 0.340 m/s (±15.3%) across the viscoelastic phantoms. The focal depth and appraiser were less significant sources of SWS variability than the system and site. Magnetic resonance elastography best matched the ultrasonic SWS in the viscoelastic phantoms using a 140 Hz source but had a − 0.27 ± 0.027‐m/s (−12.2% ± 1.2%) bias when using the clinically implemented 60‐Hz vibration source.ConclusionsShear wave speed reconstruction across different manufacturer systems is more consistent in elastic than viscoelastic phantoms, with a mean difference bias of < ±10% in all cases. Magnetic resonance elastographic measurements in the elastic and viscoelastic phantoms best match the ultrasound systems with a 140‐Hz excitation but have a significant negative bias operating at 60 Hz. This study establishes a foundation for meaningful comparison of SWS measurements made with different platforms.
Two-dimensional shear-wave elastography presents 2-D quantitative shear elasticity maps of tissue, which are clinically useful for both focal lesion detection and diffuse disease diagnosis. Realization of 2-D shear-wave elastography on conventional ultrasound scanners, however, is challenging because of the low tracking pulse-repetition-frequency (PRF) of these systems. Although some clinical and research platforms support software beamforming and plane-wave imaging with high PRF, the majority of current clinical ultrasound systems do not have the software beamforming capability, which presents a critical challenge for translating the 2-D shear-wave elastography technique from laboratory to clinical scanners. To address this challenge, this paper presents a time-aligned sequential tracking (TAST) method for shear-wave tracking on conventional ultrasound scanners. TAST takes advantage of the parallel beamforming capability of conventional systems and realizes high-PRF shear-wave tracking by sequentially firing tracking vectors and aligning shear wave data in the temporal direction. The comb-push ultrasound shear elastography (CUSE) technique was used to simultaneously produce multiple shear wave sources within the field-of-view (FOV) to enhance shear wave SNR and facilitate robust reconstructions of 2-D elasticity maps. TAST and CUSE were realized on a conventional ultrasound scanner. A phantom study showed that the shear-wave speed measurements from the conventional ultrasound scanner were in good agreement with the values measured from other 2-D shear wave imaging technologies. An inclusion phantom study showed that the conventional ultrasound scanner had comparable performance to a state-of-the-art shear-wave imaging system in terms of bias and precision in measuring different sized inclusions. Finally, in vivo case analysis of a breast with a malignant mass, and a liver from a healthy subject demonstrated the feasibility of using the conventional ultrasound scanner for in vivo 2-D shear-wave elastography. These promising results indicate that the proposed technique can enable the implementation of 2-D shear-wave elastography on conventional ultrasound scanners and potentially facilitate wider clinical applications with shear-wave elastography.
Using ultrasonic shear wave speed (SWS) estimates has become popular to noninvasively evaluate liver fibrosis, but significant inter-system variability in liver SWS measurements can preclude meaningful comparison of measurements performed with different systems. The RSNA Quantitative Imaging Biomarker Alliance (QIBA) ultrasound SWS committee has been developing elastic and viscoelastic (VE) phantoms to evaluate system dependencies of SWS estimates. The objective of this study is to compare SWS measurements between commercially-available systems using phantoms that have viscoelastic properties similar to those observed in normal and fibrotic liver. CIRS, Inc. fabricated three phantoms using a proprietary oil-water emulsion infused in a Zerdine ® hydrogel that were matched in viscoelastic behavior to healthy and fibrotic human liver data. Phantoms were measured at academic, clinical, government and vendor sites using different systems with curvilinear arrays at multiple focal depths (3.0, 4.5 & 7.0 cm). The results of this study show that current-generation ultrasound SWS measurement systems are able to differentiate viscoelastic materials that span healthy to fibrotic liver. The deepest focal depth (7.0 cm) yielded the greatest inter-system variability for each phantom (maximum of 17.7%) as evaluated by IQR. Inter-system variability was consistent across all 3 phantoms and was not a function of stiffness. Median SWS estimates for the greatest outlier system for each phantom/focal depth combination ranged from 12.7–17.6%. Future efforts will include performing more robust statistical analyses of these data, comparing these phantom data trends with viscoelastic digital phantom data, providing vendors with study site data to refine their systems to have more consistent measurements, and integrating these data into the QIBA ultrasound shear wave speed measurement profile.
Commercially-available shear wave imaging systems measure group shear wave speed (SWS) and often report stiffness parameters applying purely elastic material models. Soft tissues, however, are viscoelastic, and higher-order material models are necessary to characterize the dispersion associated with broadband shear waves. In this paper, we describe a robust, model-based algorithm and use a linear dispersion model to perform shear wave dispersion analysis in traditionally difficult-to-image subjects. In a cohort of 135 non-alcoholic fatty liver disease patients, we compare the performance of group SWS with dispersion analysis-derived phase velocity c(200 Hz) and dispersion slope dc/df parameters to stage hepatic fibrosis and steatosis. Area under the ROC curve (AUROC) analysis demonstrates correlation between all parameters [group SWS, c(200 Hz), and, to a lesser extent dc/df ] and fibrosis stage, whereas no correlation was observed between steatosis stage and any of the material parameters. Interestingly, optimal AUROC threshold SWS values separating advanced liver fibrosis (≥F3) from mild-to-moderate fibrosis (≤F2) were shown to be frequency-dependent, and to increase from 1.8 to 3.3 m/s over the 0 to 400 Hz shear wave frequency range.
Two-dimensional (2D) shear wave elastography has emerged as a popular clinical and research tool for a variety of applications. Implementing 2D shear wave elastography on a conventional ultrasound scanner, however, is a challenging task due to the low imaging frame rate, which is essentially limited by the low parallel beamforming capability provided by the hardware beamformers on these scanners. This study developed a time aligned sequential tracking (TAST) technique that enables high pulse repetition frequency (PRF) shear wave tracking on conventional ultrasound scanners. The Comb-push Ultrasound Shear Elastography (CUSE) technique was combined with TAST to realize large field-of-view (FOV) 2D shear wave elastography. CUSE and TAST were implemented on the General Electric LOGIQ E9 (LE9) scanner. Phantom experiments showed that the LE9 could reconstruct large FOV, high quality 2D shear wave speed maps with accurate shear wave speed measurements that are in good agreement to other 2D shear wave imaging techniques. An inclusion phantom study showed that LE9 had comparable performance to the Aixplorer (Supersonic Imagine) in terms of bias and precision in measuring different sized inclusions. Finally, in vivo case studies of a breast with a malignant mass, and a liver from a healthy subject demonstrated the feasibility of using LE9 for in vivo 2D shear wave elastography.
Elastic properties of materials can be measured by observing shear wave propagation following localized, impulsive excitations and relating the propagation velocity to a model of the material. However, characterization of anisotropic materials is difficult because of the number of elasticity constants in the material model and the complex dependence of propagation velocity relative to the excitation axis, material symmetries, and propagation directions. In this study, we develop a model of wave propagation following impulsive excitation in an incompressible, transversely isotropic (TI) material such as muscle. Wave motion is described in terms of three propagation modes identified by their polarization relative to the material symmetry axis and propagation direction. Phase velocities for these propagation modes are expressed in terms of five elasticity constants needed to describe a general TI material, and also in terms of three constants after the application of two constraints that hold in the limit of an incompressible material. Group propagation velocities are derived from the phase velocities to describe the propagation of wave packets away from the excitation region following localized excitation. The theoretical model is compared to the results of finite element (FE) simulations performed using a nearly incompressible material model with the five elasticity constants chosen to preserve the essential properties of the material in the incompressible limit. Propagation velocities calculated from the FE displacement data show complex structure that agrees quantitatively with the theoretical model and demonstrates the possibility of measuring all three elasticity constants needed to characterize an incompressible, TI material.
A 2-D matrix ultrasound array is used to monitor acoustic radiation force impulse (ARFI) induced shear wave propagation in 3-D in excised canine muscle. From a single acquisition, both the shear wave phase and group velocity can be calculated to estimate the shear wave speed (SWS) along and across the fibers, as well as the fiber orientation in 3-D. The true fiber orientation found using the 3-D radon transform on B-mode volumes of the muscle was used to verify the fiber direction estimated from shear wave data. For the simplified imaging case when the ARFI push can be oriented perpendicular to the fibers, the error in estimating the fiber orientation using phase and group velocity measurements was 3.5 ± 2.6° and 3.4 ± 1.4° (mean ± standard deviation), respectively, over six acquisitions in different muscle samples. For the more general case when the push is oblique to the fibers, the angle between the push and the fibers is found using the dominant orientation of the shear wave displacement magnitude. In 30 acquisitions on six different muscle samples with oblique push angles up to 40°, the error in the estimated fiber orientation using phase and group velocity measurements was 5.4 ± 2.9° and 5.3 ± 3.2°, respectively, after estimating and accounting for the additional unknown push angle. Either the phase or group velocity measurements can be used to estimate fiber orientation and SWS along and across the fibers. Although it is possible to perform these measurements when the push is not perpendicular to the fibers, highly oblique push angles induce lower shear wave amplitudes which can cause inaccurate SWS measurements.
Elevated hepatic venous pressure is the primary source of complications in advancing liver disease. Ultrasound imaging is ideal for potential noninvasive hepatic pressure measurements as it is widely used for liver imaging. Specifically, ultrasound based stiffness measures may be useful for clinically monitoring pressure, but the mechanism by which liver stiffness increases with hepatic pressure has not been well characterized. This study is designed to elucidate the nonlinear properties of the liver during pressurization by measuring both hepatic shear wave speed (SWS) and strain with increasing pressure. Tissue deformation during hepatic pressurization was tracked in 8 canine livers using successively acquired 3-D B-mode volumes and compared with concurrently measured SWS. When portal venous pressure was increased from clinically normal (0–5 mmHg) to pressures representing highly diseased states at 20 mmHg, the liver was observed to expand with axial strain measures up to 10%. At the same time, SWS estimates were observed to increase from 1.5–2 m/s at 0–5 mmHg (baseline) to 3.25–3.5 m/s at 20 mmHg.
A system capable of tracking radiation-force-induced shear wave propagation in a 3-D volume using ultrasound is presented. In contrast to existing systems, which use 1-D array transducers, a 2-D matrix array is used for tracking shear wave displacements. A separate single-element transducer is used for radiation force excitation. This system allows shear wave propagation in all directions away from the push to be observed. It is shown that for a limit of 64 tracking beams, by placing the beams at the edges of the measurement region of interest (ROI) at multiple directions from the push, time-of-flight (TOF) shear wave speed (SWS) measurement uncertainty can theoretically be reduced by 40% compared with equally spacing the tracking beams within the ROI along a single plane, as is typical when using a 1-D array for tracking. This was verified by simulation, and a reduction of 30% was experimentally observed on a homogeneous phantom. Analytical expressions are presented for the relationship between TOF SWS measurement uncertainty and various shear wave imaging parameters. It is shown that TOF SWS uncertainty is inversely proportional to ROI size, and inversely proportional to the square root of the number of tracking locations for a given distribution of beam locations relative to the push. TOF SWS uncertainty is shown to increase with the square of the SWS, indicating that TOF SWS measurements are intrinsically less precise for stiffer materials.
Acoustic radiation force impulse (ARFI) based elasticity imaging methods have been under development for the past 15 years, and both qualitative on-axis (ARFI imaging) and quantitative shear wave speed (SWEI) methods have been introduced into the commercial market. On-axis methods employ less processing and provide higher spatial resolution, whereas SWEI methods employ reconstruction algorithms that afford higher contrast and provide quantitative estimates of the underlying material stiffness. Each approach can be optimized through custom beam sequences and processing algorithms for specific clinical applications. We discuss three specific applications herein: 1) hepatic fibrosis and steatosis staging through SWEI, 2) 3D SWEI for characterizing material anisotropy, and 3) 3D prostatic SWEI and ARFI imaging.
An interlaboratory study of shear wave speed (SWS) estimation was performed. Commercial shear wave elastography systems from Fibroscan, Philips, Siemens and Supersonic Imagine, as well as several custom laboratory systems, were involved. Fifteen sites were included in the study. CIRS manufactured and donated 11 pairs of custom phantoms designed for the purposes of this investigation. Dynamic mechanical tests of equivalent phantom materials were also performed. The results of this study demonstrate that there is very good agreement among SWS estimation systems, but there are several sources of bias and variance that can be addressed to improve consistency of measurement results.
Hepatic venous pressure is increased in advancing liver disease and is considered the primary source of of complications (such as variceal bleeding and ascites). Measurement of clinically significant increases in portal pressure is important for managing liver disease and is performed using the invasive method, hepatic venous pressure gradient (HVPG). We have previously reported that ARFI based shear wave speed (SWS) estimate increases with increasing hepatic venous pressure require an underlying tissue deformation. However, the mechanical behavior of the liver during pressurization is not well understood. In this work, tissue deformation during hepatic pressurization was tracked using successively acquired 3-D B-mode volumes and compared with concurrently accrued SWS datasets.
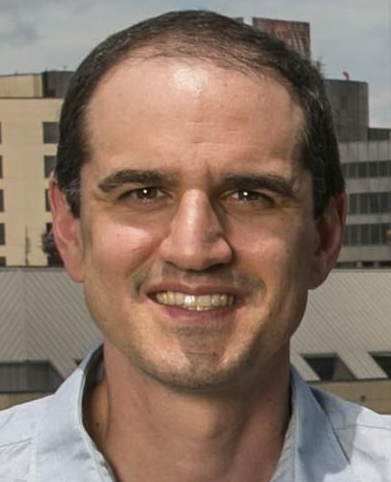 Mark L. Palmeri合作论文数Department of Biomedical Engineering, Pratt School of Engineering, Duke University;Department of Anesthesiology, School of Medicine, Duke University31
 Kathryn Radabaugh Nightingale合作论文数Department of Biomedical Engineering, Pratt School of Engineering, Duke University23
 Rouze Ned C合作论文数17
 Anthony E. Samir合作论文数Abdominal Imaging and Intervention Department, Massachusetts General Hospital8
 Veronica Rotemberg合作论文数Dermatology Service, Memorial Sloan Kettering Cancer Center7
 Brett Byram合作论文数Department of Biomedical Engineering, Duke University6
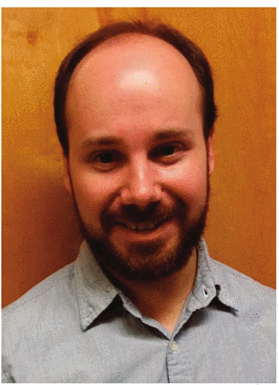 Rosenzweig, S.合作论文数6
 Pengfei Song合作论文数Department of Biomedical Engineering, Pratt School of Engineering, Duke University6
 Shigao Chen合作论文数Department of Physiology and Biomedical Engineering, Mayo Clinic;Department of Radiology, Mayo Clinic6
 Cynthia Dianne Guy合作论文数Clinical Science Departments, Duke University5
 Anna Mae Diehl合作论文数Basic Research Laboratory, Department of Medicine, Duke University School of Medicine;Duke Cancer Institute5
 Matthew W. Urban合作论文数Department of Physiology and Biomedical Engineering, Mayo Clinic College of Medicine5Kathy Nightingale合作论文数4
 Michael MacDonald合作论文数4
 Heng Zhao合作论文数Department of Physiology and Biomedical Engineering;Mayo Clinic;Rochester MN USA;Department of Physiology and Biomedical Engineering, Mayo Clinic4
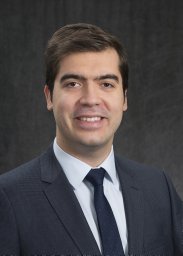 Arinc Ozturk合作论文数Massachusetts Gen Hosp, Dept Radiol, Ctr Ultrasound Res & Translat, Boston, MA USA4
 Manal F. Abdelmalek合作论文数Department of Medicine, School of Medicine, Duke University;Division of Gastroenterology and Hepatology, Department of Internal Medicine, Mayo Clinic4
 Keith Wear合作论文数Center for Devices and Radiological Health, U.S. Food and Drug Administration4
 Timothy J. Hall合作论文数Department of Medical Physics, School of Medicine and Public Health, University of Wisconsin–Madison;Department of Biomedical Engineering, University of Wisconsin–Madison4
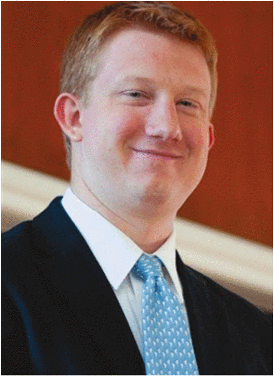 Russell H Behler合作论文数3Andy Milkowski合作论文数3
 Viksit Kumar合作论文数Dept. of Mech. Eng., Iowa State Univ.;c;Dept. of Mech. Eng., Iowa State Univ.3
 Lanning Justin合作论文数3Lynch Ted合作论文数3
 James F. Greenleaf合作论文数Mayo Clinic College of Medicine and Science;Basic Ultrasound Research Laboratory, Department of Physiology and Biomedical Engineering, Mayo Clinic3
 Armando Manduca合作论文数Department of Physiology and Biomedical Engineering, Mayo Clinic3
 Paul Carson合作论文数Basic Radiological Sciences Division, Department of Radiology, Michigan Medicine, University of Michigan3
 Azra Alizad合作论文数Department of Radiology, Mayo Clinic College of Medicine and Science3
 Matthew Callstrom合作论文数3Richard G. Barr合作论文数3Brian S Garra合作论文数3
 Vijay Shamdasani合作论文数Bothell and Department of Bioengineering, University of Washington3
 Gregg Trahey合作论文数Department of Biomedical Engineering, Pratt School of Engineering, Duke University3
 Jeremy Dahl合作论文数Department of Radiology, School of Medicine, Stanford University3Rimon Tadross合作论文数2Gilles Guenette合作论文数2Shana Fielding合作论文数2Yoko Okamura合作论文数2david napolitano合作论文数2
 Liu Yang合作论文数2
 Nancy a Obuchowski合作论文数2
 Ivan Rosado-Mendez合作论文数Department of Medical Physics, School of Medicine and Public Health, University of Wisconsin-Madison2
 Scott J. Schoen合作论文数George W. Woodruff School of Mechanical Engineering, Georgia Institute of Technology2albert gee合作论文数2Yuyang Gu合作论文数2
 Hua Xie合作论文数philips2yuling chen合作论文数2
 Hah Zaegyoo合作论文数2
 David Bradway合作论文数Duke Univ.;c;Duke Univ.2




