The mission of the SKA Observatory is to build and operate cutting-edge radio telescopes to transform our understanding of the Universe and deliver benefits to society. To fulfill this mission, the SKA radio telescopes have to deal with challenges never faced before. One of the most challenging aspects, especially for the SKA-Low radio telescope, working between 50 and 350 MHz is the calibration, done at different levels, of such a complex telescope in such a harsh environment. Prototyping of the front end, as well as of some of the backend components, is essential in order to evaluate the real behavior of the aperture array and develop and test calibration procedures and propose improvements to make sure that the requirements needed are achieved. This paper presents the latest SKA-Low Aperture Array Verification System version 3 and how this contributes to the risk mitigation and decision making for some fundamental aspects of the SKA-Low radio telescope.
The Square Kilometre Array Telescope working at Low Frequencies (SKA-Low, 50-350 MHz) is one of the two interferometric arrays under construction by the SKA Observatory aiming to "build and operate cutting-edge radio telescopes to transform our understanding of the Universe". The SKA-Low telescope architecture is quite complex and consists of 512 stations. These stations are arrays, each made up of 256 dual polarized log-periodic antennas. For this reason, such complex architecture has gone through a comprehensive set of investigations, design decisions and improvements which has led to the latest updates and considerations presented in this paper, as well as results from the latest phased array prototype.
The design and development process for the Square Kilometre Array (SKA) radio telescope, the Low Frequency Aperture Array component, was progressed during the SKA pre-construction phase by an international consortium, with the goal of meeting requirements for a critical design review. As part of the development process a full-sized prototype SKA Low station was deployed, the Aperture Array Verification System 1 (AAVS1). We provide a system overview and describe the commissioning results of AAVS1, which is a low frequency radio telescope with 256 dual-polarisation log-periodic dipole antennas working as a phased array. A detailed system description is provided, including an in-depth overview of relevant sub-systems, ranging from hardware, firmware, software, calibration,and control sub-systems. Early commissioning results cover initial bootstrapping, array calibration, stability testing, beam-forming,and on-sky sensitivity validation. Lessons learned are presented, along with future developments.
The sensitivity of a single station is a crucial performance characteristic of the low-frequency component of the Square Kilometre Array (SKA-Low). In this contribution, the sensitivity of a prototype station of the SKA-Low, the Aperture Array Verification System Version 2 (AAVS2), measured at frequencies 703, 110.2, 159.4, 229.7 and 3203 MHz is presented and compared with electromagnetic simulations. The measured sensitivity data are in good agreement with the predictions of electromagnetic simulations, confirming good understanding of the instrument and its accurate representation in the simulations.
Type III solar radio bursts are the Sun’s most intense and frequent nonthermal radio emissions. They involve two critical problems in astrophysics, plasma physics, and space physics: how collective processes produce nonthermal radiation and how magnetic reconnection occurs and changes magnetic energy into kinetic energy. Here magnetic reconnection events are identified definitively in Solar Dynamics Observatory UV-EUV data, with strong upward and downward pairs of jets, current sheets, and cusp-like geometries on top of time-varying magnetic loops, and strong outflows along pairs of open magnetic field lines. Type III bursts imaged by the Murchison Widefield Array and detected by the Learmonth radiospectrograph and STEREO B spacecraft are demonstrated to be in very good temporal and spatial coincidence with specific reconnection events and with bursts of X-rays detected by the RHESSI spacecraft. The reconnection sites are low, near heights of 5–10 Mm. These images and event timings provide the long-desired direct evidence that semi-relativistic electrons energized in magnetic reconnection regions produce type III radio bursts. Not all the observed reconnection events produce X-ray events or coronal or interplanetary type III bursts; thus different special conditions exist for electrons leaving reconnection regions to produce observable radio, EUV, UV, and X-ray bursts.
Low radio frequency solar observations using the Murchison Widefield Array have recently revealed the presence of numerous weak short-lived narrowband emission features, even during moderately quiet solar conditions. These nonthermal features occur at rates of many thousands per hour in the 30.72 MHz observing bandwidth, and hence necessarily require an automated approach for their detection and characterization. Here, we employ continuous wavelet transform using a mother Ricker wavelet for feature detection from the dynamic spectrum. We establish the efficacy of this approach and present the first statistically robust characterization of the properties of these features. In particular, we examine distributions of their peak flux densities, spectral spans, temporal spans, and peak frequencies. We can reliably detect features weaker than 1 SFU, making them, to the best of our knowledge, the weakest bursts reported in literature. The distribution of their peak flux densities follows a power law with an index of −2.23 in the 12–155 SFU range, implying that they can provide an energetically significant contribution to coronal and chromospheric heating. These features typically last for 1–2 s and possess bandwidths of about 4–5 MHz. Their occurrence rate remains fairly flat in the 140–210 MHz frequency range. At the time resolution of the data, they appear as stationary bursts, exhibiting no perceptible frequency drift. These features also appear to ride on a broadband background continuum, hinting at the likelihood of them being weak type-I bursts.
Context. Low-frequency radio arrays are opening a new window for the study of the sky, both to study new phenomena and to better characterize known source classes. Being flat-spectrum sources, blazars are so far poorly studied at low radio frequencies.Aims. We characterize the spectral properties of the blazar population at low radio frequency, compare the radio and high-energy properties of the gamma-ray blazar population, and search for radio counterparts of unidentified gamma-ray sources.Methods. We cross-correlated the 6100 deg(2) Murchison Widefield Array Commissioning Survey catalogue with the Roma blazar catalogue, the third catalogue of active galactic nuclei detected by Fermi-LAT, and the unidentified members of the entire third catalogue of gamma-ray sources detected by Fermi-LAT. When available, we also added high-frequency radio data from the Australia Telescope 20 GHz catalogue.Results. We find low-frequency counterparts for 186 out of 517 (36%) blazars, 79 out of 174 (45%) gamma-ray blazars, and 8 out of 73 (11%) gamma-ray blazar candidates. The mean low-frequency (120-180 MHz) blazar spectral index is = 0.57 +/- 0.02: blazar spectra are flatter than the rest of the population of low-frequency sources, but are steeper than at similar to GHz frequencies. Low-frequency radio flux density and gamma-ray energy flux display a mildly significant and broadly scattered correlation. Ten unidentified gamma-ray sources have a (probably fortuitous) positional match with low radio frequency sources.Conclusions. Low-frequency radio astronomy provides important information about sources with a flat radio spectrum and high energy. However, the relatively low sensitivity of the present surveys still misses a significant fraction of these objects. Upcoming deeper surveys, such as the GaLactic and Extragalactic All-Sky MWA (GLEAM) survey, will provide further insight into this population.
Detection of the Epoch of Reionization HI signal requires a precise understanding of the intervening galaxies and AGN, both for instrumental calibration and foreground removal. We present a catalogue of 7394 extragalactic sources at 182 MHz detected in the RA=0 field of the Murchison Widefield Array Epoch of Reionization observation programme. Motivated by unprecedented requirements for precision and reliability we develop new methods for source finding and selection. We apply machine learning methods to self-consistently classify the relative reliability of 9490 source candidates. A subset of 7466 are selected based on reliability class and signal-to-noise ratio criteria. These are statistically cross-matched to four other radio surveys using both position and flux density information. We find 7369 sources to have confident matches, including 90 partially resolved sources that split into a total of 192 sub-components. An additional 25 unmatched sources are included as new radio detections. The catalogue sources have a median spectral index of -0.85. Spectral flattening is seen toward lower frequencies with a median of -0.71 predicted at 182 MHz. The astrometric error is 7 arcsec. compared to a 2.3 arcmin. beam FWHM. The resulting catalogue covers approximately 1400 sq. deg. and is complete to approximately 80 mJy within half beam power. This provides the most reliable discrete source sky model available to date in the MWA EoR0 field for precision foreground subtraction.
We present deep polarimetric observations at 154 MHz with the Murchison Widefield Array (MWA), covering 625 deg^2 centered on RA=0 h, Dec=-27 deg. The sensitivity available in our deep observations allows an in-band, frequency-dependent analysis of polarized structure for the first time at long wavelengths. Our analysis suggests that the polarized structures are dominated by intrinsic emission but may also have a foreground Faraday screen component. At these wavelengths, the compactness of the MWA baseline distribution provides excellent snapshot sensitivity to large-scale structure. The observations are sensitive to diffuse polarized emission at 54' resolution with a sensitivity of 5.9 mJy beam^-1 and compact polarized sources at 2.4' resolution with a sensitivity of 2.3 mJy beam^-1 for a subset (400 deg^2) of this field. The sensitivity allows the effect of ionospheric Faraday rotation to be spatially and temporally measured directly from the diffuse polarized background. Our observations reveal large-scale structures ( 1 deg - 8 deg in extent) in linear polarization clearly detectable in 2 minute snapshots, which would remain undetectable by interferometers with minimum baseline lengths >110 m at 154 MHz. The brightness temperature of these structures is on average 4 K in polarized intensity, peaking at 11 K. Rotation measure synthesis reveals that the structures have Faraday depths ranging from -2 rad m^-2 to 10 rad m^-2 with a large fraction peaking at +1 rad m^-2. We estimate a distance of 51+/-20 pc to the polarized emission based on measurements of the in-field pulsar J2330-2005. We detect four extragalactic linearly polarized point sources within the field in our compact source survey. Based on the known polarized source population at 1.4 GHz and non-detections at 154 MHz, we estimate an upper limit on the depolarization ratio of 0.08 from 1.4 GHz to 154 MHz.
In this paper we present observations, simulations, and analysis demonstrating the direct connection between the location of foreground emission on the sky and its location in cosmological power spectra from interferometric redshifted 21 cm experiments. We begin with a heuristic formalism for understanding the mapping of sky coordinates into the cylindrically averaged power spectra measurements used by 21 cm experiments, with a focus on the effects of the instrument beam response and the associated sidelobes. We then demonstrate this mapping by analyzing power spectra with both simulated and observed data from the Murchison Widefield Array. We find that removing a foreground model which includes sources in both the main field-of-view and the first sidelobes reduces the contamination in high k_parallel modes by several percent relative to a model which only includes sources in the main field-of-view, with the completeness of the foreground model setting the principal limitation on the amount of power removed. While small, a percent-level amount of foreground power is in itself more than enough to prevent recovery of any EoR signal from these modes. This result demonstrates that foreground subtraction for redshifted 21 cm experiments is truly a wide-field problem, and algorithms and simulations must extend beyond the main instrument field-of-view to potentially recover the full 21 cm power spectrum.
We present first results from radio observations with the Murchison Widefield Array seeking to constrain the power spectrum of 21 cm brightness temperature fluctuations between the redshifts of 11.6 and 17.9 (113 and 75 MHz). 3 h of observations were conducted over two nights with significantly different levels of ionospheric activity. We use these data to assess the impact of systematic errors at low frequency, including the ionosphere and radio-frequency interference, on a power spectrum measurement. We find that after the 1-3 h of integration presented here, our measurements at the Murchison Radio Observatory are not limited by RFI, even within the FM band, and that the ionosphere does not appear to affect the level of power in the modes that we expect to be sensitive to cosmology. Power spectrum detections, inconsistent with noise, due to fine spectral structure imprinted on the foregrounds by reflections in the signal-chain, occupy the spatial Fourier modes where we would otherwise be most sensitive to the cosmological signal. We are able to reduce this contamination using calibration solutions derived from autocorrelations so that we achieve an sensitivity of 10(4) mK on comoving scales k <= 0.5 h Mpc(-1). This represents the first upper limits on the 21 cm power spectrum fluctuations at redshifts 12 <= z a <= 18 but is still limited by calibration systematics. While calibration improvements may allow us to further remove this contamination, our results emphasize that future experiments should consider carefully the existence of and their ability to calibrate out any spectral structure within the EoR window.
We present the 21 cm power spectrum analysis approach of the Murchison Widefield Array Epoch of Reionization project. In this paper, we compare the outputs of multiple pipelines for the purpose of validating statistical limits cosmological hydrogen at redshifts between 6 and 12. Multiple independent data calibration and reduction pipelines are used to make power spectrum limits on a fiducial night of data. Comparing the outputs of imaging and power spectrum stages highlights differences in calibration, foreground subtraction, and power spectrum calculation. The power spectra found using these different methods span a space defined by the various tradeoffs between speed, accuracy, and systematic control. Lessons learned from comparing the pipelines range from the algorithmic to the prosaically mundane; all demonstrate the many pitfalls of neglecting reproducibility. We briefly discuss the way these different methods attempt to handle the question of evaluating a significant detection in the presence of foregrounds.
The Murchison Widefield Array (MWA) has collected hundreds of hours of Epoch of Reionization (EoR) data and now faces the challenge of overcoming foreground and systematic contamination to reduce the data to a cosmological measurement. We introduce several novel analysis techniques, such as cable reflection calibration, hyper-resolution gridding kernels, diffuse foreground model subtraction, and quality control methods. Each change to the analysis pipeline is tested against a two-dimensional power spectrum figure of merit to demonstrate improvement. We incorporate the new techniques into a deep integration of 32 hours. of MWA data. This data set is used to place a systematic-limited upper limit on the cosmological power spectrum of Delta(2) <= 2.7 x 10(4) mK(2) at k = 0.27 h Mpc(-1) and z = 7.1, consistent with other published limits, and a modest improvement (factor of 1.4) over previous MWA results. From this deep analysis, we have identified a list of improvements to be made to our EoR data analysis strategies. These improvements will be implemented in the future and detailed in upcoming publications.
Abstract The science cases for incorporating high time resolution capabilities into modern radio telescopes are as numerous as they are compelling. Science targets range from exotic sources such as pulsars, to our Sun, to recently detected possible extragalactic bursts of radio emission, the so-called fast radio bursts (FRBs). Originally conceived purely as an imaging telescope, the initial design of the Murchison Widefield Array (MWA) did not include the ability to access high time and frequency resolution voltage data. However, the flexibility of the MWA’s software correlator allowed an off-the-shelf solution for adding this capability. This paper describes the system that records the 100 μs and 10 kHz resolution voltage data from the MWA. Example science applications, where this capability is critical, are presented, as well as accompanying commissioning results from this mode to demonstrate verification.
We present the results of a survey for low-frequency radio emission from 17 known exoplanetary systems with the Murchison Widefield Array. This sample includes 13 systems that have not previously been targeted with radio observations. We detected no radio emission at 154 MHz, and put 3 sigma upper limits in the range 15.2-112.5 mJy on this emission. We also searched for circularly polarized emission and made no detections, obtaining 3 sigma upper limits in the range 3.4-49.9 mJy. These are comparable with the best low-frequency radio limits in the existing literature and translate to luminosity limits of between 1.2 x 10(14) and 1.4 x 10(17) W if the emission is assumed to be 100 per cent circularly polarized. These are the first results from a larger program to systematically search for exoplanetary emission with the MWA.
Low-frequency, wide field-of-view (FOV) radio telescopes such as the Murchison Widefield Array (MWA) enable the ionosphere to be sampled at high spatial completeness. We present the results of the first power spectrum analysis of ionospheric fluctuations in MWA data, where we examined the position offsets of radio sources appearing in two data sets. The refractive shifts in the positions of celestial sources are proportional to spatial gradients in the electron column density transverse to the line of sight. These can be used to probe plasma structures and waves in the ionosphere. The regional (10-100km) scales probed by the MWA, determined by the size of its FOV and the spatial density of radio sources (typically thousands in a single FOV), complement the global (100-1000km) scales of GPS studies and local (0.01-1km) scales of radar scattering measurements. Our data exhibit a range of complex structures and waves. Some fluctuations have the characteristics of traveling ionospheric disturbances, while others take the form of narrow, slowly drifting bands aligned along the Earth's magnetic field.
Generation-integrated energy storage (GIES) systems store energy at some point along the transformation between the primary energy form and electricity. Instances exist already in natural hydro power, biomass generation, wave power, and concentrated solar power. GIES systems have been proposed for wind, nuclear power and they arise naturally in photocatalysis systems that are in development. GIES systems can compare very favourably in both performance and total cost against equivalent non-integrated systems comprising both generation and storage. Despite this, they have not hitherto been recognised as a discrete class of systems. Consequently policy decisions affecting development or demonstration projects and policy approaches concerning low-carbon generation are not fully informed. This paper highlights that policy structures exist militating against the development and introduction of GIES systems-probably to the detriment of overall system good.
AbstractWe compare first-order (refractive) ionospheric effects seen by the MWA with the ionosphere as inferred from GPS data. The first-order ionosphere manifests itself as a bulk position shift of the observed sources across an MWA field of view. These effects can be computed from global ionosphere maps provided by GPS analysis centres, namely the CODE. However, for precision radio astronomy applications, data from local GPS networks needs to be incorporated into ionospheric modelling. For GPS observations, the ionospheric parameters are biased by GPS receiver instrument delays, among other effects, also known as receiver DCBs. The receiver DCBs need to be estimated for any non-CODE GPS station used for ionosphere modelling. In this work, single GPS station-based ionospheric modelling is performed at a time resolution of 10 min. Also the receiver DCBs are estimated for selected Geoscience Australia GPS receivers, located at Murchison Radio Observatory, Yarragadee, Mount Magnet and Wiluna. The ionospheric gradients estimated from GPS are compared with that inferred from MWA. The ionospheric gradients at all the GPS stations show a correlation with the gradients observed with the MWA. The ionosphere estimates obtained using GPS measurements show promise in terms of providing calibration information for the MWA.
 Randall Wayth合作论文数Curtin Institute of Radio Astronomy, School of Electrical Engineering, Computing and Mathematical Sciences, Faculty of Science and Engineering, Curtin University;SKA Observatory44
 Steven J Tingay合作论文数International Centre for Radio Astronomy Research, Curtin University42
 David Emrich合作论文数41
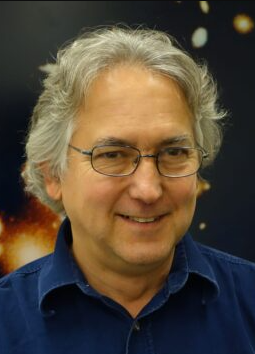 Edward Morgan合作论文数Kavli Institute for Astrophysics and Space Research, Massachusetts Institute of Technology41K. S. Srivani合作论文数41
 Prabu Thiagaraj合作论文数Raman Research Institute41
 Miguel F. Morales合作论文数Department of Physics, College of Arts & Sciences, University of Washington40Stephen Mark Ord合作论文数Swinburne University of Technology;Centre for Astrophysics and Supercomputing;Centre for Astrophysics and Supercomputing, Swinburne University of Technology40
 Divya Oberoi合作论文数Tata Institute of Fundamental Research National Centre for Radio Astrophysics40
 Udaya Shankar Narayana Rao合作论文数Raman Research Institute40
 Rachel Webster合作论文数School of Physics, University of Melbourne40Daniel A. Mitchell合作论文数Australia Telescope Natl Facil, CSIRO Astron & Space Sci39Stephen R. Mcwhirter合作论文数39
 Colin J. Lonsdale合作论文数Massachusetts Institute of Technology Haystack Observatory39
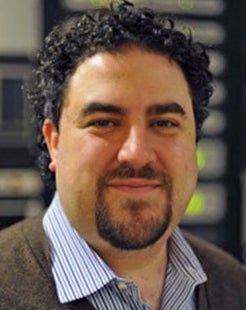 Justin C. Kasper合作论文数Climate and Space Sciences and Engineering Department, College of Engineering, University of Michigan;High Energy Astrophysics Division, Smithsonian Astrophysical Observatory, Harvard-Smithsonian Center for Astrophysics;Astronomy Department, Harvard University;BWX Technologies Inc39
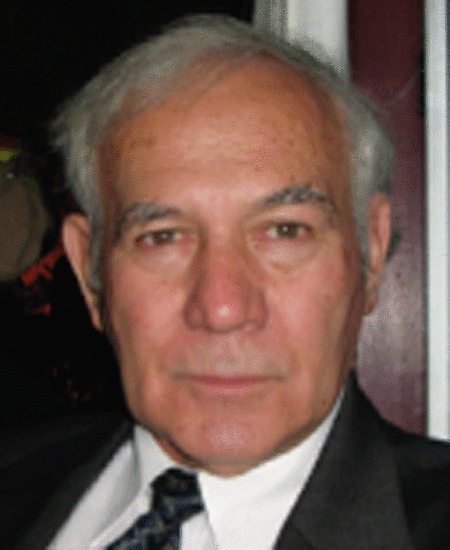 Mervyn J. Lynch合作论文数CSIRO Division of Atmospheric Research39Brian E. Corey合作论文数39
 Judd Bowman合作论文数LoCo Lab, School of Earth and Space Exploration, Arizona State University;College of Liberal Arts and Sciences, Arizona State University39
 Lincoln J. Greenhill合作论文数Department of Astronomy, Faculty of Arts and Sciences, Harvard University;Smithsonian Astrophysical Observatory39Bernardi G.合作论文数38
 Ravi Subrahmanyan合作论文数Raman Research Institute38
 Andrew John Williams合作论文数38
 Rigel Cappallo合作论文数Haystack Observatory, Massachusetts Institute of Technology37E. Kratzenberg合作论文数36
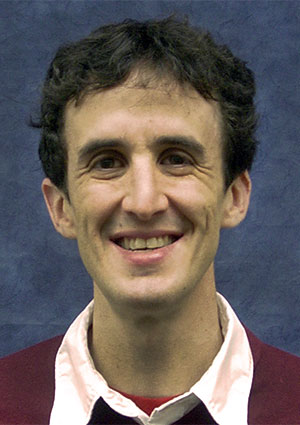 David Kaplan合作论文数Department of Physics, College of Letters & Science, University of Wisconsin-Milwaukee36C. L. Williams合作论文数35B. J. Hazelton合作论文数35
 Avinash A. Deshpande合作论文数Raman Res Inst35Frank H Briggs合作论文数35Ronald S Goeke合作论文数35Alan E. E. Rogers合作论文数34A. Roshi合作论文数30
 Bryan M Gaensler合作论文数Division of Physical and Biological Sciences, University of California, Santa Cruz;Department of Astronomy and Astrophysics, University of California, Santa Cruz29M. Johnston-Hollitt合作论文数27
 Emil Lenc合作论文数ATNF24Bruce A. Mckinley合作论文数Department of Surgery, University of Texas at Houston Medical School23
 André Offringa合作论文数Kapteyn Astronomical Institute, Faculty of Science and Engineering, University of Groningen;ASTRON Netherlands Institute for Radio Astronomy22
 Jacqueline N. Hewitt合作论文数Department of Physics, Massachusetts Institute of Technology22
 Natasha Hurley-Walker合作论文数International Centre for Radio Astronomy Research, Curtin University;Curtin Institute of Radio Astronomy, School of Electrical Engineering, Computing and Mathematical Sciences, Faculty of Science and Engineering, Curtin University21
 Pietro Procopio合作论文数School of Public Health, Faculty of Medicine and Health, The University of Sydney18
 Bart Pindor合作论文数School of Physics, Faculty of Science, The University of Melbourne17Aaron Ewall-Wice合作论文数Department of Physics, Massachusetts Institute of Technology;Department of Physics, University of California;Massachusetts Institute of Technology, University of California16
 Li Feng (封莉)合作论文数Purple Mountain Observatory, Chinese Academy of Sciences;University Chinese Academy of Sciences16
 Daniel C. Jacobs合作论文数Department of Physics;Montana State University;Department of Physics, Montana State University16
 Stuart Wyithe合作论文数School of Physics, University of Melbourne16J. Riding合作论文数15
 M. E. Bell合作论文数Cornell University;Department of Astronomy;Department of Astronomy, Cornell University15J. Stevens合作论文数14
 Natalia Kudryavtseva合作论文数Novosibirsk14




