The ongoing exponential growth of computational power, and the growth of the commercial High Performance Computing (HPC) industry, has led to a point where ten commercial systems currently exceed the performance of the highest-used HPC system in radio astronomy in Australia, and one of these exceeds the expected requirements of the Square Kilometre Array (SKA) Science Data Processors. In order to explore implications of this emerging change in the HPC landscape for radio astronomy, we report results from a survey conducted via semi-structured interviews with 14 Australian scientists and providers with experience of commercial HPC in astronomy and similar data intensive fields. We supplement these data with learnings from two earlier studies in which we investigated the application of commercial HPC to radio astronomy data processing, using cases with very different data and processing considerations. We use the established qualitative research approach of thematic analysis to extract key messages from our interviews. We find that commercial HPC can provide major advantages in accessibility and availability, and may contribute to increasing researchers' career productivity. Significant barriers exist, however, including the need for access to increased expertise in systems programming and parallelization, and a need for recognition in research funding. We comment on potential solutions to these issues.
The next generation of radio astronomy telescopes are challenging existing data analysis paradigms, as they have an order of magnitude more antennas and larger bandwidth. Foremost amongst these are deep spectral line surveys, because these have the largest number of epochs and spectral channels per dataset. For example, the Deep Investigation of Neutral Gas Origins (DINGO) project on the Australian Square Kilometre Array Pathfinder (ASKAP) aims to observe over 3,200 hours spread over hundreds of observing sessions, covering two tiles, two footprints and two frequency settings. The two primary problems encountered when processing this data are the need for storage and that processing is primarily I/O limited. To address these issues, we have implemented a deep imaging pipeline based on the storage of an intermediate data product in the software ASKAPsoft, that of the uv-gridded data, and have demonstrated lossy and lossless compression of this data on ASKAP, using MGARD and ADIOS2 libraries. We find data compression ratios from a factor of 7 (lossless) up to 20 (using lossy compression with an absolute error bound of 10^-4), and processing is significantly faster for lossless compression. We discuss the effectiveness of lossy MGARD compression and its adherence to the designated error bounds, the trade-off between these error bounds and the corresponding compression ratios, as well as the potential consequences of these I/O and storage improvements on the science quality of the data products. As lossless compression allows us to achieve the DINGO goals within the storage limitations for the project, this will be the option adopted.
The locations of Ly alpha-emitting galaxies (LAEs) at the end of the Epoch of Reionization (EoR) are expected to correlate with regions of ionized hydrogen, traced by the redshifted 21cm hyperfine line. Mapping the neutral hydrogen around regions with detected and localized LAEs offers an avenue to constrain the brightness temperature of the Universe within the EoR by providing an expectation for the spatial distribution of the gas, thereby providing prior information unavailable to power spectrum measurements. We use a test set of 12h of observations from the Murchison Widefield Array (MWA) in extended array configuration, to constrain the neutral hydrogen signature of 58 LAEs, detected with the Subaru Hypersuprime Cam in the Silverrush survey, centred on z = 6.58. We assume that detectable emitters reside in the centre of ionized Hii bubbles during the end of reionization, and predict the redshifted neutral hydrogen signal corresponding to the remaining neutral regions using a set of different ionized bubble radii. A pre-whitening matched filter detector is introduced to assess detectability. We demonstrate the ability to detect, or place limits upon, the amplitude of brightness temperature fluctuations, and the characteristic Hii bubble size. With our limited data, we constrain the brightness temperature of neutral hydrogen to Delta T-B <30mK (<200mK) at 95percent (99percent) confidence for lognormally distributed bubbles of radii, R-B = 15 +/- 2h(-1)cMpc.
ABSTRACTObservations in the lowest Murchison Widefield Array (MWA) band between 75 and 100 MHz have the potential to constrain the distribution of neutral hydrogen in the intergalactic medium at redshift ∼13–17. Using 15 h of MWA data, we analyse systematics in this band such as radio-frequency interference (RFI), ionospheric and wide field effects. By updating the position of point sources, we mitigate the direction-independent calibration error due to ionospheric offsets. Our calibration strategy is optimized for the lowest frequency bands by reducing the number of direction-dependent calibrators and taking into account radio sources within a wider field of view. We remove data polluted by systematics based on the RFI occupancy and ionospheric conditions, finally selecting 5.5 h of the cleanest data. Using these data, we obtain 2σ upper limits on the 21 cm power spectrum in the range of $0.1~ h~{\mathrm{ Mpc}}^{-1}\lessapprox k \lessapprox 1 ~ ~h~{\mathrm{ Mpc}}^{-1}$ and at z = 14.2, 15.2, and 16.5, with the lowest limit being $6.3\times 10^6 ~\rm mK^2$ at $k=0.14 ~h~{\mathrm{ Mpc}}^{-1}$ and at z = 15.2 with a possibility of a few per cent of signal loss due to direction-independent calibration.
The Large-aperture Experiment to detect the Dark Age (LEDA) was designed to measure the 21-cm signal from neutral hydrogen at Cosmic Dawn, z ≈15-30. Using observations made with the ≈ 200m diameter core of the Owens Valley Long Wavelength Array (OVRO-LWA), we present a 2-D cylindrical spatial power spectrum for data at 43.1-53.5 MHz (zmedian ≈ 28) incoherently integrated for 4 hours, and an analysis of the array sensitivity. Power from foregrounds is localized to a “wedge” within k⊥, k ‖ space. After calibration of visibilities using 5 bright compact sources including Vir A, we measure Δ2 (k) ≈ 2 × 10¹² mK2 outside the foreground wedge, where an uncontaminated cosmological signal would lie, in principle. The measured Δ2 (k) is an upper limit that reflects a combination of thermal instrumental and sky noise, and unmodelled systematics that scatter power from the wedge, as will be discussed. By differencing calibrated visibilities for close pairs of frequency channels, we suppress foreground sky structure and systematics, extract thermal noise, and use a mix of coherent and incoherent integration to simulate a noise-dominated power spectrum for a 3000 h observation and z = 16 − 37. For suitable calibration quality, the resulting noise level, Δ2 (k) ≈ 100 mK2 (k = 0.3 Mpc−1), would be sufficient to detect peaks in the 21-cm spatial power spectrum due to early Ly-α and X-ray sources, as predicted for a range of theoretical model parameters.
ABSTRACT Current attempts to measure the 21 cm power spectrum of neutral hydrogen during the epoch of reionization (EoR) are limited by systematics that produce measured upper limits above both the thermal noise and the expected cosmological signal. These systematics arise from a combination of observational, instrumental, and analysis effects. In order to further understand and mitigate these effects, it is instructive to explore different aspects of existing data sets. One such aspect is the choice of observing field. To date, MWA EoR observations have largely focused on the EoR0 field. In this work, we present a new detailed analysis of the EoR1 field. The EoR1 field is one of the coldest regions of the southern radio sky, but contains the very bright radio galaxy Fornax-A. The presence of this bright extended source in the primary beam of the interferometer makes the calibration and analysis of EoR1 particularly challenging. We demonstrate the effectiveness of a recently developed shapelet model of Fornax-A in improving the results from this field. We also describe and apply a series of data quality metrics that identify and remove systematically contaminated data. With substantially improved source models, upgraded analysis algorithms and enhanced data quality metrics, we determine EoR power spectrum upper limits based on analysis of the best ∼14-h data observed during 2015 and 2014 at redshifts 6.5, 6.8, and 7.1, with the lowest 2σ upper limit at z = 6.5 of Δ2 ≤ (73.78 mK)2 at k = 0.13 h Mpc−1, improving on previous EoR1 measurement results.
INTRODUCTION:The preferred diagnostic pathway for patients presenting with non-massive haemoptysis and normal or benign computer tomography (CT) radiological findings is unclear. The common approach is to investigate with both CT and bronchoscopy, irrespective of patient-specific factors. The value of performing fibreoptic bronchoscopy (FOB) in patients with non-massive haemoptysis and clear or benign CT findings remains undetermined. We aimed to investigate its value using a large retrospective case series.MATERIAL AND METHODS:A retrospective review of 4376 FOBs performed in Northumbria Healthcare NHS Foundation Trust from January 2012 to December 2019 for patients presenting with haemoptysis and clear or benign CT findings. Statistical analysis was performed to describe patient-specific variables, clinical characteristics, pathological findings and subsequent management decisions.RESULTS:A total of 4376 FOBs were performed during the study period, 275 were indicated to investigate non-massive haemoptysis. Two hundred and fifty-nine patients underwent a CT scan (158 before and 101 after FOB); 16 never had a CT because the treating physician did not feel it was necessary. About 258 CT scans showed normal anatomy. All patients underwent FOB; 192 showed normal findings. Bronchoscopic findings did not alter clinical management in 274 patients. One patient was referred to the ear, nose and throat department following the identification of polypoid vocal cord lesion which, following thorough investigation, was confirmed as benign.CONCLUSION:FOB provides minimal value for identifying lung malignancies in patients with non-massive haemoptysis and a clear or benign CT scan irrespective of patient-specific risk factors. Cost savings would be associated if physicians altered practice accordingly.
Abstract To make a power spectrum (PS) detection of the 21-cm signal from the Epoch of Reionisation (EoR), one must avoid/subtract bright foreground sources. Sources such as Fornax A present a modelling challenge due to spatial structures spanning from arc seconds up to a degree. We compare modelling with multi-scale (MS) CLEAN components to ‘shapelets’, an alternative set of basis functions. We introduce a new image-based shapelet modelling package, SHAMFI. We also introduce a new CUDA simulation code (WODEN) to generate point source, Gaussian, and shapelet components into visibilities. We test performance by modelling a simulation of Fornax A, peeling the model from simulated visibilities, and producing a residual PS. We find the shapelet method consistently subtracts large-angular-scale emission well, even when the angular resolution of the data is changed. We find that when increasing the angular resolution of the data, the MS CLEAN model worsens at large angular scales. When testing on real Murchison Widefield Array data, the expected improvement is not seen in real data because of the other dominating systematics still present. Through further simulation, we find the expected differences to be lower than obtainable through current processing pipelines. We conclude shapelets are worthwhile for subtracting extended galaxies, and may prove essential for an EoR detection in the future, once other systematics have been addressed.
Abstract Precise instrumental calibration is of crucial importance to 21-cm cosmology experiments. The Murchison Widefield Array’s (MWA) Phase II compact configuration offers us opportunities for both redundant calibration and sky-based calibration algorithms; using the two in tandem is a potential approach to mitigate calibration errors caused by inaccurate sky models. The MWA Epoch of Reionization (EoR) experiment targets three patches of the sky (dubbed EoR0, EoR1, and EoR2) with deep observations. Previous work in Li et al. (2018) and (2019) studied the effect of tandem calibration on the EoR0 field and found that it yielded no significant improvement in the power spectrum (PS) over sky-based calibration alone. In this work, we apply similar techniques to the EoR1 field and find a distinct result: the improvements in the PS from tandem calibration are significant. To understand this result, we analyse both the calibration solutions themselves and the effects on the PS over three nights of EoR1 observations. We conclude that the presence of the bright radio galaxy Fornax A in EoR1 degrades the performance of sky-based calibration, which in turn enables redundant calibration to have a larger impact. These results suggest that redundant calibration can indeed mitigate some level of model incompleteness error.
We compute the spherically averaged power spectrum from four seasons of data obtained for the Epoch of Reionization (EoR) project observed with the Murchison Widefield Array (MWA). We measure the EoR power spectrum over k = 0.07–3.0 h Mpc−1 at redshifts $z$ = 6.5–8.7. The largest aggregation of 110 h on EoR0 high band (3340 observations), yields a lowest measurement of (43 mK)2 = 1.8 × 10³ mK2 at k = 0.14 h Mpc−1 and $z$ = 6.5 (2σ thermal noise plus sample variance). Using the Real-Time System to calibrate and the CHIPS pipeline to estimate power spectra, we select the best observations from the central five pointings within the 2013–2016 observing seasons, observing three independent fields and in two frequency bands. This yields 13 591 2-min snapshots (453 h), based on a quality assurance metric that measures ionospheric activity. We perform another cut to remove poorly calibrated data, based on power in the foreground-dominated and EoR-dominated regions of the two-dimensional power spectrum, reducing the set to 12 569 observations (419 h). These data are processed in groups of 20 observations, to retain the capacity to identify poor data, and used to analyse the evolution and structure of the data over field, frequency, and data quality. We subsequently choose the cleanest 8935 observations (298 h of data) to form integrated power spectra over the different fields, pointings, and redshift ranges.
TheParker Solar Probe(PSP) spacecraft has flown into the densest, previously unexplored, innermost region of our solar system's zodiacal cloud. WhilePSPdoes not have a dedicated dust detector, multiple instruments on the spacecraft are sensitive to the effects of meteoroid bombardment. Here, we discuss measurements taken duringPSP's second orbit and compare them to models of the zodiacal cloud's dust distribution. Comparing the radial impact rate trends and the timing and location of a dust impact to an energetic particle detector, we find the impactor population to be consistent with dust grains on hyperbolic orbits escaping the solar system. AssumingPSP's impact environment is dominated by hyperbolic impactors, the total quantity of dust ejected from our solar system is estimated to be 0.5-10 tons/s. We expectPSPwill encounter an increasingly intense impactor environment as its perihelion distance and semimajor axis are decreased.
The compact configuration of Phase II of the Murchison Widefield Array (MWA) consists of both a redundant subarray and pseudo-random baselines, offering unique opportunities to perform sky-model and redundant interferometric calibration. The highly redundant hexagonal cores give improved power spectrum sensitivity. In this paper, we present the analysis of nearly 40 hr of data targeting one of the MWA's epoch of reionization (EoR) fields observed in 2016. We use both improved analysis techniques presented in Barry et al. and several additional techniques developed for this work, including data quality control methods and interferometric calibration approaches. We show the EoR power spectrum limits at redshift 6.5, 6.8, and 7.1 based on our deep analysis on this 40 hr data set. These limits span a range in k-space of 0.18 h Mpc(-1) < k < 1.6 h Mpc(-1), with a lowest measurement of Delta(2) <= 2.39 x 10(3) mK(2) at k = 0.59 h Mpc(-1) and z = 6.5.
Measurements of 21 cm Epoch of Reionization (EoR) structure are subject to systematics originating from both the analysis and the observation conditions. Using 2013 data from the Murchison Widefield Array (MWA), we show the importance of mitigating both sources of contamination. A direct comparison between results from Beardsley et al. and our updated analysis demonstrates new precision techniques, lowering analysis systematics by a factor of 2.8 in power. We then further lower systematics by excising observations contaminated by ultra-faint RFI, reducing by an additional factor of 3.8 in power for the zenith pointing. With this enhanced analysis precision and newly developed RFI mitigation, we calculate a noise-dominated upper limit on the EoR structure of Δ 2 ≤ 3.9 × 10 3 mK 2 at k = 0.20 h Mpc −1 and z = 7 using 21 hr of data, improving previous MWA limits by almost an order of magnitude.
We explore methods for robust estimation of the 21 cm signal from the Epoch of Reionization (EoR). A Kernel Density Estimator (KDE) is introduced for measuring the spatial temperature fluctuation power spectrum from the EoR. The KDE estimates the underlying probability distribution function of fluctuations as a function of spatial scale, and contains different systematic biases and errors to the typical approach to estimating the fluctuation power spectrum. Extraction of Histograms of visibilities allows MOMeillS analysis to be used to discriminate foregrounds from 21 cm signal and thermal noise. We use the information available in the histograms, along with the statistical dis-similarity of foregrounds from two independent observing fields, to robustly separate foregrounds from cosmological signal, while making no assumptions about the Gaussianily of the signal. Using two independent observing fields to robustly discriminate signal from foregrounds is crucial for the analysis presented in this paper. We apply the techniques to 13 h of Murchison Widetield Array FoR data over two observing fields. We compare the output to that obtained with a comparative power spectrum estimation method, and demonstrate the reduced foreground contamination using this approach. Using the second moment obtained directly from the KDE distribution functions yields a factor of 2-3 improvement in power for k < 0.3 h Mpc I compared with a matched delay space power estimator, while weighting data by additional statistics does not offer significant improvement beyond that available for thermal noise-only weights.
We apply two methods to estimate the 21-cm bispectrum from data taken within the Epoch of Reionisation (EoR) project of the Murchison Widefield Array (MWA). Using data acquired with the Phase II compact array allows a direct bispectrum estimate to be undertaken on the multiple redundantly spaced triangles of antenna tiles, as well as an estimate based on data gridded to the uv-plane. The direct and gridded bispectrum estimators are applied to 21 h of high-band (167-197 MHz; z = 6.2-7.5) data from the 2016 and 2017 observing seasons. Analytic predictions for the bispectrum bias and variance for point-source foregrounds are derived. We compare the output of these approaches, the foreground contribution to the signal, and future prospects for measuring the bispectra with redundant and non-redundant arrays. We find that some triangle configurations yield bispectrum estimates that are consistent with the expected noise level after 10 h, while equilateral configurations are strongly foreground-dominated. Careful choice of triangle configurations may be made to reduce foreground bias that hinders power spectrum estimators, and the 21-cm bispectrum may be accessible in less time than the 21-cm power spectrum for some wave modes, with detections in hundreds of hours.
We report on a search for low-frequency radio variability in 944 bright (>4 Jy at 154 MHz) unresolved, extragalactic radio sources monitored monthly for several years with the Murchison Widefield Array. In the majority of sources, we find very low levels of variability with typical modulation indices <5 per cent. We detect 15 candidate low-frequency variables that show significant long-term variability (>2.8 yr) with time-averaged modulation indices (M) over bar = 3.1-7.1 per cent. With 7/15 of these variable sources having peaked spectral energy distributions, and only 5.7 per cent of the overall sample having peaked spectra, we find an increase in the prevalence of variability in this spectral class. We conclude that the variability seen in this survey is most probably a consequence of refractive interstellar scintillation and that these objects must have the majority of their flux density contained within angular diameters less than 50 milliarcsec (which we support with multiwavelength data). At 154 MHz, we demonstrate that interstellar scintillation time-scales become long (similar to decades) and have low modulation indices, while synchrotron-driven variability can only produce dynamic changes on time-scales of hundreds of years, with flux density changes less than one milli-jansky (without relativistic boosting). From this work, we infer that the low-frequency extragalactic southern sky, as seen by SKA-Low, will be non-variable on time-scales shorter than 1 yr.
The Australian Square Kilometre Array Pathfinder (ASKAP) is an interferometric array of 36 fully steerable dishes operating at low radio frequencies (700-1800 MHz) with wide instantaneous bandwidths of 300 MHz. Located at the radio-quiet Murchison Radio-astronomy Observatory (MRO) in the deserts of Western Australia, ASKAP is unique in several ways. Each of these 12-metre dishes is equipped with an array of 188 Phased Array Feeds (PAFs) at their focal planes. The PAFs provide enormous flexibility in reliably measuring wide regions of the sky. While conventional telescopes observe the sky with a single instantaneous beam, the ASKAP PAFs, with its current hardware, can electronically form up to 36 simultaneous dual-polarised beams on the sky. The “Roll axis” allows rotation of the dishes about their optic axes, thus ensuring the multiple beams formed by the ASKAP PAFs remain fixed with respect to the sky throughout the observation duration thereby facilitating high dynamic range imaging. While these make ASKAP a very powerful wide field-of-view instrument (with instantaneous f-o-v ~30 square-degrees at the lower end of its operating frequency band), the resulting high data volumes present new challenges in data processing (calibration, imaging, archiving etc.,) and require the algorithms and the processing pipelines to adopt high performance computing solutions.
 Randall Wayth合作论文数Curtin Institute of Radio Astronomy, School of Electrical Engineering, Computing and Mathematical Sciences, Faculty of Science and Engineering, Curtin University;SKA Observatory97
 Rachel Webster合作论文数School of Physics, University of Melbourne89
 Miguel F. Morales合作论文数Department of Physics, College of Arts & Sciences, University of Washington88
 Steven J Tingay合作论文数International Centre for Radio Astronomy Research, Curtin University88
 Lincoln J. Greenhill合作论文数Department of Astronomy, Faculty of Arts and Sciences, Harvard University;Smithsonian Astrophysical Observatory86
 Stephen Mark Ord合作论文数Swinburne University of Technology;Centre for Astrophysics and Supercomputing;Centre for Astrophysics and Supercomputing, Swinburne University of Technology85
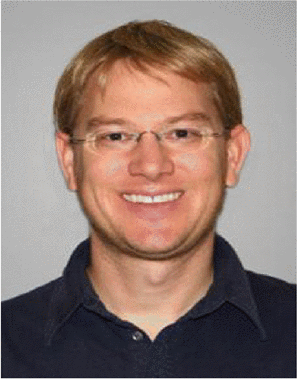 Judd Bowman合作论文数LoCo Lab, School of Earth and Space Exploration, Arizona State University;College of Liberal Arts and Sciences, Arizona State University83
 Udaya Shankar Narayana Rao合作论文数Raman Research Institute76
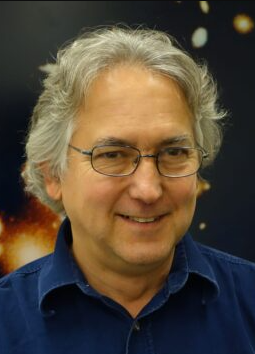 Edward Morgan合作论文数Kavli Institute for Astrophysics and Space Research, Massachusetts Institute of Technology73
 Ravi Subrahmanyan合作论文数Raman Research Institute73Frank H Briggs合作论文数73
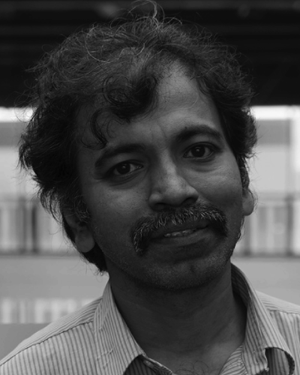 Prabu Thiagaraj合作论文数Raman Research Institute73K. S. Srivani合作论文数72
 Divya Oberoi合作论文数Tata Institute of Fundamental Research National Centre for Radio Astrophysics72B. J. Hazelton合作论文数71
 Colin J. Lonsdale合作论文数Massachusetts Institute of Technology Haystack Observatory70Stephen R. Mcwhirter合作论文数69
 Andrew John Williams合作论文数69
 David Kaplan合作论文数Department of Physics, College of Letters & Science, University of Wisconsin-Milwaukee66
 Rigel Cappallo合作论文数Haystack Observatory, Massachusetts Institute of Technology66
 Avinash A. Deshpande合作论文数Raman Res Inst62C. L. Williams合作论文数59Bernardi G.合作论文数57
 Bryan M Gaensler合作论文数Division of Physical and Biological Sciences, University of California, Santa Cruz;Department of Astronomy and Astrophysics, University of California, Santa Cruz57M. Johnston-Hollitt合作论文数50David Emrich合作论文数49
 André Offringa合作论文数Kapteyn Astronomical Institute, Faculty of Science and Engineering, University of Groningen;ASTRON Netherlands Institute for Radio Astronomy47Bruce A. Mckinley合作论文数Department of Surgery, University of Texas at Houston Medical School46
 Justin C. Kasper合作论文数Climate and Space Sciences and Engineering Department, College of Engineering, University of Michigan;High Energy Astrophysics Division, Smithsonian Astrophysical Observatory, Harvard-Smithsonian Center for Astrophysics;Astronomy Department, Harvard University;BWX Technologies Inc46
 Mervyn J. Lynch合作论文数CSIRO Division of Atmospheric Research46Brian E. Corey合作论文数46
 Bart Pindor合作论文数School of Physics, Faculty of Science, The University of Melbourne44
 Jacqueline N. Hewitt合作论文数Department of Physics, Massachusetts Institute of Technology44E. Kratzenberg合作论文数43
 Emil Lenc合作论文数ATNF43
 Natasha Hurley-Walker合作论文数International Centre for Radio Astronomy Research, Curtin University;Curtin Institute of Radio Astronomy, School of Electrical Engineering, Computing and Mathematical Sciences, Faculty of Science and Engineering, Curtin University42Alan E. E. Rogers合作论文数41
 Cathryn Trott合作论文数Curtin Institute of Radio Astronomy, School of Elec Eng, Comp and Math Sci, Faculty of Science and Engineering, Curtin University41Michael Waterson合作论文数University of Newcastle upon Tyne39
 Stuart Wyithe合作论文数School of Physics, University of Melbourne37Ronald S Goeke合作论文数37
 Pietro Procopio合作论文数School of Public Health, Faculty of Medicine and Health, The University of Sydney35
 Daniel C. Jacobs合作论文数Department of Physics;Montana State University;Department of Physics, Montana State University34A. Roshi合作论文数30
 M. E. Bell合作论文数Cornell University;Department of Astronomy;Department of Astronomy, Cornell University30J. Riding合作论文数28
 Adam Beardsley合作论文数Department of Physics, College of Science & Engineering, Winona State University28
 Li Feng (封莉)合作论文数Purple Mountain Observatory, Chinese Academy of Sciences;University Chinese Academy of Sciences28
 Jonathan Charles Pober (Jonathan C Pober)合作论文数Department of Physics, Brown University27




