Coastal erosion at wave-dominated beaches, primarily driven by nearshore wave dynamics, poses a substantial challenge for coastal management. While existing datasets from individual beaches have improved our understanding of site-specific coastal morphodynamics, there is a growing demand for regional-scale datasets to understand and predict regional shoreline responses to climate variability. To address this, we present a combined shoreline and nearshore wave dataset for the wave-dominated coast of southeast Australia, comprising over 8,000 cross-shore transects at 100 m spacing for over 300 beaches. For each transect, satellite-derived shoreline positions (1984-2024) and beach-face slopes are provided, alongside hourly nearshore wave parameters (1979-2024) extracted at the 10 m depth contour. Shoreline data have been validated using available field surveys, and wave data have been assessed against offshore and nearshore buoy observations. This dataset provides a valuable resource for developing regional-scale understanding of shoreline variability along wave-dominated and embayed coastlines.
Rip currents claim more lives annually in Australia than floods, bushfires, cyclones, or shark attacks, with fatalities disproportionately affecting young males and occurring at unpatrolled beaches. Despite ongoing investments in surf lifesaving, safety infrastructure, and educational campaigns, rip current-related deaths are rising, highlighting the need for innovative solutions. Addressing this challenge, the “RipEye” project leverages computer vision technology to detect rip currents via smartphone cameras. This collaborative initiative, involving Surf Life Saving Australia (SLSA) and multidisciplinary university researchers, focuses on three objectives: (1) compiling a rip current detection dataset specific to Australian beaches, (2) optimizing image and video analysis techniques for accurate rip detection, and (3) evaluating the framework’s feasibility to enhance public awareness and safety practices. By targeting unpatrolled beaches and high-risk demographics, the RipEye project seeks to supplement traditional lifesaving methods, providing accessible tools for rip current identification. This paper outlines the methodology behind RipEye, presents preliminary findings, and discusses its potential impact in improving beach safety.
The southeast coastline of Australia is frequently impacted by East Coast Lows (ECLs), hybrid storms with both tropical and extratropical characteristics. Although typically short-lived and spatially limited, ECLs can rapidly intensify and generate extreme waves that cause severe coastal erosion and associated hazards. Their small scale and transient nature make ECLs difficult to resolve in conventional global climate models. This study utilizes the HiRes-MESECA atmospheric data set, comprising 12 historically significant ECL events between 2001 and 2016 that are re-simulated under an RCP8.5 climate scenario using a pseudo global warming approach. Triple-nested WaveWatchIII modeling, resolving waves to a spatial resolution of 100 m near the coast, was used to simulate ECL-driven waves at the 10 m isobath coastal boundary. Results indicate that future ECLs may generate reduced peak wave heights, wave periods and overall cumulative wave power along southeast Australia, even considering an extreme (RCP8.5) climate change scenario. Together, these findings suggest that extreme ECL-driven wave impacts along southeast Australia may weaken in a warming climate, reinforcing emerging evidence of declining wave extremes in the region.
This study presents a novel methodology to forecast shoreline position at the seasonal to five-year time scale using the statistical time series models SARIMAX and SVARX in combination with satellite-derived shorelines (CoastSat). 25 years of CoastSat shorelines at Curl Curl Beach in SE Australia were used to test and train the models, with forecast inputs including offshore and nearshore significant wave height and several climate indices relevant to the Australian coastline (ENSO and IOD). Over a five-year forecast horizon, it was found that the SARMIAX and SVARX models showed higher skill than a baseline linear regression model, with RMSE of approximately 10 m across all nine beach transects. The performance of these statistical time series models indicates the potential for the methodology to be extended to large spatial scales, providing valuable long range (i.e. seasonal to multi-year) forecasts of shoreline change to assist coastal managers.
Long-term, high-frequency records of shoreline position are fundamental for understanding coastal variability, quantifying erosion and recovery processes, validating remote-sensing products, and developing robust predictive coastal models. Here we present a 91-year, multi-method shoreline dataset from Narrabeen-Collaroy Beach, southeast Australia – one of the world’s most intensively monitored sandy coastlines. The dataset contains 10,334 individual shorelines (> 2.5 million data points) spanning 1930–2021, integrating thirteen complementary survey techniques ranging from historical aerial photography and satellite-derived shorelines, to continuously scanning lidar, Argus coastal imaging, quad bike RTK-GNSS surveys, and community-sourced CoastSnap observations. All shoreline positions are referenced to a consistent vertical datum and transformed into a unified alongshore/cross-shore coordinate system, with survey uncertainties quantified using high-accuracy RTK-GNSS and airborne lidar. This open-access dataset provides unprecedented spatiotemporal coverage (from sub-daily to decadal time scales) and captures shoreline responses to individual storms, embayed beach rotation, and long-term climatic forcing. Covering nearly a century, it offers a unique resource for coastal process studies, model development and validation, remote-sensing algorithm assessment, coastal planning and adaptation, and coastal risk applications.
Robust and reliable models are needed to understand how coastlines will evolve over the coming decades, driven by both natural variability and climate change. This study evaluated how accurately five popular ‘reduced-complexity’ models replicate multi-decadal shoreline change at Narrabeen-Collaroy Beach, a sandy embayment in Sydney, Australia. Measured shoreline positions derived from approximately monthly field surveys were used for 20-year calibration and 20-year validation periods. The models performed similarly on average but with large variability between transects. The set-up of several models was modified to compensate for their sensitivity to imperfect input wave data, and further site-specific improvements were identified. Capturing interannual to decadal-scale variability in cross-shore and longshore dynamics at this site was challenging for all five models. Models appeared to aggregate key processes at this timescale into parameter values rather than representing them directly. This suggests time-varying parameters or changes to model structure may be necessary for decadal-scale simulations.
Narrabeen Beach is 3.6 km-long embayed sandy beach located in southeast Australia on the northern beaches of Sydney. It is well known in the coastal research community for its long-term beach monitoring program, that was commenced in 1976 by Prof. Andy Short and has continued uninterrupted until the present day. This program has led to a number of groundbreaking research advances, including the Wright and Short morphodynamic beach state model, embayed beach rotation and links to climate cycles like the El Niño/Southern Oscillation. This presentation will present a significant extension of this monitoring program through the inclusion of advanced shoreline monitoring techniques. These techniques include: historical aerial photographs, airborne and fixed Lidar, UAV, satellite-derived shorelines (CoastSat), Argus coastal imaging and CoastSnap citizen science. This large dataset (comprising over 1 million data points) enables an unprecedented look at shoreline change in dynamic, wave-dominated environments on time scales from sub-daily to decadal. The talk will showcase new research derived from this dataset, including data-driven forecast models of shoreline erosion and insights on long-term coastal change. Finally, links to accessing this open-source dataset will be described.
CoastSnap is a low-cost citizen science beach monitoring program that empowers local communities to collect quantitative measurements of coastline change using their smartphones. Underpinning CoastSnap is a stainless-steel smartphone cradle that is installed overlooking a beach in a location easily accessible to the public. Using the cradle for image positioning, passers-by simply take a photo of the coast and upload it to a centralized database, which in turn provides a crowd-sourced record of coastline change over time. Behind this simple idea are advanced image processing algorithms that then enable the shoreline position (and other relevant coastal features) to be mapped from these community snapshots in a scientifically rigorous manner. First established in Sydney, Australia in May 2017, the network of CoastSnap stations has grown rapidly over the past seven years to now encompass over 350 monitoring locations in 31 countries. This growth of this global network now means that the CoastSnap project comprises the largest coordinated network of coastal monitoring worldwide. The poster will provide a general overview of this unique global citizen science program to date and present latest developments regarding enhanced automation using AI, participation and new research outcomes.
We report on remote sensing techniques developed to characterize seasonal shoreline cycles from satellite-derived shoreline measurements. These techniques are applied to 22-yr of shoreline measurements for over 777 km of beach along California's 1,700-km coast, for which the general understanding is that shorelines exhibit winter-narrow and summer-recovery seasonality. We find that approximately 90% of beach transects exhibit significant and recurring seasonal cycles in the shoreline position. Seasonal shoreline excursions are twice as large in northern and central California (17.5-32.2 m) than southern California (7.3-15.9 m; interquartile ranges). Clustering analyses were effective at characterizing the temporal patterns of the seasonality, revealing that similar to 459 km of beach (59%) exhibit winter-narrow conditions, whereas similar to 189 km (24%) and similar to 50 km (6.4%) exhibit spring-narrow and summer-narrow conditions, respectively. These spring- and summer-narrow conditions are most common in southern California, where they represent over half of the total length of beach shoreline. Multivariate analyses reveal that wave climate and geomorphic setting are significantly related to the magnitude and timing of shoreline seasonal cycles. Combinations of these variables explain 44% of the seasonality variance of the complete data set and 85% of the variance for a subset of 93 long (>1 km) continuous beaches. We conclude that diversity in waves and geomorphic setting along California cause a broad range of seasonal patterns in the shoreline. Combined, this indicates that the overly generalized "winter-narrow/summer-recovery" conventions for California beaches are not expressed universally and that shoreline seasonality is far more diverse than these simple canonical rules.
Robust predictions of shoreline change are critical for sustainable coastal management. Despite advancements in shoreline models, objective benchmarking remains limited. Here we present results from ShoreShop2.0, an international collaborative benchmarking workshop, where 34 groups submitted shoreline change predictions in a blind competition. Subsets of shoreline observations at an undisclosed site (BeachX) over short (5-year) and medium (50-year) periods were withheld from modelers and used for model benchmarking. Using satellite-derived shoreline datasets for calibration and evaluation, the best performing models achieved prediction accuracies on the order of 10 m, comparable to the accuracy of the satellite shoreline data, indicating that certain beaches can be modelled nearly as well as they can be remotely observed. The outcomes from this collaborative benchmarking competition critically review the present state-of-the-art in shoreline change prediction as well as reveal model limitations, facilitate improvements, and offer insights for advancing shoreline-prediction capabilities.
Emergency managers have an increasing need for tools to enhance preparedness to extreme coastal storms and support disaster risk reduction measures. With the emergence of Early Warning Systems (EWSs) for coastal storm hazards, a fundamental challenge is the accurate prediction of sandy beach erosion at lead times of days to weeks corresponding to an approaching storm event. This work presents a data-driven modelling approach to predict storm-driven beach erosion (shoreline change) using a large dataset of 276 individual storm events at Narrabeen-Collaroy Beach, SE Australia. Correlation analysis between individual storm characteristics and shoreline response at three locations along the embayment with varying exposure to the prevailing waves indicates that cumulative storm wave energy is the dominant driver of storm erosion at this site. This is followed by the pre-storm beach width, storm wave direction and to a minimal extent, storm wave period and water levels. A multi-linear regression model of storm erosion is developed and found to accurately predict shoreline change due to individual storm events (RMSE = 3.7 m - 6.4 m). This work highlights the value of high-frequency shoreline data for storm erosion forecasting and provides a framework for real-time forecasting applications.
Wind wave observations in shallow coastal waters are essential for calibrating, validating, and improving numerical wave models to predict sediment transport, shoreline change, and coastal hazards such as beach erosion and oceanic inundation. Although ocean buoys and satellites provide near-global coverage of deep-water wave conditions, shallow-water wave observations remain sparse and often inaccessible. Nearshore wave conditions may vary considerably alongshore due to coastline orientation and shape, bathymetry and islands. We present a growing dataset of in-situ wave buoy observations from shallow waters (<35 m) in southeast Australia that comprises over 7,000 days of measurements at 20 locations. The moored buoys measured wave conditions continuously for several months to multiple years, capturing ambient and storm conditions in diverse settings, including coastal hazard risk sites. The dataset includes tabulated time series of spectral and time-domain parameters describing wave height, period and direction at half-hourly temporal resolution. Buoy displacement and wave spectra data are also available for advanced applications. Summary plots and tables describing wave conditions measured at each location are provided.
National weather forecasting agencies routinely issue a range of hazard warnings. But to our knowledge, along sandy coastlines where storm waves and storm surge can result in widespread but location-specific beach erosion and beachfront flooding, no national-scale early warning service for these hazards is presently operational. This paper outlines the scientific basis and implementation of a new framework for large area coastal storm hazards forecasting, currently being tested along the southwest (Indian Ocean) and southeast (Pacific Ocean) coasts of Australia. The system provides 7-day rolling predictions of localized beach erosion and/or coastal flooding linked to forecasted extreme weather events. Coastal setting influences the nature and occurrence of these hazards, with sandy beaches along wave-dominated coasts more prone to erosion and at surge-dominated coasts to flooding. An existing nearshore water-level forecasting system and a new inshore wave modeling capability are used to forecast beach erosion and coastal flooding at every 100 m along the shore. At the regional scale O(100-1 000 km of coastline), a threshold-based decision tree model categorises the predicted extent, location, and severity of erosion and flooding. At a more local scale O(100-1 000 m), physics-based modeling using XBeach focuses on vulnerable or high-value locations, providing specific storm hazard indicators tailored to local needs. This twotier approach is feasible for national implementation due to the reduced computational effort, limiting intensive modeling to pre-identified critical locations. Delft-FEWS manages the data and modeling workflow, ensuring scalability and compatibility with existing forecast infrastructure. Initial evaluations of the system are promising, with a detailed 2-year evaluation in progress. Future enhancements could include the use of satellite imagery for real-time beach width and dune topography assimilation and exploring alternative modeling approaches to further improve forecast accuracy.
Reliable predictions of shoreline evolution at a range of time scales both now and by end of the century are required for assessing coastal vulnerability in a changing climate. This is particularly important given the possible changes in regional wave climates and/or ocean water levels due to climate variability. To this end, much work has gone into the development of simple and efficient semi-empirical shoreline models that can be used to predict shoreline evolution over time scales ranging from seasonal to multi-decadal. An alternative is to use time-varying model parameters to improve model predictability at interannual timescales. Kalman filter techniques offer a framework to detect time-varying (or non-stationary) model parameters by adjusting them as shoreline observations become available. Ibaceta et al. (2020) implemented a dual state parameter Ensemble Kalman Filter (EnKF) within the shoreline evolution model ShoreFor (Davidson et al., 2013), and showed that this methodology is suitable to detect parameter changes that best hindcasted observed shoreline evolution. Additionally, they demonstrated that this observed parameter non-stationarity could be linked to the changing characteristics of the underlying wave forcing. The application of this methodology over long-term datasets now enables the parametrization and physical interpretation of the model parameters as a function of the multi-year variability in wave forcing, allowing for enhanced shoreline predictions out of the selected training period.
Shoreline variability at embayed beaches can be characterized into modes where either longshore or cross-shore sediment transport processes dominate the overall shoreline response, or there is a mixed combination of the two. To-date it has been assumed that the relative dominance of these differing modes of longshore and/or cross-shore shoreline behaviour is stationary in time. This concept is tested using a unique 43-year dataset of shoreline positions at Narrabeen-Collaroy beach (southeast Australia) and a rolling five-year window Empirical Orthogonal Function analysis, revealing the new observation of a distinct interannual variability in the dominant cross-shore and longshore modes of shoreline behaviour at this site. The dominant mode of shoreline behaviour was found to range from time periods when the cross-shore mode (referred to as the cross-shore coherent mode) comprised as much as 74 % of the overall shoreline variability, contrasting to other time periods when the alongshore mode of shoreline behaviour (longshore coherent mode) was more dominant, accounting for up to 62 % of the observed shoreline variability. Wave forcing correlation analysis suggests that these modes are controlled by varying influences of wave intensity and wave direction at interannual time scales. Consistent with previous research at this same embayment, the cross-shore coherent mode of shoreline variability appears to be controlled primarily by wave height/intensity, with stronger controls (i.e., higher correlation) when this cross-shore mode was overwhelmingly dominant. In contrast, the contribution of the longshore coherent mode appears to be controlled primarily by wave direction, but also at certain unique times in the time series by wave intensity. Analysis using available topographic and bathymetric data suggests that the observed switch in longshore versus cross-shore dominance may be triggered by extreme storm events, which cause significant and near 'instantaneous' redistribution of sediment across the entire shoreface and beach face. These results highlight the importance of considering a non-stationary shoreline behaviour at embayed beaches and the association of differing modes of dominant shoreline behaviour with interannual wave climate variability. Given observed interannual variability in deep water wave climates more broadly, it is likely that the dominant modes of shoreline variability may also occur at other embayed beaches and should be considered for numerical modelling (and prediction) of future shoreline behaviour.
Coastal storms pose a threat to livelihoods and assets along Australia’s coastlines. By delivering timely information about approaching coastal storms, early warning systems (EWSs) can enhance community preparedness and inform risk-reduction measures, with the goal of reducing potential impacts to property, critical infrastructure, and loss of life. Worldwide, existing coastal hazard EWSs primarily center around the forecasting of coastal flooding risks, which predominantly occur along surge-dominated coastlines. However, many of Australia’s densely populated coastlines are wavedominated, where erosion hazards feature more prominently. This pilot project has developed a multiscale, coastal hazard EWS capability for Australia that uses state-of-the-art scientific methods for predicting both erosion and flooding impacts caused by coastal storms.
Almar and colleagues (2023) are correct in stating that, “understanding and predicting shoreline evolution is of great importance for coastal management.” Amongst the different timescales of shoreline change, the interannual and decadal timescales are of particular interest to coastal scientists as they reflect the integrated system response to the Earth’s climate and its natural modes of variability. Therefore, establishing the links between shoreline change and climate variability at the global scale would be a major achievement. However, we find that the work of Almar et al.1 does not achieve this goal because: (i) the satellite-based method does not meet the current standards of practice and produces inaccurate results, (ii) the spatial coverage of the shoreline dataset is not adequate for a global analysis, (iii) the relevance of the statistical analyses between the shoreline data and independent variables is questionable, and (iv) the findings do not capture physical patterns of shorelines developed from field-based observations.
The beach face is the most seaward region of the dry beach. This region is the primary interface between land and ocean, and therefore has a great influence on coastal processes such as the exchange of sediment between land and sea or the reflection of wave energy at the shoreline. In particular, the slope of the beach-face, is an important parameter in coastal engineering to calculate the vertical and horizontal excursion of wave run-up (Stockdon et al., 2006). Yet, despite the importance of the beach-face slope parameter in many formulations used by coastal engineers, this quantity remains poorly mapped along the world’s sandy coastlines and the absence of large-scale datasets of beach-face slope is presently limiting our ability to deploy coastal inundation forecasting systems (O’Grady et al., 2019). This work describes a novel methodology to estimate beach-face slopes with satellite remote sensing and presents large-scale datasets of beach-face slopes along open-coast sandy coastlines around the Pacific Rim.
Australia’s national wave data network presently consists of around 35 directional wave buoys distributed across the Australian coastline, with 11 of these buoys have been in operation since the mid-seventies. South Africa is home to 4 offshore wave buoys which have operating since the early eighties. New Zealand wave buoy network is relatively younger, with 3 wave buoys in operation since the early 2000s. All of these buoys have been providing invaluable longterm historical wave data which have allowed the offshore and coastal scientific community to better assess extreme wave climates and their impact on the coastline. Additionally, these data records of wave observations are key for model validation and to better understand the effects of climate change on the local and regional wave climate.
 Ian Turner合作论文数Coastal Engineering at the Water Research Laboratory, School of Civil & Environmental Engineering, Faculty of Engineering, The University of New South Wales;NSW Department of Planning and Environment86
 Kristen Dena Marie Splinter合作论文数School of Civil & Environmental Engineering, Faculty of Engineering, The University of New South Wales74
 Kilian Vos合作论文数Water Res Lab, UNSW Sydney20
 Joshua A. Simmons合作论文数Water Res Lab, UNSW Sydney19
 Michael A. Kinsela合作论文数Office of Environment and Heritage19
 Andrew Short合作论文数Faculty of Science, The University of Sydney19
 Paolo Ciavola合作论文数Dipartimento di Scienze della Terra, Univ. Ferrara11
 Matthew Phillips合作论文数10
 Raimundo Ibaceta合作论文数Water Res Lab, UNSW9
 David John Hanslow合作论文数NSW Dept. of Land and Water Conserv., New South Wales Department of Land and Water Conservation9
 Clara Armaroli合作论文数Dipartimento di Scienze della Terra, University of Ferrara9
 Roshanka Ranasinghe合作论文数Department of Natural Resources9
 Tomas Beuzen合作论文数Data Sci Program, Univ British Columbia7
 Ryan J. Lowe合作论文数School of Earth and Environment, University of Western Australia7
 Jeff E. Hansen合作论文数Pacific Coastal and Marine Science Center, University of California,7
 Mandi Thran合作论文数Water Res Lab, UNSW Sydney6
 Nashwan Matheen合作论文数Water Res Lab, UNSW Sydney6Stefan Zieger合作论文数6
 Karin R. Bryan合作论文数Department of Earth and Ocean Sciences, University of Waikato6
 Lucy Marshall合作论文数School of Civil & Environmental Engineering, Faculty of Engineering, The University of New South Wales6
 Diana J. M. Greenslade合作论文数Research Program, Bureau of Meteorology, Melbourne, Australia6
 Sean Vitousek合作论文数Department of Geology and Geophysics6
 Christopher Leaman合作论文数5
 Bruno Castelle合作论文数UMR EPOC 5805, Université de Bordeaux5
 Michael Cuttler合作论文数Oceans Graduate School, University of Western Australia4
 Chris Blenkinsopp合作论文数Department of Architecture & Civil Engineering, Faculty of Engineering and Design, University of Bath;Centre for Climate Adaptation & Environment Research, Faculty of Engineering and Design, University of Bath4Amaia Ruiz De Alegria-Arzaburu合作论文数4
 Giovanni Coco合作论文数School of Environment, Faculty of Science, The University of Auckland4
 Gerd Masselink合作论文数School of Biological and Marine Sciences, Faculty of Science and Engineering, University of Plymouth4Ron J. Cox合作论文数3
 D. Heathfield合作论文数Hakai Inst3
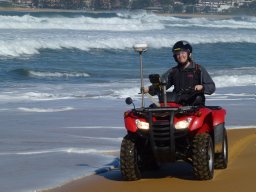 melissa a bracs合作论文数Water Res Lab, Univ New S Wales3
 Nieves G. Valiente合作论文数Coastal Processes Res Grp, Univ Plymouth3
 Thomas Edmund Fellowes合作论文数Department of Earth and Environmental Sciences, Macquarie University3
 Arthur Robinet合作论文数Bur Rech Geol & Minieres3
 Masayuki Banno合作论文数Port & Airport Res Inst, Natl Inst Maritime Port & Aviat Technol3
 Ana Vila Concejo合作论文数School of Geosciences, Faculty of Science, The University of Sydney3
 Ian Goodwin合作论文数Marine Climate Risk Group and Department of Environment and Geography, Macquarie University3Jason H. Middleton合作论文数Scripps Institution of Oceanography, La Jolla, CA 92093, U.S.A.3
 Idier Déborah合作论文数Direction Risques et Prévention, Geological and Mining Research Bureau3
 Shari L Gallop合作论文数3
 Tim Scott合作论文数3
 Peter Ruggiero合作论文数Department of Ecology3
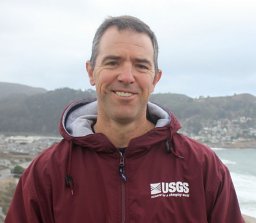 Patrick L. Barnard合作论文数United States Geological Survey, Pacific Science Center3Margaret L. Palmsten合作论文数College of Oceanic and Atmospheric Sciences, Oregon State University Corvallis3Ron Cox合作论文数2Steve Buchan合作论文数2Craig Earl-Spurr合作论文数2Greg Williams合作论文数2




