iii Over two decades, rapid advances in new and maturing geodetic technologies have supported the interrogation of the kinematics, structure, and dynamics of the solid Earth and its fluid envelopes. The quickening pace of technological change has fueled major new interdisciplinary research opportunities, even in the last few years. With the continued development of advanced terrestrial and space geodetic methods, geodesy has grown rapidly and there are now crucial geodetic applications in a wide range of scientific fields, from ground water systems and fault dynamics to mapping the speed of ice flows and the amount of water vapor in the atmosphere. Widespread recognition that technology-driven science is a national asset in a global economy has further strengthened public investment in exploring these phenomena and their relevance to society. During October 2009, seventy-six scientists met to articulate new and emerging research opportunities in geodesy and its interdisciplinary applications. The meeting was followed by community comment on the results of the workshop. This report summarizes that work and identifies the key areas where additional research is needed to further our understanding of dynamic systems within the solid Earth, atmosphere, cryosphere, and hydrosphere. Initial drafts of this report were publicly available and commented on by the geodetic community. Geodesy is the science of observing and understanding Earth's time-varying shape, gravity field, and rotation. Over the last three decades, emerging observing technologies have revolutionized geodesy. The creation of new and often satellite-based data acquisition systems has generated large, diverse, and rich data sets that must be set in a coordinated framework for analysis. The development and improvement of mathematical models and data analysis techniques required for extracting information from the geodetic observables in turn supports investigation, quantification, and refinement of accuracy. Geodetic observations are used then to investigate the Earth's structure and surface mass distribution, its response to internal and external forcing, and the interaction among its various systems. Over several decades, the unprecedented accuracy, spatial and temporal coverage, and integration achieved by geodetic observing systems has led to an explosion in the number and scope of Earth science fields that are advanced through geodesy. Throughout this document are many examples of the ways in which geodesy is utilized to achieve these advances. This report uses the terms " geodetic science " and " geodetic applications " to distinguish the science behind geodetic techniques from the geophysical investigations that benefit from that science. The …
Starting early in 2005, the positions of GPS stations in the San Gabriel valley region of southern California showed statistically significant departures from their previous behavior. Station LONG moved up by about 47 mm, and nearby stations moved away from LONG by about 10 mm. These changes began during an extremely rainy season in southern California and coincided with a 16‐m increase in water level at a nearby well in Baldwin Park and a regional uplift detected by interferometric synthetic aperture radar. No equivalent signals were seen in GPS station position time series elsewhere in southern California. Our preferred explanation, supported by the timing and by a hydrologic simulation, is deformation due to recharging of aquifers after near‐record rainfall in 2004–2005. We cannot rule out an aseismic slip event, but we consider such an event unlikely because it requires slip on multiple faults and predicts other signals that are not observed.
The M_w 7.1 Hector Mine, California, earthquake occurred at 9:46 GMT on 16 October 1999. The event caused minimal damage because it was located in a remote, sparsely populated part of the Mojave Desert, approximately 47 miles east-southeast of Barstow, with epicentral coordinates 34.59°N 116.27°W and a hypocentral depth of 5 ± 3 km. Twelve foreshocks, M 1.9-3.8, preceded the mainshock during the previous twelve hours. All of these events were located close to the hypocenter of the mainshock.
Agencies responsible for dam safety have long used conventional surveying methods to measure the displacements of benchmarks as part of dam monitoring programs. Such surveys have provided infrequent though precise estimates of a dam’s motions. With the development of high precision GPS methods to monitor plate tectonic motions and crustal deformation rates, an alternative method for monitoring such structural motions became available. While high- precision GPS approaches the horizontal positioning capability of conventional surveying methods, its great benefit lies in a much higher temporal resolution and nearly unattended continuous operation. In September 1995, Pacoima Dam, located in the San Gabriel Mountains north of Los Angeles, California, was instrumented with a triad of continuously operating GPS receivers to test the feasibility of applying these techniques to the field of structural monitoring. Nearly three years of data have been analyzed from this sub-array to provide quarter-daily estimates of station-to-station baseline lengths. Quantitative methods were assessed to allow the identification of a number of outlying data points that could be misinterpreted as GPS station motion in a real-time system. Examination of the derived baseline time series indicates that Pacoima Dam is experiencing an annual cycle of upstream-downstream (E-W) motion at the center of the dam arch of approximately 15-18 mm peak-to-peak amplitude. Comparison of motion to daily regional temperature records strongly indicates that the dam responds to annual and shorter-period ambient temperature variations. Spectral methods are used to model this relationship to allow a more accurate estimation of the thermoplastic behavior of the structure.
We compare recent measurements of polar motion (wobble) made by space‐geodetic methods with older optical measurements. Multitaper spectra of these data show that the retrograde (clockwise) annual wobble is much larger in the older data than the newer data, implying systematic errors in the older techniques. Two additional analyses show evidence for a small retrograde motion in the newer data, which appears to be consistent between data types. This implies that the excitation of the retrograde wobble must be about half of the prograde excitation. None of the available estimates of the excitation shows full agreement with these observations.
 J. C. Savage合作论文数11John Langbein合作论文数United States Geological Survey10Mike Lisowski合作论文数10
 Kenneth W. Hudnut合作论文数US Geol Survey10William H. Prescott合作论文数8Ken Hurst合作论文数3
 Jeffrey Freymueller合作论文数Department of Earth and Environmental Sciences, College of Natural Science, Michigan State University3W. K. Gross合作论文数3
 Yehuda Bock合作论文数Scripps Orbit and Permanent Array Center, University of California, San Diego;Institute of Geophysics and Planetary Physics, Scripps Institution of Oceanography, University of California, San Diego3linette miriawati prawirodirdjo合作论文数3
 Adrian Borsa合作论文数Scripps Institution of Oceanography, University of California, San Diego2
 Michael P Poland合作论文数Hawaiian Volcano Observ, Hawaii Natl Pk2
 Paul Segall合作论文数Department of Geophysics, School of Sustainability, Stanford University2
 Michael Heflin合作论文数NASA Jet Propulsion Laboratory2Evelyn Roeloffs合作论文数United States Geological Survey2
 Peter Cervelli合作论文数Volcano Science Center, US Geological Survey2
 Devin Lynn Galloway合作论文数Ohio-Kentucky-Indiana Water Science Center, U.S. Geological Survey2Jerry L. Svarc合作论文数U. S. Geological Survey2b j newport合作论文数1A. Shakal合作论文数1G. Ennis合作论文数1D.D. Given合作论文数1M.E. Ikehara合作论文数1J. M. Sutton合作论文数1C. H. Stiffler合作论文数1K. F. Stark合作论文数1J. E. Galetzka合作论文数1Michelle Sneed合作论文数1Wh Prescott合作论文数1X. Ge合作论文数1fang peng合作论文数1
 Paul Hsieh合作论文数U.S. Geological Survey1
 Aron Jeffrey Meltzner合作论文数Asian School of the Environment, Nanyang Technological University1
 Lupei Zhu (朱露培)合作论文数Department of Earth and Atmospheric Sciences, School of Science and Engineering, Saint Louis University1
 Rowena B. Lohman合作论文数Earth and Atmospheric Sciences, College of Engineering, Cornell University1
 Steven Forman合作论文数Department of Geosciences, Baylor University1
 Kevin M. Kelly合作论文数Department of Biomedical Engineering,Carnegie Mellon University1
 Duncan Agnew合作论文数Scripps Institution of Oceanography, University of California, San Diego;Institute of Geophysics and Planetary Physics, University of California, San Diego1
 William Holt合作论文数Department of Geosciences, Stony Brook University1David D Jackson合作论文数Department of Earth and Space Sciences, UCLA1
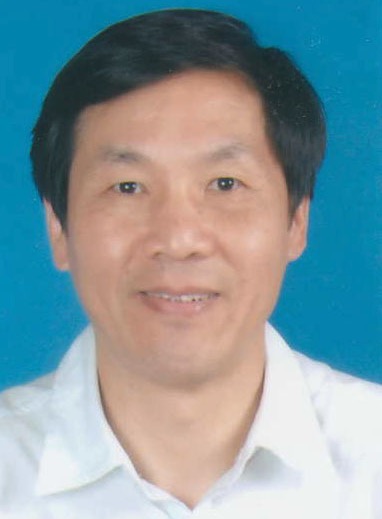 Zhengkang Shen (沈正康)合作论文数Institute of Earthquake Prediction, China Earthquake Administration;Department of Earth, Planetary, and Space Sciences, University of California, Los Angeles1
 Jim Davis合作论文数Lamont-Doherty Earth Observatory, Division of Seismology, Geology, and Tectonophysics, Columbia University1
 Thomas Crowley合作论文数School of Geosciences, University of Edinburgh1Metzger Loren F合作论文数1
 Michael Bevis合作论文数School of Earth Sciences, College of Arts and Sciences, The Ohio State University1Yan Feng合作论文数1M.D. Wood合作论文数1Zhen Liu合作论文数1
 Meinrat O. Andreae合作论文数Department of Biogeochemistry, Max Planck Institute for Chemistry1




