With the rise of deep learning (DL), machine learning (ML) has become compute and data intensive, typically requiring multi-node multi-GPU clusters. As state-of-the-art models grow in size in the order of trillions of parameters, their computational complexity and cost also increase rapidly. Since 2012, the cost of deep learning doubled roughly every quarter, and this trend is likely to continue. ML practitioners have to cope with common challenges of efficient resource utilization when training such large models. In this paper, we propose a new profiling tool that cross-correlates relevant system utilization metrics and framework operations. The tool supports profiling DL models at scale, identifies performance bottlenecks, and provides insights with recommendations. We deployed the profiling functionality as an add-on to Amazon SageMaker Debugger, a fully-managed service that leverages an on-the-fly analysis system (called rules) to automatically identify complex issues in DL training jobs. By presenting deployment results and customer case studies, we show that it enables users to identify and fix issues caused by inefficient hardware resource usage, thereby reducing training time and cost.
Deep neural networks (DNNs) are known to be highly vulnerable to adversarial examples (AEs) that include malicious perturbations. Assumptions about the statistical differences between natural and adversarial inputs are commonplace in many detection techniques. As a best practice, AE detectors are evaluated against ’adaptive’ attackers who actively perturb their inputs to avoid detection. Due to the difficulties in designing adaptive attacks, however, recent work suggests that most detectors have incomplete evaluation. We aim to fill this gap by designing a generic adaptive attack against detectors: the ’statistical indistinguishability attack’ (SIA). SIA optimizes a novel objective to craft adversarial examples (AEs) that follow the same distribution as the natural inputs with respect to DNN representations. Our objective targets all DNN layers simultaneously as we show that AEs being indistinguishable at one layer might fail to be so at other layers. SIA is formulated around evading distributional detectors that inspect a set of AEs as a whole and is also effective against four individual AE detectors, two dataset shift detectors, and an out-of-distribution sample detector, curated from published works. This suggests that SIA can be a reliable tool for evaluating the security of a range of detectors.
Manual debugging is a common productivity drain in the machine learning (ML) lifecycle. Identifying underperforming training jobs requires constant developer attention and deep domain expertise. As state-of-the-art models grow in size and complexity, debugging becomes increasingly difficult. Just as unit tests boost traditional software development, an automated ML debugging library can save time and money. We present Amazon SageMaker Debugger, a machine learning feature that automatically identifies and stops underperforming training jobs. Debugger is a new feature of Amazon SageMaker that automatically captures relevant data during training and evaluation and presents it for online and offline inspection. Debugger helps users define a set of conditions, in the form of built-in or custom rules, that are applied to this data, thereby enabling users to catch training issues as well as monitor and debug ML model training in real-time. These rules save time and money by alerting the developer and terminating a problematic training job early.
We typically compute aggregate statistics on held-out test data to assess the generalization of machine learning models. However, statistics on test data often overstate model generalization, and thus, the performance of deployed machine learning models can be variable and untrustworthy. Motivated by these concerns, we develop methods to automatically discover and correct model errors beyond those available in the data. We propose Defuse, a method that generates novel model misclassifications, categorizes these errors into high-level model bugs, and efficiently labels and fine-tunes on the errors to correct them. To generate misclassified data, we propose an algorithm inspired by adversarial machine learning techniques that uses a generative model to find naturally occurring instances misclassified by a model. Further, we observe that the generative models have regions in their latent space with higher concentrations of misclassifications. We call these regions misclassification regions and find they have several useful properties. Each region contains a specific type of model bug; for instance, a misclassification region for an MNIST classifier contains a style of skinny 6 that the model mistakes as a 1. We can also assign a single label to each region, facilitating low-cost labeling. We propose a method to learn the misclassification regions and use this insight to both categorize errors and correct them. In practice, Defuse finds and corrects novel errors in classifiers. For example, Defuse shows that a high-performance traffic sign classifier mistakes certain 50km/h signs as 80km/h. Defuse corrects the error after fine-tuning while maintaining generalization on the test set.
With the greater proliferation of machine learning models, the imperative of diagnosing and correcting bugs in models has become increasingly clear. As a route to better discover and fix model bugs, we propose failure scenarios: regions on the data manifold that are incorrectly classified by a model. We propose an end-to-end debugging framework called Defuse to use these regions for fixing faulty classifier predictions. The Defuse framework works in three steps. First, Defuse identifies many unrestricted adversarial examples--naturally occurring instances that are misclassified--using a generative model. Next, the procedure distills the misclassified data using clustering into failure scenarios. Last, the method corrects model behavior on the distilled scenarios through an optimization based approach. We illustrate the utility of our framework on a variety of image data sets. We find that Defuse identifies and resolves concerning predictions while maintaining model generalization.
In the past few years the increased luminosity of the LHC, changes in the linux kernel and a move to a 64bit architecture have affected the ATLAS jobs memory usage and the ATLAS workload management system had to be adapted to be more flexible and pass memory parameters to the batch systems, which in the past wasn’t a necessity. This paper describes the steps required to add the capability to better handle memory requirements, included the review of how each component definition and parametrization of the memory is mapped to the other components, and what changes had to be applied to make the submission chain work. These changes go from the definition of tasks and the way tasks memory requirements are set using scout jobs, through the new memory tool developed to do that, to how these values are used by the submission component of the system and how the jobs are treated by the sites through the CEs, batch systems and ultimately the kernel.
HEP applications perform an excessive amount of allocations/deallocations within short time intervals which results in memory churn, poor locality and performance degradation. These issues are already known for a decade, but due to the complexity of software frameworks and billions of allocations for a single job, up until recently no efficient mechanism has been available to correlate these issues with source code lines. However, with the advent of the Big Data era, many tools and platforms are now available to do large scale memory profiling. This paper presents, a prototype program developed to track and identify each single (de-)allocation. The CERN IT Hadoop cluster is used to compute memory key metrics, like locality, variation, lifetime and density of allocations. The prototype further provides a web based visualization back-end that allows the user to explore the results generated on the Hadoop cluster. Plotting these metrics for every single allocation over time gives a new insight into application's memory handling. For instance, it shows which algorithms cause which kind of memory allocation patterns, which function flow causes how many short-lived objects, what are the most commonly allocated sizes etc. The paper will give an insight into the prototype and will show profiling examples for the LHC reconstruction, digitization and simulation jobs.
The main goal of a Workload Management System (WMS) is to find and allocate resources for the given tasks. The more and better job information the WMS receives, the easier will be to accomplish its task, which directly translates into higher utilization of resources. Traditionally, the information associated with each job, like expected runtime, is defined beforehand by the Production Manager in best case and fixed arbitrary values by default. In the case of LHCb's Workload Management System no mechanisms are provided which automate the estimation of job requirements. As a result, much more CPU time is normally requested than actually needed. Particularly, in the context of multicore jobs this presents a major problem, since single- and multicore jobs shall share the same resources. Consequently, grid sites need to rely on estimations given by the VOs in order to not decrease the utilization of their worker nodes when making multicore job slots available. The main reason for going to multicore jobs is the reduction of the overall memory footprint. Therefore, it also needs to be studied how memory consumption of jobs can be estimated. A detailed workload analysis of past LHCb jobs is presented. It includes a study of job features and their correlation with runtime and memory consumption. Following the features, a supervised learning algorithm is developed based on a history based prediction. The aim is to learn over time how jobs’ runtime and memory evolve influenced due to changes in experiment conditions and software versions. It will be shown that estimation can be notably improved if experiment conditions are taken into account.
We are deeply touched by the sudden loss of our dear friend and colleague Till Moritz Karbach. With this memorial book we wish to commemorate Moritz’ scientific legacy, and what Moritz meant to us as a friend.
Article history: Received 24 March 2015 Received in revised form 12 June 2015 Accepted 16 June 2015 Available online 17 June 2015 Editor: M. Doser The decay Bs → ψ(2S)K +π− is observed using a data set corresponding to an integrated luminosity of 3.0 fb−1 collected by the LHCb experiment in pp collisions at centre-of-mass energies of 7 and 8 TeV. The branching fraction relative to the B0 → ψ(2S)K +π− decay mode is measured to be B(Bs → ψ(2S)K +π−) B(B0 → ψ(2S)K +π−) = 5.38 ± 0.36 (stat) ± 0.22 (syst) ± 0.31 ( f s/ fd)%,
This contribution describes how Cloud resources have been integrated in the LHCb Distributed Computing. LHCb is using its specific Dirac extension (LHCbDirac) as an interware for its Distributed Computing. So far, it was seamlessly integrating Grid resources and Computer clusters. The cloud extension of DIRAC (VMDIRAC) allows the integration of Cloud computing infrastructures. It is able to interact with multiple types of infrastructures in commercial and institutional clouds, supported by multiple interfaces (Amazon EC2, OpenNebula, OpenStack and CloudStack) - instantiates, monitors and manages Virtual Machines running on this aggregation of Cloud resources. Moreover, specifications for institutional Cloud resources proposed by Worldwide LHC Computing Grid (WLCG), mainly by the High Energy Physics Unix Information Exchange (HEPiX) group, have been taken into account. Several initiatives and computing resource providers in the eScience environment have already deployed IaaS in production during 2013. Keeping this on mind, pros and cons of a cloud based infrasctructure have been studied in contrast with the current setup. As a result, this work addresses four different use cases which represent a major improvement on several levels of our infrastructure. We describe the solution implemented by LHCb for the contextualisation of the VMs based on the idea of Cloud Site. We report on operational experience of using in production several institutional Cloud resources that are thus becoming integral part of the LHCb Distributed Computing resources. Furthermore, we describe as well the gradual migration of our Service Infrastructure towards a fully distributed architecture following the Service as a Service (SaaS) model.
Citation for published version: Aaij, R, Adeva, B, Adinolfi, M, Affolder, A, Ajaltouni, Z, Albrecht, J, Alessio, F, Alexander, M, Ali, S, Alkhazov, G, Alvarez Cartelle, P, Alves, AA, Amato, S, Amerio, S, Amhis, Y, Anderlini, L, Anderson, J, Andreassen, R, Andreotti, M, Andrews, JE, Appleby, RB, Gutierrez, OA, Archilli, F, Artamonov, A, Artuso, M, Aslanides, E, Auriemma, G, Baalouch, M, Bachmann, S, Back, JJ, Badalov, A, Balagura, V, Baldini, W, Barlow, RJ, Barschel, C, Barsuk, S, Barter, W, Batozskaya, V, Bauer, T, Bay, A, Beddow, J, Carson, L, Clarke, PEL, Cowan, GA, Craik, D, Eisenhardt, S, Gambetta, S, Muheim, F, Needham, M, Playfer, S & LHCb Collaboration 2014, 'Precision measurement of the ratio of the Lambda(0)(b) to (B)over-bar(0) lifetimes', Physics Letters B, vol. 734, Aaij:2014zyy, pp. 122-130. https://doi.org/10.1016/j.physletb.2014.05.021
Nowadays, the Worldwide LHC Computing Grid mainly consists of multi- and manycore processors. The thesis investigates how such resources can be used more efficiently at the example of the LHCb experiment. It analyses how to improve software in terms of memory requirements and concurrency. The research involves the implementation of a moldable job scheduler and a supervised learning algorithm which helps to better predict LHCb workloads.
HEP applications need to adapt to the continuously increasing number of cores on modern CPUs. This must be done at different levels: the software must support parallelization, and the scheduling has to differ between multicore and singlecore jobs. The LHCb software framework (GAUDI) provides a parallel prototype (GaudiMP), based on the multiprocessing approach. It allows a reduction of the overall memory footprint and a coordinated access to data via separated reader and writer processes. A comparison between the parallel prototype and multiple independent Gaudi jobs in respect of CPU time and memory consumption will be shown. Furthermore, speedup must be predicted in order to find the limit beyond which the parallel prototype (GaudiMP) does not bring further scaling. This number must be known as it indicates the point, where new technologies must be introduced into the software framework. In order to reach further improvements in the overall throughput, scheduling strategies for mixing parallel jobs can be applied. It allows overcoming limitations in the speedup of the parallel prototype. Those changes require modifications at the level of the Workload Management System (DIRAC).
A study of χb meson production at LHCb is performed on proton–proton collision data, corresponding to 3.0 fb−1of integrated luminosity collected at centre-ofmass energies √ s = 7 and 8 TeV. The fraction of Υ(nS) mesons originating from χb decays is measured as a function of the Υ transverse momentum in the rapidity range 2.0 < y < 4.5. The radiative transition of the χb (3P) meson to Υ(3S) is observed for the first time. The χb1 (3P) mass is determined to be mχb1 (3P) = 10 511.3 ± 1.7 ± 2.5 MeV/c2, where the first uncertainty is statistical and the second is systematic.
 Alessandro Petrolini合作论文数Dipartimento Di Fisica, Università degli Studi di Genova;Istituto Nazionale di Fisica Nucleare20
 Thomas Nikodem合作论文数PTV Group20
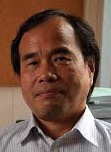 Tatsuya Nakada合作论文数High Energy Physics Laboratory, Institute of Physics, School of Basic Sciences, Ecole polytechnique fédérale de Lausanne20
 M. Patel合作论文数20O. Okhrimenko合作论文数20
 Valentin Niess合作论文数Laboratoire de Physique de Clermont Auvergne, Institut National De Physique Nucléaire Et De Physique Des Particules, CNRS;Université Clermont Auvergne20
 V. Pugatch合作论文数IJCLab, Univ Paris Saclay20
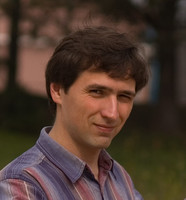 Anton Poluektov合作论文数Centre National De La Recherche Scientifique;Center for Particle Physics of Marseille, Aix-Marseille University20
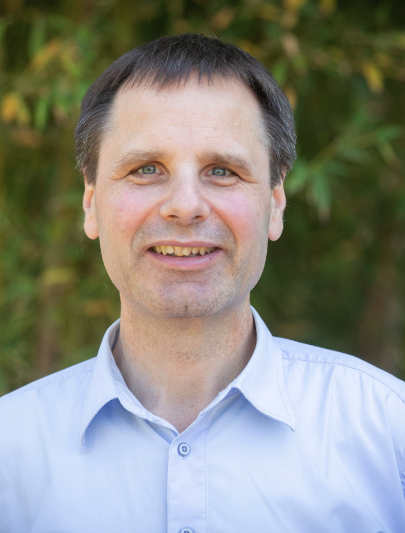 Gerhard Raven合作论文数Faculty of Science, Vrije Universiteit Amsterdam;Nikhef;CERN;SLAC National Accelerator Laboratory20Matthew Needham合作论文数Institute for Particle and Nuclear Physics, School of Physics and Astronomy, The University of Edinburgh20S. Ricciardi合作论文数20Antonio Romero Vidal合作论文数Department of Particle Physics, Universidade de Santiago de Compostela20
 Jonas Rademacker合作论文数School of Physics, University of Bristol20
 Antimo Palano合作论文数University of Bari20M. Pappagallo合作论文数20
 Raja Nandakumar合作论文数Rutherford Appleton Laboratory20J. Panman合作论文数20
 Clara Matteuzzi合作论文数Istituto Nazionale di Fisica Nucleare;University of Milan20
 Patrick Owen合作论文数Physik-Institut, Universität Zürich20Giovanni Passaleva合作论文数20
 Rudolf Gerhard Christiaan Oldeman合作论文数Dipartimento di Fisica, Università di Cagliari20
 A. (Antonio) Pellegrino合作论文数Faculty of Science and Engineering, University of Groningen20Stefano Perazzini合作论文数Istituto Nazionale di Fisica Nucleare Sezione di Bologna20J. Prisciandaro合作论文数20
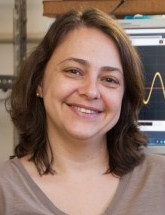 Erica Polycarpo合作论文数Instituto de Física, Universidade Federal do Rio de Janeiro20
 Eduardo Rocha Rodrigues合作论文数IBM Research20B. Pietrzyk合作论文数Laboratoire de Physique des Particules (LAPP),, IN2P3-CNRS20Patrick Robbe合作论文数Laboratoire de l’Accélérateur Linéaire, CNRS20
 Davide Pinci合作论文数Istituto Nazionale di Fisica Nucleare, Sezione di Roma20D. Martinez Santos合作论文数20C. Patrignani合作论文数19B. Muster合作论文数19T. Pilař合作论文数19Pascal Perret合作论文数Laboratoire de Physique de Clermont Auvergne, Universite Blaise Pascal;CNRS19J. M. Otalora Goicochea合作论文数19S. Monteil合作论文数19Vasily Kudryavtsev合作论文数Budker Institute of Nuclear Physics;Novosibirsk State University19A. Novoselov合作论文数19
 Katharina Kreplin合作论文数SAP19P. Rodriguez Perez合作论文数19E. Picatoste Olloqui合作论文数19
 Paras Naik合作论文数Department of Physics, School of Physical Sciences, Faculty of Science and Engineering, University of Liverpool;University of Bristol19
 Giulia Manca合作论文数University of Cagliari19
 Tadeusz Lesiak合作论文数The Henryk Niewodniczański Institute of Nuclear Physics, Polish Academy of Sciences;Cracow University of Technology19
 Franz Muheim合作论文数Institute for Particle and Nuclear Physics, School of Physics and Astronomy, The University of Edinburgh19
 Murilo Santana Rangel合作论文数Instituto de Física, Universidade Federal do Rio de Janeiro19M. Meissner合作论文数19J. Molina Rodriguez合作论文数19
 Olga Kochebina合作论文数CEA19




