Urban heat islands in Mediterranean coastal cities have become an increasing concern, as climate changes in these regions exacerbate heat stress and other environmental challenges. The aim of this study was to investigate the intensity and temporal dynamics of urban heat island in the Tel Aviv Metropolis during the summer and winter months, nighttime and daytime, using an integrative approach combines local climate zone classifications, remote sensing, and meteorological data. The findings indicate daily and seasonal variations in both canopy urban heat islands and surface urban heat islands across the examined metropolis. In summer, the surface urban heat island was most pronounced at midday, whereas in winter it peaked at night. From a spatial aspect, its focus was found to shift eastward during the daytime and westward during the nighttime – regardless of season. The most notable finding is that the daily canopy urban heat islands in the Tel Aviv Metropolis were more pronounced during the summer (up to 4 °C) than in the winter (up to 2 °C), while the canopy nocturnal heat islands were more pronounced during the winter (up to 9 °C) than during the summer (up to 4 °C). Using the local climate zone (LCZ) classification, spatial analysis conducted in this study identified industrial areas (LCZ 8) and compact mid-rise residential ones (LCZ2) as the hottest, whereas open and vegetated areas were found to mitigate urban heating. These insights contribute to our understanding of urban heat dynamics in Mediterranean coastal contexts, supporting more sustainable planning strategies in these urban environments.
In recent years, the concept of urban ‘walkability’ has become common in multiple fields connected to urban geography, urban planning, and has both social and environmental benefits. In the last decade urban climatology research has paid more attention to the effect of urban outdoor thermal conditions on walkability. Walkability can be defined as the extent to which the built environment enables, supports and encourages walking, by providing pedestrians on the move friendly and safety environment, visual interest in street network’ and thermal comfort This study examined the relations between outdoor thermal conditions and walkability in the Mediterranean City of Tel Aviv, aiming to: (1) assess the relationship between urban morphology at street level on the objective and subjective thermal comfort of pedestrians on the move, (2) quantify the influence of land use and centrality of streets on pedestrians' thermal perception, and (3) evaluate the seasonal and hourly effect of thermal comfort on pedestrian volume.Field campaigns were conducted in summer and winter, in six different types of streets including micro-climatic measurements, pedestrian observation and counting, and a bio-meteorology questionnaire survey.The results showed that the effect of thermal comfort is more pronounced in summer than winter thus during summer less pedestrian volume was observed during the hottest hours of the day. The pedestrian volume in winter is much higher than in summer. In commercial streets, the relation between thermal perception and pedestrian volume is weak, compared to noncommercial streets. During the summer the pedestrian volume in boulevards and shaded streets is higher compared to exposed streets.The findings indicate that thermal conditions affect pedestrian volume, but this is dependent upon the street network structure and type of land use.
This study examined the long-term thermal perception and adaptation to a hot and arid climate of immigrants from cold regions as compared to native-born residents. The study was conducted in the desert city of Beer Sheva, Israel, population 220,000 inhabitants, including 50,000 immigrants from cold climates of Eastern Europe and Central Asia. Climatic measurements were made in winter and summer during 2010-2015 in various outdoor environments in the city, accompanied by questionnaire surveys including 2863 valid responses. Results showed that female immigrants were the most tolerant to the winter cold thermal conditions and their lower limit of neutral temperature was 3-4.5 & DEG;C PET lower than the other groups. During the summer, the difference in thermal sensation between genders and origins became negligible above 35 & DEG;C PET. The 90% Thermal Acceptability Range (TAR) for the winter was 13-22 & DEG;C PET for female immigrants and 17-24 & DEG;C PET for male native-born. In summer, the TAR upper limit for all groups was similar. Clothing insulation played an important role, where female immigrants usually used higher clothing insulation than natives. Immigrants from cold climatic back-grounds achieved long-term thermal adaption to the cold arid thermal conditions, and to the hot, arid climatic conditions by adapting behavioral thermal adjustment.
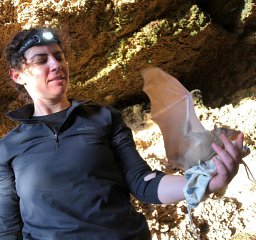
In this study, we demonstrate how urban-dwelling bats can be used to reconstruct Urban Heat Islands (UHI). We term this approach biologically-assisted sampling (BAS). We used Egyptian fruit bats to map the spatial air temperature (Tair) profile. To demonstrate the feasibility of using biologically-assisted sampled data set, we run mixed effects and Geographically Weighted Regression (GWR) models to estimate the impact of urban environment on Tair distribution. Our results suggest that vegetation is a very important mitigating factor in Tair. In the winter, we found an average Tair difference of 2-5 degrees C between densely urban and nearby vegetative/open areas. A distinct UHI spot was identified in the winter, centered on the Ayalon highway. These differences were lower during the summer night, probably due to a pronounced cooling sea breeze effect along the coastline. Our preliminary results also indicate that BAS sampling provide a 3D view of the UHI phenomenon: the change in Tair above the dense urban area was smaller than above the vegetative area. Since the differences in Tair between densely urban and open/green areas are the largest during the night hours, bats can serve as efficient agents to monitor UHI effects, despite the method limitations.
Since the early 2000's, much attention has been paid to human thermal assessment in urban outdoor environments in different climatic zones. Some previous studies have argued that an absence of an agreed protocol for outdoor human bio-meteorological research causes complexity in comparing the studies' results for several reasons: An abundance of human thermal indices, a variety of interpretations of bio-meteorological terms, an array of procedures for data collection and a lack of agreed methods in determining thermal comfort ranges and index modifications. This study aims to review strategies and methods for human bio-meteorological research and to examine their suitability for thermal perception assessment. From 2001 to 2021, 254 case studies assessed human thermal perception by investigating in-situ thermal conditions versus subjective thermal perception, relying on protocols such as ASHRAE Standard 55 and EN ISO 10551 that were originally developed for indoor environments. Fifty-four cases determined different ranges for thermal comfort. Although 43 studies tried to modify indices to various climatic zones, only 13 studies modified the nine PET physiological stress categories and 4 studies modified the ten UTCI stress categories). Thus, comparisons between the studies' results become complicated. Our review points to three main reasons for the complexity: first, the 7-point TSV scales, does not always fit the scales of the applied thermal index; second, measurement procedures do not always represent the local climate conditions; third, certain methods for modifying thermal index scale thresholds are not capable of modifying the entire index scale. On the basis of our findings, we suggest a framework for bio-meteorological research, with attention to measurement procedure, appropriate questionnaire design, careful data control and suitable methods to enable modification of thermal indices. This study recommends applying systematic and objective statistical methods like linear regression and discriminant analysis in order to successfully modify the entire index scale.
The urban heat island (UHI) phenomenon refers to urban areas that are much warmer than their rural surroundings due to the presence of high-rise buildings, industry and commercial centers with anthropogenic activity. Ground-level monitoring sites have been established to monitor UHIs and other environmental parameters. However, their spatial coverage within a given region is limited. Biological monitoring using live organisms is a promising technology to monitor UHIs, but has never, to our knowledge, been attempted. We used Egyptian fruit bats to map the spatial air temperature (Tair) profile across vegetative and built-up areas. The bats were equipped with sensors that record location and ambient temperature, translocated to ca. 5 km from their colony and released, to map spatial Tair. Two field experiments were conducted, during the winter and summer, in the greater Tel Aviv area between 2000 h and 0230 h. Despite the partial randomness of the sampling, which depended on the bats’ choice of route, our results showed that vegetation is a very important mitigating factor in Tair: the higher the vegetation coverage, the lower the Tair. Importantly, we also detected an impact of urban coverage and spatial location on Tair distribution. In the winter, we found an average Tair difference of 2–5 °C between urban dense and nearby vegetative/open areas. These differences were lower during the summer, where there was a pronounced cooling sea breeze effect along the coastline. Our results indicate the feasibility of bat biomonitoring as a complementary source of Tair data for UHI monitoring. Because the differences in Tair between urban dense and open/green areas are largest during the night hours in the Mediterranean climate zone, nocturnally active bats can serve as efficient thermal sensors to monitor UHI effects.
The katabatic winds have been studied over the slopes surrounding the Dead Sea (DS, in brevity), located at altitude of 433 m below sea level focusing on the summer season when the katabatic winds are most frequent, persistent and pronounced due to the summer stable weather conditions. The study observes the katabatic wind pulses, which are intermittent, via 3-D innovative measurement tools with high time and space resolution employing Energy Balance Stations, Radiosondes and Lidars. The nocturnal katabatic pulses were investigated employing vertical depth, wind direction/intensity, duration, number of pulses and the time intervals separating them, as well as the begin and termination times during August 2014. The average direction of the pulses depends on the nearby slopes orientations while the intensity depends on the station's elevation and its location relative to the slope. The average katabatic number of pulses, duration, time intervals and their beginning and terminating times were found to strongly depend on the other local flows. The average vertical depth of the katabatic layer from both sides of the DS, in Israel and Jordan, was found to be at 450-950 m above ground level, depending on the measurement time period as well as the tools' sensitivities employing the "KIT cube system"-an advanced integrated atmospheric observation system, which allows 3-D accurate analysis of the detailed katabatic wind pulses over the DS. The average number of the katabatic pulses was found to be similar to 2.9-3.5 pulses.night(-1). The average duration of each pulse was similar to 69-94 min and the time interval separating them similar to 32-44 min depending on the flows which interrupt the pulses. The starting time of first katabatic pulse in local time was 0113 LST (+/- 0119). These findings are of great relevance for the DS evaporation as well as bio-meteorological and pollution aspects.
Facing the impacts of climate change and urbanization, adaptation and resilience to climate extremes have become important issues of global concern [...]
• Portable monitoring associates exposure to environmental nuisances to health risk. • Multi-monitoring methods allow micro analyses of urban nuisances' distribution. • Tracing technology promote people based paradigm rather than territorial analyses.
This study aims to examine the effect of urban spatial patterns on heat exposure in the city of Tel Aviv using multiple methodologies, Local Climate Zones (LCZ), meteorological measurements, and remote sensing. A Local Climate Zone map of Tel Aviv was created using Geographic Information System (GIS), and satellite images were used to identify the spatial patterns of the urban heat island (UHI). Climatic variables were measured by fixed meteorological stations and by mobile cross-section. Surface and wall temperatures were obtained by satellite images and a hand-held infrared camera. Meteorological measurements at a height of 2 m showed that during midday the city is ~3.6 °C warmer than the surrounding rural area. The cooling effect of parks was evident only during the hot hours of the day (9:00–17:00). Land Surface Temperature in the southern part of the city was hotter by ~7–9 °C compared to the northern part due to lack of urban vegetation. Hot spots were found in compact midrise forms (LCZ 2) that are not ideal from the climatological perspective. Whereas compact low-rise forms (LCZ 3) were less heat vulnerable. The results of this study suggest that climatologists can provide planners and architects with scientific insight into the causes of and solutions for urban climatic heat exposure.
The current study examined the case of religious students who opted to study in a secular teacher-training college despite the fact that there are religious colleges that would have suited their needs. This phenomenon is unusual because the education system in Israel is segregated and each educational sector has its own teacher-training colleges. Findings of this qualitative study indicate that the majority of participants did not wish to depart from the religious framework, but rather sought to forge reciprocal relations with the secular society and carve a space for themselves where they could express their identity, which does not entirely conform to the demands of the religious society. These findings highlight an interesting dynamic that developing between students from a minority group and the mainstream secular society in Israel that promotes multiculturalism. An academic campus that adopts a multicultural approach is a safe space for minority students, whose sectorial framework does not fully provide for all their needs.
Mean radiant temperature (Tmrt) is important for human thermal comfort indexes, but is difficult to determine. Tmrt was calculated from measured temperatures of buildings and vegetation surfaces in urban scenarios along with meteorological data (temperature, relative humidity and global radiation). The method can be used for experimental work in urban settings without the use of four-flux net radiometers. Tmrt for different positions in the urban canyon can be calculated. A software package named Mr.T was developed which allows determining Tmrt from data input manually or from EXCEL spreadsheets. The software was validated in two urban settings: in Tel Aviv University and a nearby urban canyon in summer and in the old city quarter of Beer Sheva at the end of winter. Results were close to those obtained with a four-flux net radiometer. Differences in calculated and measured fluxes are discussed as well as sources of errors in the calculations. Assumption of clear skies for the computation of atmospheric radiation did not introduce significant errors. A priori values of albedo and emissivity of the different urban surfaces can have large effects on fluxes and radiant temperatures, and the use of tables of those values is probably a large source of uncertainty when using the calculation procedure. In conclusion, the software developed can be a significant tool for the study of thermal comfort conditions in urban settings.
In the 21st century, examination of thermal indices by subjective perception has become methodical. Over 120 studies have assessed human thermal perception by investigating in-situ thermal conditions as compared to subjective thermal perception. The majority were conducted in temperate and tropical climates whereas the arid and semi-arid zones have drawn little attention. The aims of this study were: (a) to evaluate human thermal perception in various outdoor urban spaces during the summer and winter in an arid city (b) to analyze the role of gender in thermal perception in an arid zone (c) to modify the human thermal perception scale for PET index for the city of Beer Sheva, Israel and (d) to examine current assessment methods for subjective human thermal sensation. The study was conducted in Beer Sheva city in hot and arid Southern Israel. Climatic measurements were carried out during the winter, spring and summer between 2009 and 2018 in different locations in the city. A questionnaire survey was conducted during the field measurements, with 2,994 valid responses. Based on the questionnaire, the PET full scale was modified for arid climate. The findings show that the modified PET scale of Beer Sheva shows adaptation to low rather than high temperatures. The modified Neutral PET ranges between 17°C and 26°C which is wider than in Mediterranean and hot, humid climates. Females are more sensitive to high temperatures and during the winter are more tolerant to low temperatures, probably due to their higher clothing ratio.
Sea level variability affected by sea water mass is strongly associated with global, regional and local climate. In this context, the eastern Mediterranean Sea has been intensively investigated in recent decades because of its sensitivity to climatic and environmental variables, due to the influence of the Eastern Mediterranean Transient (EMT). The sea level in Israel during the Crusader period (12th-13th centuries CE) was found to be −0.5 ± 0.20 m relative to the present mean sea level (MSL). The difference between the Crusader sea level and the present-day MSL raises some questions which bring us to the aim of this study: estimating the timeline of the changes in sea level elevation in the eastern Mediterranean over the last two centuries. Archaeological evidence from areas of low tidal range, such as the Mediterranean Sea, can provide significant information on sea level changes for times when instrumental measurements where not yet available (e.g., before 1955 in Israel). The method employed in this study integrates two dimensions: The vertical—estimating the changes in sea levels relative to the present MSL, based on archaeological evidence; and the horizontal—determining the coastline changes, based on coastal architectural and geomorphological structures appearing in historical maps. Both the structural and the cartographic evidence for sea level changes date to the 19th Century, and indicate a rise of 0.36 m over the last two centuries. Findings attesting to horizontal changes, indicate a gradual migration of the coastline landward, to the east since 1863 and a rapid change in the coastal geomorphology at the beginning of the 20th century. The sea level increase from the 19th century might be, in part, a consequence of regional trends and, in part, a result of a gap between method accuracy (archaeology and modern measurements). Nevertheless, the drastic change in the geomorphology of the coastline may indicate an extreme meteorological event, such as a storm at sea, accompanied by a local rise of sea level, but further research is required to verify this.
Over the past century, many research studies have been conducted in an attempt to define thermal conditions for humans in the outdoor environment and to grade thermal sensation. Consequently, a large number of indices have been proposed. The examination of human thermal indices by thermal subjective perception has become recently a methodical issue to confirm the accuracy, applicability and validation of human thermal indices. The aims of this study are: (a) to review studies containing both calculated human thermal conditions and subjective thermal perception in the outdoor environment (b) to identify the most used human thermal indices for evaluating human thermal perception (c) to examine the relation between human thermal comfort range and outdoor thermal environment conditions and (d) to compare between categories of thermal sensation in different climatic zones based on subjective perception and levels of thermal strain. A comprehensive literature review identified 110 peer-reviewed articles which investigated in-situ thermal conditions versus subjective thermal perception during 2001-2017. It seems that out of 165 human thermal indices that have been developed, only 4 (PET, PMV, UTCI, SET*) are widely in use for outdoor thermal perception studies. Examination of the relation between human thermal comfort range and outdoor thermal environment conditions for selective indices in different climatic zones shows that the range of the thermal comfort or dis-comfort is affected by the outdoor thermal environment. For the PET index, the "neutral" range for hot climates of 24-26°C is agreed by 95% of the studies where for cold climate, the "neutral" range of 15-20°C is agreed by 89% of the studies. For the UTCI, the "no thermal stress" category is common to all climates. The "no stress category" of 16-23°C is agreed by 80% of the case studies, while 100% of the case studies agreed that the range is between 18 and 23°C.
Background:Evidence has accumulated in recent years regarding the scope of local and global climate changes attributed to exacerbating anthropogenic factors such as accelerating population growth, urbanization, industrialization, traffic and energy use. Remote space monitoring, unlike ground-based measurements, has the advantage of providing global coverage on a daily basis.Methods:MODIS (Moderate Resolution Imaging Spectroradiometer) Aqua and Terra 1°×1° spatial resolution as well as the 1 km higher resolution of Aqua-MODIS were investigated for a global overview of megacities temperature variations, as well as the recent trends of the 10 largest Monsoon Asian megacities.Results:The average Land Surface Temperature (LST) cross-sections of the 10 Asian megacities were examined for June-August 2002-2014. Temperature variations fit a spatial bell-shaped curve, with a pronounced maximum over the city center. Nighttime data indicated sharp LST decreases with distance from the city center, particularly in the coldest cities, those of Tokyo, Seoul, Osaka and Beijing.Conclusion:Daytime latitudinal (E-W) and longitudinal (N-S) Surface Urban Heat Islands (SUHI) have steeper gradients than for nighttime data. During daytime, the SUHI gradients are largest in Tokyo, Seoul, Osaka and Beijing with values reaching 15oC followed by the cities of Shanghai and Guangzhou with ~11oC, and Karachi with ~5oC SUHI. Nighttime SUHIs were more moderate, 4-6oC in Tokyo, Seoul ~5oC, Osaka 5-7oC and Beijing ~7oC. Only in the three largest megacities,i.e., Tokyo, Guangzhou and Shanghai, did the nighttime LST trends decline.
The Mediterranean summer sea breeze front (SBF) climatic features of penetration into the complex topography of the Jordan Rift Valley (JRV) were investigated. It was shown that the SBF penetration into the JRV occurs in a well-defined chronological order from north to south. One exception to this general rule is the breeze penetration of Sdom, which occurs after it has penetrated the Arava which is located further south, probably due to the micro-climatic effect of the Dead Sea. It was also noted that the breeze increases the local specific humidity as it reaches the JRV in spite of significant temperature increases. The temperature reaches its daily peak 2 to 3 h later in the southern valley compared to the northern valley and is suggested to be due to the later SBF penetration and the valley structure. The pre-SBF line features in the JRV are described.
This study classifies urban environments into types characterized by different exposure to environmental risk factors measured by general sense of discomfort and Heart Rate Variability (HRV). We hypothesize that a set of environmental factors (micro-climatic, CO, noise and individual heart rate) that were measured simultaneously in random locations can provide a better understanding of the distribution of human exposure to environmental loads throughout the urban space than results calculated based on measurements from close fixed stations. We measured micro-climatic and thermal load, CO and noise, individual Heart Rate, Subjective Social Load and Sense of Discomfort (SD) were tested by questionnaire survey. The results demonstrate significant differences in exposure to environmental factors among 8 types of urban environments. It appears that noise and social load are the more significant environmental factors to enhance health risks and general sense of discomfort.
Conventional environmental monitoring is not surrogate of personal exposure. In contrast, biomonitoring provides information on the presence of substances in the human body, making it highly relevant to the assessment of exposure to toxic substances. Induced sputum (IS) is a noninvasive technique for detecting inflammation and reflecting particulate matter content in the airways. In this study, we mapped particulate matter dispersion in metropolitan Tel Aviv by both biomonitoring techniques employing IS samples and by environmental monitoring. All adults referred to the Pulmonary Lab for respiratory symptom evaluation in 2007 and in 2009 were enrolled. Pulmonary function tests were performed by conventional methods. Particulate size distribution in IS was analyzed, and maps of air pollution were created. Biomonitoring was more informative and enabled mapping of wider areas. Integration of biomonitoring and environmental monitoring should be considered in forming public health policy on containment of airborne particles of toxic substances.
 Cohen Pninit合作论文数The Porter School of Environmental Studies, Tel Aviv University;Department of Geography and the Human Environment, Tel Aviv University;Tel Aviv University, Tel Aviv University11
 Yaron Yaakov合作论文数11
 Limor Shashua-Bar合作论文数Faculty of Architecture and Town Planning, Technion-Israel Institute of Technology8
 Andreas Matzarakis合作论文数Faculty of Environment and Natural Resources, University of Freiburg;Deutscher Wetterdienst8
 Izhak Schnell合作论文数Raymond & Beverly Sackler Faculty of Exact Sciences, School of the Environment and Earth Sciences, Tel Aviv University;Department of Geogrpahy and Human Environment, Tel Aviv University7
 Josef Tanny合作论文数Agricultural Research Organization, ARO,Volcani Center6
 Shabtai Cohen合作论文数Institute of Soil, Water and Environmental Sciences, Volcani Center5Arieh Bitan合作论文数4
 Pinhas Alpert合作论文数Department of Geophysics, Faculty of Exact Sciences, Tel Aviv University4
 Moshe Mandelmilch合作论文数3Victor Lukyanov合作论文数3
 Tzu-Ping Lin (林子平)合作论文数Department of Architecture, National Cheng Kung University3Yoram Epstein合作论文数Clinical Departments, School of Medicine, Faculty of Medicine, Tel Aviv University3Haggai Hermesh合作论文数3Avraham Shapira合作论文数2Hofit Itzhak-Ben-Shalom合作论文数2
 Aya Goldshtein合作论文数Sch Zool, Tel Aviv Univ2Alexandra Chudnovsky合作论文数Tel Aviv University2
 Avraham Weizman合作论文数Department of Psychiatry, Tel Aviv University2Brenner Shmuel合作论文数2
 Stefan Becker合作论文数Department of Geography and Urban Planning, University of Wisconsin-Oshkosh2D. Kadish合作论文数2
 Itzhak Omer合作论文数Tel Aviv University;Department of Geography;Department of Geography, Tel Aviv University2
 Michael Sofer合作论文数Department of Geography;Tel-Aviv University;Department of Geography, Tel-Aviv University2
 David Iluz合作论文数Beit Berl College, Bar-Ilan University2
 Yossi Yovel合作论文数Sch Zool, Tel Aviv Univ2Roni Shiloh合作论文数2
 Daphne Goldman合作论文数Beit Berl Academic College;Oranim Academic College of Education;Beit Berl Academic College, Oranim Academic College of Education2Rana Samuels合作论文数2A. Bitan合作论文数1H. Hermesh合作论文数1Aya Lavi合作论文数1Yossi Melzer合作论文数1
 Moshe Fischer合作论文数1
 Ilana Paul-Binyamin合作论文数1
 H. Shafir合作论文数1Elizabeth Fireman合作论文数1
 Pua Bar Kutiel合作论文数Department of Geography;Environmental Development;Ben-Gurion University of the Negev;Department of Geography, Ben-Gurion University of the Negev1
 Hadas Saaroni合作论文数Department of Geography and the Human Environment, Tel Aviv University1Emanuel Tirosh合作论文数1Miriam Popper合作论文数1Dalia Boltansky合作论文数1
 Jallal M. Gnaim合作论文数The Institutes for Applied Research, Ben-Gurion University of the Negev1
 Sorin Cheval合作论文数National Meteorological Administration Bucharest Romania1
 Eyal Ben-Dor合作论文数Department of Geography and Human Environment, Tel-Aviv University1




