The 2023 fire season was a record-breaking natural disaster event in Canada with more than 15 million hectares (Mha) of forests consumed by wildfires. Smoke from wildfires resulted in extremely poor air quality across Canada and impacted cities in eastern USA. Smoke plumes were also transported long-distance across the Atlantic impacting cities in Europe. The FireWork air quality forecast modelling system operated by Environment and Climate Change Canada (ECCC) has been demonstrated to be a valuable tool during these extreme smoke episodes. The system captured the timing and duration of the pollution, and adequately forecasted the PM2.5 concentrations in many regions across the country. A new research version of the system has fire emissions modelled within the GEM-MACH chemistry transport model with coupled meteorology feedback. The system accounts for aerosol direct and indirect effects on radiative transfer and cloud microphysics. In regions impacted by smoke, the fully coupled model simulations showed reduced surface air temperatures, reducing forecast biases relative to observations. In this work, we will present operational analysis of the FireWork system for the 2023 fire seasons, at the same time, show research application of the coupled model on the study of wildfire smoke and aerosol effects on regional weather.
Annual or seasonal wildfire burned area has been frequently and successfully estimated by models in fire research; daily area burned (DAB) over a region, however, has never been effectively modeled due to its high variability. This study identified for the first time a strong relationship between DAB and the spatial extent of fire-conducive weather conditions, especially measured by fuel aridity, in Canadian forests. Observations between 2001 and 2023 used to develop the DAB prediction models showed about 126 active burning days per year and an average DAB of 20 788.93 ha nationally, with about two-thirds of these active burning days occurring in summer. The central boreal forests in Canada experienced both more active burning days and higher DAB, while the more extreme DAB occurred in the eastern region. Of the predicted DAB in Canadian forests between 1940 and 2023 using the developed DAB models, 62 d showed a significant increasing trend, averaging about 60.14 ha per year nationally. Such increases were found mainly in the central region, in summer, and between 2000 and 2023. Daily fire activity has also become more concentrated within the fire season, particularly in the eastern region. From 1940 to 2023, the lengths of the periods covering 50% and 90% of annual area burned decreased by 0.12 d and 0.25 d per year, respectively, across the country. Concurrently, extreme DAB events have become more extreme. Over the 84 year period, summer maximum DAB increased by 133.61 ha, number of extreme burning days (days with DAB exceeding the 84 year mean by one standard deviation) increased by 0.36 d, and proportion of area burned within these extreme days increased by 0.33% annually in Canadian forests.
The 2023 wildfire season in Canada was unprecedented in its scale and intensity, spanning from mid-April to late October and across much of the forested regions of Canada. Here, we summarize the main causes and impacts of this exceptional season. The record-breaking total area burned (similar to 15 Mha) can be attributed to several environmental factors that converged early in the season: early snowmelt, multiannual drought conditions in western Canada, and the rapid transition to drought in eastern Canada. Anthropogenic climate change enabled sustained extreme fire weather conditions, as the mean May-October temperature over Canada in 2023 was 2.2 degrees C warmer than the 1991-2020 average. The impacts were profound with more than 200 communities evacuated, millions exposed to hazardous air quality from smoke, and unmatched demands on fire-fighting resources. The 2023 wildfire season in Canada not only set new records, but highlights the increasing challenges posed by wildfires in Canada.
The Global Forest Fire Emissions Prediction System (GFFEPS) is a model that estimates biomass burning in near-real time for global air quality forecasting. The model uses a bottom-up approach, based on remotely sensed hotspot locations, and global databases linking burned area per hotspot to ecosystem-type classification at a 1 km resolution. Unlike other global fire emissions models, GFFEPS provides dynamic estimates of fuel consumption, fire behaviour and fire growth based on the Canadian Forest Fire Danger Rating System, plant phenology as calculated from daily global weather and burned-area estimates using near-real-time Visible Infrared Imaging Radiometer Suite (VIIRS) satellite-detected hotspots and historical burned-area statistics. Combining forecasts of daily fire weather and hourly meteorological conditions with a global land classification, GFFEPS produces fuel consumption and emission predictions in 3 h time steps (in contrast to non-dynamic models that use fixed consumption rates and require a collection of burned area to make post-burn estimates of emissions). GFFEPS has been designed for use in operational forecasting applications as well as historical simulations for which data are available. A study was conducted showing GFFEPS predictions through a 6-year period (2015-2020). Regional annual total smoke emissions, burned area and total fuel consumption per unit area as predicted by GFFEPS were generated to assess model performance over multiple years and regions. The model's fuel consumption per unit area results clearly distinguished regions dominated by grassland (Africa) from those dominated by forests (boreal regions) and showed high variability in regions affected by El Ni & ntilde;o and deforestation. GFFEPS carbon emissions and burned area were then compared to other global wildfire emissions models, including the Global Fire Assimilation System (GFAS), the Global Fire Emissions Database (GFED4.1s) and the Fire INventory from NCAR (FINN 1.5 and 2.5). GFFEPS estimated values lower than GFAS and GFED (80 % and 74 %) and had values similar to FINN 1.5 (97 %). This was largely due to the impact of fuel moisture on consumption rates as captured by the dynamic weather modelling. Model evaluation efforts to date are described - an ongoing effort is underway to further validate the model, with further developments and improvements expected in the future.
The authors compare modeling system predictions of PM2.5, O3, and NO2 against routine surface measurement sites from 3 different forecasting systems: 1) a system with no wildfire, 2) the existing version of the Canadian forecasting system, and 3) the newly updated Canadian forecasting system. Simulations 2 and 3 include wildfire emissions, which are treated differently in each system. Multiple enhancements to simulating wildfire emissions were implemented in the new forecasting system compared to the existing system including emission factors, plume height, and vertical distribution of smoke emissions within the plume.
Abstract. Biomass burning activities can produce large quantities of smoke and result in adverse air quality conditions in regional environments. In Canada, Environment and Climate Change Canada's (ECCC) operational FireWork air quality forecast system incorporates near-real-time biomass burning emissions to forecast smoke plumes from fire events. The system is based on the ECCC operational Regional Air Quality Deterministic Prediction System (RAQDPS) augmented with near-real-time wildfire emissions using inputs from the Canadian Forest Service's (CFS) Canadian Wildland Fire Information System (CWFIS). Recent improvements to the representation of fire behaviour and fire emissions have been incorporated into the CFS Canadian Forest Fire Emissions Prediction System (CFFEPS). This is a bottom-up system linked to CWFIS in which hourly changes in biomass fuel consumption are parameterized with hourly forecasted meteorology at fire locations. CFFEPS has now also been connected to FireWork. In addition, a plume-rise parameterization based on fire energy thermodynamics is used to define the smoke injection height and the distribution of emissions within a model vertical column. The new system, FireWork-CFFEPS, has been evaluated over North America for July–September 2017 and June–August 2018, both periods when western Canada experienced historical levels of fire activity with poor air quality conditions in several cities as well as other fires affecting northern Canada and Ontario. Forecast results were evaluated against hourly surface measurements for the three pollutant species used to calculate the Canadian Air Quality Health Index (AQHI), namely PM2.5, O3, and NO2, and benchmarked against the operational FireWork system (FireWork-Ops). This comparison shows improved forecast performance and predictive skills for the FireWork-CFFEPS system. Modelled fire plume injection heights from CFFEPS based on fire energy thermodynamics show higher plume injection heights and larger variability. The changes in predicted fire emissions and injection height reduced the consistent over-predictions of PM2.5 and O3 seen in FireWork-Ops. On the other hand, there were minimal fire emission contributions to surface NO2, and results from FireWork-CFFEPS do not degrade NO2 forecast skill compared to the RAQDPS. Model performances statistics are slightly better for Canada than for the U.S., with lower errors and biases. The new system is still unable to capture the hourly variability of the observed values for PM2.5, but it captured the observed hourly variability for O3 concentration adequately. FireWork-CFFEPS also improves upon FireWork-Ops categorical scores for forecasting the occurrence of elevated air pollutant concentrations in terms of false alarm ratio (FAR), and critical success index (CSI).
Estimating carbon emissions from wildland fires is complicated by the large variation in both forest fuels and burning conditions across Canada's boreal forest. The potential for using spatial fuel maps to improve wildland fire carbon emission estimates in Canada's National Forest Carbon Monitoring, Accounting and Reporting System (NFCMARS) was evaluated for select wildfires (representing a transect across western Canada) occurring in 2003 and 2004 at four study areas in western Canada. Area-normalised emission rates and total emissions differed by fuels data source, mainly as a function of the treatment of open fuels in the higher resolution spatial fuel models. The use of spatial data to refine the selection of stand types that probably burned and the use of fire weather conditions specific to the fire increased the precision of total carbon emission estimates, relative to computational procedures used by Canada's NFCMARS. Estimates of total emissions from the NFCMARS were consistent with the regional and national data sources following the spatial approach, suggesting the two approaches had equivalent accuracies. Though it cannot be said with certainty that the inclusion of this detailed information improved accuracy, the spatial approach offers the promise or potential for more accurate results, pending more consistent fuel maps, especially at finer scales.
A time series of burned land areas was generated for a 23 year period (1984–2006) using 10-day composites of AVHRR data. The study area covers 1.6 million km2 of boreal forest in western Canada. The algorithm was intended to be consistent throughout the study period and region, and to avoid commission errors, so as to obtain a reliable sample of temporal trends in burned area in the region. The algorithm relies on temporal comparisons of several spectral indices (GEMI, BAI), as well as near infrared reflectance. It emphasizes the stability of the post-fire signal, to avoid false detections associated with cloud, cloud shadows, missed data and radiometric or geometric calibration between AVHRR sensors.
In support of Canada's National Forest Carbon Monitoring, Accounting and Reporting System, a project was initiated to develop and test procedures for estimating direct carbon emissions from fires. The Canadian Wildland Fire Information System (CWFIS) provides the infrastructure for these procedures. Area burned and daily fire spread estimates are derived from satellite products. Spatially and temporally explicit indices of burning conditions for each fire are calculated by CWFIS using fire weather data. The Carbon Budget Model of the Canadian Forest Sector (CBM-CFS3) provides detailed forest type and leading species information, as well as pre- fire fuel load data. The Boreal Fire Effects Model calculates fuel consumption for different live biomass and dead organic matter pools in each burned cell according to fuel type, fuel load, burning conditions, and resulting fire behaviour. Carbon emissions are calculated from fuel consumption. CWFIS summarises the data in the form of disturbance matrices and provides spatially explicit estimates of area burned for national reporting. CBM-CFS3 integrates, at the national scale, these fire data with data on forest management and other disturbances. The methodology for estimating fire emissions was tested using a large-fire pilot study. A framework to implement the procedures at the national scale is described.
The FWI System, as shown in Figure 1, consists of six components that account for the effects of fuel moisture and wind on fire behavior (Van Wagner 1987). The first three components, the fuel moisture codes, include the Fine Fuel Moisture Code (FFMC), the Duff Moisture Code (DMC) and the Drought Code (DC). These are numeric ratings respectively of the average moisture content of the litter and other fine fuels, of the loosely compacted organic layers of moderate depth, and of the deep, compact organic layers. High values indicate dry fuels. Only the DC is capable of carrying over fall moisture conditions into the spring (Turner and Lawson 1978).
 Kerry R Anderson合作论文数9
 Chen Jack合作论文数5
 Dan K. Thompson合作论文数4
 Hugo Landry合作论文数2Rodrigo Munoz-Alpizar合作论文数2
 Michael D Moran合作论文数Environment and Climate Change Canada2Radenko Pavlovic合作论文数2
 Ronald J. Hall合作论文数Department of Geography, University of Lethbridge2Stephen W. Taylor合作论文数1D. Raymond合作论文数1
 Rob S. Skakun合作论文数1
 Melissa Cholette合作论文数Ctr Etud & Simulat Climat Echelle Reg, Univ Quebec Montreal1Brian Simpson合作论文数Canadian Forest Serv, Nat Resources Canada1
 Raphael D. Chavardes合作论文数Univ Quebec Abitibi Temiscamingue, NSERC UQAT UQAM Ind Chair Sustainable Forest Mana, Rouyn Noranda, PQ, Canada1Dante Castellanos-Acuna合作论文数1Debora Griffin合作论文数Air Qual Res Div, Environm & Climate Change Canada1
 Chelene Hanes合作论文数Great Lakes Forestry Centre, Natural Resources Canada1
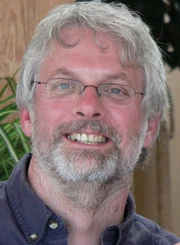 Werner Kurz合作论文数Pacific Forestry Centre, Natural Resources Canada1
 Barber Quinn E合作论文数1Little John M合作论文数1
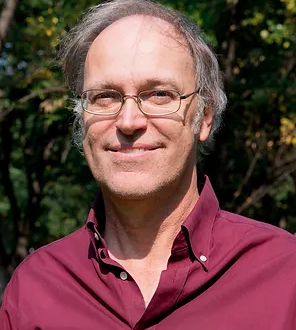 Michael Flannigan合作论文数Department of Renewable Resources, Faculty of Agricultural, Life and Environmental Sci, University of Alberta1
 Ellen Whitman合作论文数School for Resource and Environmental Studies, Dalhousie University1Piyush Jain合作论文数1
 Emilio Chuvieco Salinero合作论文数Departamento de Geología, Geografía y Medio Ambiente, Universidad de Alcalá1
 Xianli Wang合作论文数Beihua University, Beihua University1
 Janet M Pritchard合作论文数1
 Robert H. Fraser合作论文数Canada Centre for Remote Sensing, Canada Centre for Remote Sensing1William J. De Groot合作论文数1Robert Landry合作论文数1Wanmin Gong合作论文数1Tim J. Lynham合作论文数1
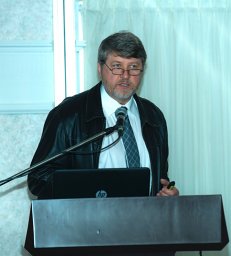 Alexander P. Trishchenko合作论文数Canada Centre for Remote Sensing1
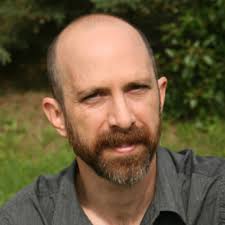 Marc-André Parisien合作论文数Northern Forestry Centre, Canadian Forest Service, Natural Resources Canada1
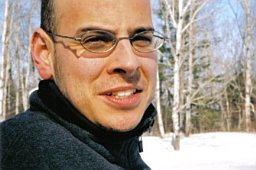 Martin P. Girardin合作论文数Groupe de recherche en écologie forestière inter-universitaire (GREFI),, Université du Quebec1
 Yan Boulanger合作论文数Centre dÕEtudes Nordiques1Juha M. Metsaranta合作论文数1
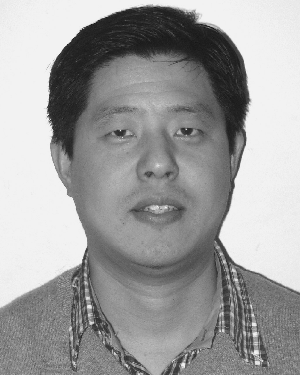 Yi Luo合作论文数1
 Paul A. Makar合作论文数Environment and Climate Change Canada, Government of Canada1




