Equine physiotherapy commonly includes basic exercises such as walking backward (BW) and voluntary lifting of single limbs (SLL), but trunk movements during these have not been studied. In order to compare the trunk kinematics during BW and SLL with forward walking (FW), nine horses were measured in FW, BW and during SLL triggered by tactile cue. Kinematics were obtained from skin markers captured by ten high-speed video cameras. Trunk angles were calculated in sagittal and horizontal planes from withers, dorsal to spinous processes of the 16th thoracic vertebra (T16), 2nd and 4th sacral vertebrae (S2, S4), WT16S2 and T16S2S4 respectively. From the hooves, maximum hoof height during swing phase and horizontal distance between hoof and median body plane during swing and stance phases were determined.Dorsoventral range of motion (ROM) and maximum flexion of WT16S2 was significantly larger in BW than in FW, while laterolateral ROM was significantly smaller during hindlimb swing phase in BW and SLL than in FW. In contrast, dorsoventral ROM of T16S2S4 was significantly smaller during stance and swing phases of hindlimbs in BW compared to FW, and throughout the movement. During forelimb swing phase, T16S2S4 ROM was significantly larger in BW than SLL. Hindhoof height in SLL was significantly higher than in FW. Distance between median body plane and hooves was significantly larger in BW than in FW, and significantly larger in BW than in SLL for hindlimb swing phase. In BW, increased lumbosacral stabilisation and the larger area of support created by fore- and hindlimbs may represent a strategy to enhance body stabilisation, as BW entails some insecurity.
Exertional heat illness (EHI) following strenuous exercise under hot and humid conditions can be detrimental in horses. Direct cooling after intense exercise is necessary to prevent EHI. Therefore, this study aimed to evaluate the efficacy of 3 cooling methods in horses post treadmill exercise. Five mature geldings were treadmill exercised on 3 consecutive weeks to determine the effect of 3 post-exercise cool-down methods (5 × 3 Latin square design). These methods were (i) no water application (Wno), (ii) cold water application only (Wonly; pouring 30 L of cold water (6°C) every min for 6 min) and (iii) cold water application with scraping (Wscraping; cold water (6°C) application followed by scraping after each water application). After 6 min active cool-down phase, the horses were walked in-hand (walking phase) for 4 min and stood (standing phase) for 35 min. Central venous temperature (TCV) and rectal temperature (TR) were selected and measured simultaneously. The collected temperatures were paired and statistically analyzed by Wilcoxon signed rank test to assess the efficiency of cooling between methods. The room temperature and humidity in the treadmill room for the treadmill exercise was (mean ± SD) 27.2 ± 1.3°C and 49.9 ± 7.2% and in the corridor for cooling down was 30.0 ± 2.2°C and 49.0 ± 8.6%. Greater TCV and TR reductions were observed when cold water (Wonly & Wscraping) was applied compared with no water application (Wno) (TCV: −0.91°C for Wonly-Wno, P < 0.001, −0.84°C for Wscraping-Wno, P < 0.001; TR: −0.31°C for Wonly-Wno, P < 0.001, −0.29°C for Wscraping-Wno, P < 0.001), and overall the water application had more cooling down effect on TCV than TR (−0.57°C, P < 0.001). Between the 2 applied cold water methods, significantly lower body temperatures (TCV −0.11°C, P = 0.01; TR −0.03°C, P = 0.01) were observed with Wonly than Wscraping. This study demonstrates that constant contact with water is more important for heat conduction and more effective than producing and using sweat evaporation to remove heat. Application of water without scraping may help decrease the core body temperature in horses more effectively in the early stage of EHI.
Type 1 polysaccharide storage myopathy (T1-PSSM), i.e. irregular formation and build-up of sugars in muscle tissue is present in many breeds including the cold blood Noriker breed and the native pony Haflinger breed. Mutation of the glycogen synthase 1 (GYS1) gene causes T1-PSSM with early signs of histological myopathy changes in muscle fibres even in the absence of clinical signs of T1-PSSM. Also, surface electromyography (sEMG) of the gluteus muscle showed changes consistent with myopathy in the absence of clinical signs in these horses. The aim of the present study was to identify a potential breed specificity of the effect of the GYS1 mutation on the gluteus medius (GM) muscle activity in Haflingers and Norikers during walk and trot. A total of thirty-two horses without clinical signs of myopathy were selected for the current study. Their GYS1 status was known with 6 Haflingers and 7 Norikers homozygous non-affected (GG) and 5 Haflingers and 7 Norikers, heterozygous affected (GA). Activity of GM at walk and trot was measured using sEMG. The parameters used for sEMG signal analysis comprising frequency and amplitude information were the crossings per second (C/s) of the signal through baseline and 25, 50, and 75 percentile lines of the sEMG of the same location during the same gait. Results showed that muscle activity in Haflinger and Noriker horses was strongly determined by the GYS1 status, with less C/s in the horses with the mutated GYS1 gene in both breeds, and the comparisons between the GG and GA was highly significant (P<0.001). Haflingers showed lower C/s values than Norikers both in the GA and the GG horses, with the difference in C/s between GA and GG larger in Norikers than in Haflingers at all percentile lines. The Haflinger breed has developed from a cold blood pony with the use of Arabian stallions who tend to have more highly oxidative muscle fibres than cold blood horses; so this may cause the smaller effect of the GYS1 mutation in this breed.
In the native Austrian breed of Haflinger horses, abnormal polysaccharide accumulations and signs of myopathy in skeletal muscle are commonly caused by type 1 polysaccharide storage myopathy (T1PSSM), based on the genetic mutation of the glycogen synthase 1 (GYS1) gene. In the absence of clinical signs, mild histological myopathy changes in muscle fibres on biopsy as well as changes in the gluteus muscle activity pattern could be documented in Haflinger horses. Surface electromyography (sEMG) of the gluteus medius muscle during walk and trot as well as superficial muscle biopsies in the exact same location taken immediately after sEMG measurements are available of 13 Haflinger horses with homozygous non-affected status (GG, n=5) and heterozygous affected status (GA, n=6) of the GYS1 gene. Thus the aim of the present study is to investigate the correlation between sEMG activity parameters and histology scores for myopathy, to elucidate which histology changes are potentially useful to quantify the functional effect. Parameters used for sEMG signal analysis comprising frequency and amplitude information were the crossings per second (C/s) of the signal through the baseline and the 25, 50, and 75 percentile lines of the sEMG signal at the same location during the same gait. Of the biopsies of the same horses at the same location taken after the sEMG measurement myopathy changes were scored for anguloid atrophy, necrosis or macrophages, central nuclei, and fiber size variation, and numbers of fibers with characteristic cPAS inclusions were expressed as percentage of total fibers counted. There was a significant negative correlation between C/s parameters and myopathy scores over all horses; however, this was not significant within the GA horses alone for any of the myopathy characteristics documented. This may indicate that the functional relevance of the histology parameters in these clinically not affected horses is more of a qualitative than of a quantitative nature.
C.J. McGuire, R.J. Piercy, S. Gonzalez-Medina, C. Massey, K. Robinson and K.F. McGovern Donnington Grove Veterinary Group, Oxford Road, Newbury, Berkshire, RG14 2JB, UK; Comparative Neuromuscular Diseases Laboratory, Royal Veterinary College, Royal College Street, London, NW1 0TU, UK; Hampden Veterinary Hospital, Anchor Lane, Aylesbury, Buckinghamshire, HP20 1AJ, UK. Email: carlyjmcguire@gmail.com. Background: Interest in a novel presentation of a known disease.
Accurate identification of the hip joint centre (HJC) is crucial for the correct estimation of knee and hip joint loads and kinematics, which is particularly relevant in orthopaedic surgery and musculoskeletal modeling. Several methods have been described for calculation of the HJC in humans, however, no studies have used these methods in the horse despite a similar need for improved evaluation of hip joint biomechanics in rehabilitation and musculoskeletal modeling. This preliminary study uses the commonly used functional method (least-squares sphere fit) to determine the HJC in three equid cadavers. Bone pins with reflective markers attached were drilled into the tuber coxae (TC), tuber ischium (TI), tuber sacrale (TS), greater trochanter (GT), third trochanter (TT) and lateral femoral condyle (FC) of the uppermost limb of the cadavers positioned in lateral recumbency. Three repetitions of passive movements consisting of pro-and retraction, aband adduction and circumduction were performed. The HJC was calculated using a least-squares sphere fitting method and presented as a distance from the TC based on a percentage of the TC to TI vector magnitude. Mean (± standard deviation) of the HJC is located 52.4% (± 3.9) caudally, 0.2% (± 6.5) dorsally, and 19.8% (± 4.2) medially from the TC. This study is the first to quantify the HJC in horses in vitro using a functional method. Further work (in vitro, in vivo and imaging) is required to validate the findings of the present study.
Accurate identification of the hip joint centre (HJC) is crucial for the correct estimation of knee and hip joint loads and kinematics, which is particularly relevant in orthopaedic surgery and musculoskeletal modelling. Several methods have been described for calculation of the HJC in humans, however, no studies have used these methods in the horse despite a similar need for improved evaluation of hip joint biomechanics in rehabilitation and musculoskeletal modelling. This preliminary study uses the commonly used functional method (least-squares sphere fit) to determine the HJC in three equid cadavers. Bone pins with reflective markers attached were drilled into the tuber coxae (TC), tuber ischium (TI), tuber sacrale (TS), greater trochanter (GT), third trochanter (TT) and lateral femoral condyle (FC) of the uppermost limb of the cadavers positioned in lateral recumbency. Three repetitions of passive movements consisting of pro-and retraction, ab- and adduction and circumduction were performed. The HJC was calculated using a least-squares sphere fitting method and presented as a distance from the TC based on a percentage of the TC to TI vector magnitude. Mean (± standard deviation) of the HJC is located 52.4% (± 3.9) caudally, 0.2% (± 6.5) dorsally, and 19.8% (± 4.2) medially from the TC. This study is the first to quantify the HJC in horses ex vivo using a functional method. Further work (in vivo and imaging) is required to validate the findings of the present study.
Describing the effects of a carbohydrate-rich diet (CRD) on Haflingers with R309 H glycogensynthase 1 (GYS1) mutation. Haflinger mares heterozygous positive (polysaccharide storage myopathy [PSSM] type 1, n = 7) and negative (control, n = 7) for GYS1 mutation received 6 weeks of CRD and hay only (hay), with a wash out period of two. Each diet was followed by oral glucose tolerance test (oGTF), submaximal treadmill exercise test (STET), and biopsies of semitendinosus (STm) and gluteus medius (GMm) muscles. Insulin sensitivity was evaluated by oGIT. Plasma creatine kinase, aspartate aminotransferase, lactate dehydrogenase, and lactate were measured before and after STET. Semitendinosus and GMm biopsies were evaluated for distribution of fiber types (1, 2A, and 2X), chronic myopathic changes, and complex Periodic Acid Schiff (cPAS) positive amylase resistant inclusions. One Haflinger of control group had cPAS inclusions indicating PSSM type 2; therefore, it was excluded. In PSSM1 horses, cPAS were found in every STm sample, and in 10 of 14 GMm samples, furthermore, STm samples showed a greater total myopathy score and significantly more type 2A and fewer type 2X fibers compared with controls. There were no significant differences between groups regarding enzyme levels and for oGTT. Diet had no effect on muscle enzyme levels after STET and on cPAS inclusions in PSSM1 group. Glycogensynthase 1 mutation in Haflingers was not accompanied by clinical signs, even after STET. Carbohydrate-rich diet for 6 weeks did not induce clinical signs or increase cPAS inclusions. As PSSM type 2 is a possibility in Haflingers, STm muscle biopsy and cPAS evaluation should be performed if GYS1 gene test is negative. (C) 2015 Elsevier Inc. All rights reserved.
Different techniques have been developed for capturing and retrieval, action recognition and video based reconstruction of human motion data in the past years. In this paper, we focus on how these techniques can be adapted to handle quadruped motion capture data and which new applications may appear. We discuss some particularities that must be considered during large animal motion capture. For retrieval, we derive suitable feature sets from quadrupeds motion capture data to perform fast searches for similar motions. Based on the retrieval techniques, the action recognition can be performed on the input motion capture sequences as well as on input video streams. We further present a data-driven approach to reconstruct quadruped motions from video data.
The analysis of equine motion has a long tradition in the past of mankind. Equine biomechanics aims at detecting characteristics of horses indicative of good performance. Especially, veterinary medicine gait analysis plays an important role in diagnostics and in the emerging research of long-term effects of athletic exercises. More recently, the incorporation of motion capture technology contributed to an easier and faster analysis, with a trend from mere observation of horses towards the analysis of multivariate time-oriented data. However, due to the novelty of this topic being raised within an interdisciplinary context, there is yet a lack of visual-interactive interfaces to facilitate time series data analysis and information discourse for the veterinary and biomechanics communities. In this design study, we bring visual analytics technology into the respective domains, which, to our best knowledge, was never approached before. Based on requirements developed in the domain characterization phase, we present a visual-interactive system for the exploration of horse motion data. The system provides multiple views which enable domain experts to explore frequent poses and motions, but also to drill down to interesting subsets, possibly containing unexpected patterns. We show the applicability of the system in two exploratory use cases, one on the comparison of different gait motions, and one on the analysis of lameness recovery. Finally, we present the results of a summative user study conducted in the environment of the domain experts. The overall outcome was a significant improvement in effectiveness and efficiency in the analytical workflow of the domain experts.
Kinematic measurements of fourteen Haflinger horses without lameness, walking and trotting on a treadmill were taken to document the location of the centre of the body (CB), defined as the centre between markers on the head, on the withers, on the sacral bone and on the lateral wall of all four hooves in relation to the sacral bone marker. During walk and trot, there are three dimensional CB position (x: forward-backward, y: side-to-side, and z: up and down). For each horse minimum of eight motion cycles were considered in walk as well as in trot. For all three axes, mean CB location, its standard deviation and its 95% confidence interval (Cl) were calculated. For statistical analysis, Shapiro-Wilk test and Spearman's correlation test were carried out. Mean body mass was 463 +/- 42 kg, CI (439, 487); mean height at the withers was 131 +/- 5 cm, CI (128, 134); mean height at the sacrum was 128 +/- 2 cm, Cl (127, 130). Mean CBx was in front of the sacrum (walk 74 +/- 2 cm, Cl (72, 75); trot 73 +/- 2 cm, CI (72, 74); walk vs trot p=0.008). Mean CBz was below the sacrum (-71 +/- 2 cm, CI (-73, -70) in walk; -69 +/- 2 cm, CI (-70, -68) in trot; walk vs trot p=0.001). Positive correlations were found between MeanCBx and trunk length in walk and trot, which could highlight the biomechanical importance of the trunk as it plays a crucial role in deceleration and acceleration. The analysis of the body location centre may be used to identify differences between horses of the same breed, and thus support evaluation of the quality of the horse during locomotion.
In vertebrates ageing is characterized by reduced viscoelasticity of the ligamentous and tendineous structures and fibre changes in muscle. Also, some vertebral joint degeneration develops with ageing. The aim of this study was to apply dynamic time warping to compare the temporal characteristics of the surface electromyography (sEMG) data and to illustrate the differences in the pattern of muscle use during tasks of daily life in old and mature horses. In vivo kinematics (24 skin markers) and sEMG measurements of neck extensors and flexors were taken in five mature horses (age 10 ± 2 years, half of mean life expectancy) and five old horses (age 25 ± 5 years, older than the mean life expectancy). All horses had the same level of activity in the 12 months prior to the measurement. Tasks measured were neck flexion and neck extension as well as neutral neck position. Muscle activation, minimum and maximum muscle activation were collected. Quartiles of muscle activity based on the maximum observed activity of each muscle were calculated to document the relative increase of activity level during the task. Kinematics as well as overall muscle activity patterns were similar across horses and age groups. However, in the neutral position old horses showed increased extensor activity compared to mature horses, indicating that old equine muscle requires more activity to counteract gravity. Dynamic time warping specified optimal temporal alignments of time series, and different temporal performances were identified. The age groups differed during the flexion task, while extension and neutral were more similar. The results of this study show that even in the second half of life and in the absence of muscle disuse the muscular strategy employed by horses continues to be adapted.
Neck muscles of the horses used in the daily life of the horses, and the splenius muscle undergoes age-related changes associated with postural and phasic muscles. The sonographic documentation of these changes as well as their effect on the muscle activity remains unknown. Investigating muscle activity, size and volume as well as sonographic muscle characteristics and the area changes of the splenius muscle during flexion-extension neck exercises. Surface electromyography activity of the splenius muscle was measured in 6 horses (3-mature horse and 3 aged) without signs of neck pain during flexion and extension of the head/neck unit as well as in a neutral position. Electrodes were placed over both splenius muscles at the level of C2. The measurements were taken by use of an EMG telemetric system with a sample frequency 1.2 kHz. For the ultrasound measurements the 7.5 MHz linear probe without a stand-off pad was used. The probe was positioned transversely and longitudinally over the left and right splenius muscles in the resulting stretched and flexed as well as neutral head/neck positions. In each position, grey-scale analysis as well as fibre alignment was assessed. Additionally, the relationship between the head/neck movement and the sonographic muscle appearance at the resulting head/neck position was assessed. Muscle volume and pattern changes were documented in the splenius muscle of the aged horses. There was a marked difference in longitudinal appearance of the contracted (in head/neck extension) and relaxed (in head/neck flexion) splenius muscles in all horses. While larger muscle volumes were associated with larger EMG activities, sonographic determination of fibrous tissue within the muscle was represented by lower EMG maximum activity during extension only. Increase of connective tissues indicates the aging effect and reduces muscle activity patterns.
The splenius muscle is an important determinant of head/neck position in horses, and it is continuously used in the daily life of horses. In this study age related changes of the splenius muscle during different neck exercises were investigated, as it is representative for spinal musculature. Investigating splenius muscle activity during stretching and flexing of the head/neck complex and comparing it to the neutral position in mature and aged horses. Kinematics and surface electromyography were measured in 6 horses (3-mature horse, 8–15 years and 3 aged, >20 years) without signs of neck pain or clinical neurological impairments. Electrodes were placed over both splenius muscles at the level of C2. The measurements were taken by use of an EMG telemetric system with a sample frequency 1.2 kHz. Twenty-four reflective skin markers were attached to each horse using adhesive tape. Eighteen markers were placed on left and right side on the vertebrae from the first until the sixth cervical vertebrae. Additional markers were placed on the head, and on the withers. Kinematic data were collected in a standard right-handed Cartesian coordinate system using ten digital infrared cameras recording at 120 Hz. Data collection continued until 3 trials (each 10 s) had been recorded. Kinematic data was smoothed using a Butterworth low-pass filter (cut-off frequency, 10 Hz). The splenius muscle showed and increased activity during the extension exercise and reduced activity during the flexion exercise compared to the neutral position. Smaller head acceleration during extension was noted in the aged group. Age related changes in the splenius muscle reduce the maximum activity, and consequently the maximum force production. As a consequence, spinal stabilisation mechanisms become less effective with age.
Handball is one of the top four athletic games with highest injury risks. The jump shot is the most accomplished goal shot technique and the lower extremities are mostly injured. As a basis for ankle sprain simulation, the aim of this study was to extend the ankle region of an existing musculoskeletal full-body model through incorporation of three prominent lateral ankle ligaments: ligamentum fibulotalare anterius (LFTA), ligamentum fibulotalare posterius (LFTP), ligamentum fibulocalcaneare (LFC). The specific objective was to calculate and visualise ligament force scenarios during the jumping and landing phases of controlled jump shots. Recorded kinematic data of performed jump shots and the corresponding ground reaction forces were used to perform inverse dynamics. The calculated peak force of the LFTA (107 N) was found at maximum plantarflexion and of the LFTP (150 N) at maximum dorsiflexion. The peak force of the LFC (190 N) was observed at maximum dorsiflexion combined with maximum eversion. Within the performed jump shots, the LFTA showed a peak force (59 N to 69 N) during maximum plantarflexion in the final moment of the lift off. During landing, the force developed by the LFTA reached its peak value (61 N to 70 N) at the first contact with the floor. After that, the LFTP developed a peak force (70 N to 118 N). This model allows the calculation of forces in lateral ankle ligaments. The information obtained in this study can serve as a basis for future research on ankle sprain and ankle sprain simulation.
REASONS FOR PERFORMING STUDY:Skeletal muscle activity can be concentric or eccentric, anisometric or isometric and correlation of the equine splenius muscle activity with the movement of its effector joints at walk and trot has not yet been fully characterised.OBJECTIVE:Investigating activity of the splenius muscle together with kinematics of head and cranial neck at walk and trot.MATERIALS AND METHODS:Kinematics and surface electromyography were measured in 6 horses (8-20-years-old, 450-700 kg) without signs of neck pain. Markers were placed on left and right crista facialis, and on left and right cervical vertebrae 1 and 3. Head and neck angle was calculated in sagittal and horizontal planes. Electrodes were placed over both splenius muscles at the level of C2. Left and right muscle activity was compared using Student t test for paired samples and correlations calculated using Pearson correlation coefficient. Significance was set at P < 0.05.RESULTS:In all horses, maximum surface electromyography (sEMG) values at the trot were higher than at the walk. The intraindividual differences between maximum and minimum values of the EMG ranged from 45-127 mV in walk and from 154-524 mV in trot. Flexion-extension C1 angle changed by 43° in walk and 27° in trot. For each motion cycle, 2 EMG maxima were found in both gaits, occurring just prior to maximum extension of the C1 angle. Lateral bending at C1 angle changed by 16° in walk and 17° in trot and EMG reached maximum values bilaterally during maximum lateral bending at walk.CONCLUSIONS:The splenius muscle reaches maximum activity at the beginning of the forelimb stance phases in trot, indicating functional stabilisation against flexion of the head and neck. Unilateral activity of the splenius muscle representing stabilisation against lateral movement was not found.
REASONS FOR PERFORMING STUDY Identifying the underlying problem of equine back pain and diseases of the spine are significant problems in veterinary orthopaedics. A study to validate a preliminary biomechanical model of the equine back based on CT images including longissimus dorsi (LD) muscle is therefore important. OBJECTIVES Validation of the back model by comparing the shortening of LD muscles in the model with integrated EMG (IEMG) at stance during induced lateral flexion of the spine. METHODS Longissimus dorsi muscle activity at stance has been used for validation. EMG electrodes were placed laterally at the level of T12, T16 and L3. Reflective markers have been attached on top of the spinous processes T5, T12, T16, L1 and the sacral bone (OS1, OS2) for motion tracking analysis. A virtual model of the equine's back (T1-S5) was built with inclusion of a simplified LD muscle by 2 separate contours left and right of the spine, starting at tuber coxae laterally and attaching to the spinous process T5 medially. Shortening of LD during induced lateral flexion caused by the kinematic data (input) was compared to the 3 EMG signals (T12, T16 and L3) on the active side via correlation. RESULTS Pearson correlation coefficient between IEMG and shortening length of LD in the model was (mean ± s.d.) 0.95 ± 0.07 for the left side and 0.91 ± 0.07 for the right side of LD. CONCLUSIONS Activity of the LD muscles is mainly responsible for stabilisation of the vertebral column with isometric muscle contraction against dynamic forces in walk and trot. This validation requires muscle shortening in the back, like induced lateral flexion at stance. The length of the shortening muscle model and the IEMG show a linear relationship. These findings will help to model the LD for forward simulations, e.g. from force to motion.
REASON FOR PERFORMING STUDY The motion of the atlanto-occipital, cervical vertebral and cervicothoracic joints play an important role in equestrian sports and they are also common sites for lesions limiting performance in horses. OBJECTIVES To calculate inverse kinematics based on cervical vertebral motion and to develop a model close to the measured neck movements. MATERIALS AND METHODS Measurements were recorded in 6 horses without neck pain. Reflective markers were placed on both cristae facialis, both sides of cervical vertebra 1, 3 and 6 on the withers and hooves. The neck model was reconstructed from CT scans of the osseus structures and was developed in SIMM (Software for Interactive Musculoskeletal Modelling). Inverse kinematics calculation was done in OpenSim. Three degrees of freedom: Flexion-extension (FE), axial rotation (AR) and lateral bending (LB) were considered. The simulated motion was generated from the recorded motion of the skin markers. The differences in angular range of motion (ROM) of the joints were analysed using paired sample t tests. RESULTS From the model, the smallest FE ROM was in the C5-C6 joint (2° ± 1°) and the largest was in the C3-C4 joint (11° ± 5°). The smallest AR ROM was in the C5-C6 joint (2° ± 1°) and largest AR ROM was in the atlantoaxial joint (7° ± 2°). The smallest LB ROM was in the C5-C6 joint (2° ± 1°) and the largest LB ROM was in the cervicothoracic joint (18° ± 5°). There were significant differences between the ROM of joints in 51 of 168 comparisons (P < 0.05). CONCLUSIONS The result of the motion of each joint gives an insight into the biomechanics of the equine neck. The small FE ROM at C5-C6 illustrates the pathogenetical relevance of the model for the development of osteoarthritis. The calculated data also provides a source for inverse dynamics.
 Theresia Licka合作论文数Royal Dick Sch Vet Studies, Univ Edinburgh17
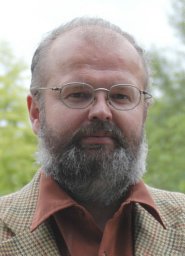 Christian Peham合作论文数Clinic of Orthopaedics in Ungulates, University of the Veterinary Medicine Vienna9
 M Groesel合作论文数4
 S. Valentin合作论文数Equine Clinic, University of Veterinary Medicine Vienna4A Kotschwar合作论文数3A B Kotschwar合作论文数3
 Negar Khayatzadeh合作论文数Univ Nat Resources & Life Sci Vienna BOKU2
 Rene van den Hoven合作论文数2M Szabari合作论文数2L. Modenese合作论文数1Bjoern Krueger合作论文数1Kate McGovern合作论文数1Ulrike Schroeder合作论文数1Jazmine Skinner合作论文数Sch Agr & Environm, Univ Southern Queensland1
 Hyungsuk Kang合作论文数1C Hahn合作论文数1
 Hashim Yasin合作论文数1
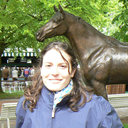 Sonia Gonzalez-Medina合作论文数1
 Caroline Hahn合作论文数The Royal School of Veterinary Studies, The University of Edinburgh/The Dick School of Veterinary Studies, The University of Edinburgh1Lindner M合作论文数1
 Andreas Weber合作论文数Institute of Plant Biochemistry, Department of Biology, Heinrich-Heine-Universitat1Joseph A. Kovacs合作论文数1
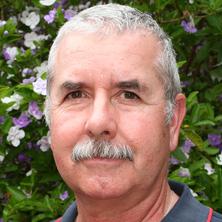 John B Gaughan合作论文数School of Agriculture and Food Sciences, Faculty of Science, The University of Queensland/Centre for Animal Science, Queensland Alliance for Agriculture and Food Innovation1
 Margit Gfoehler合作论文数1
 Bjorn Kruger合作论文数Institute of Computer Science, Universität Bonn1Richard J. Piercy合作论文数1Nils Wilhelm合作论文数Fraunhofer Institute for Computer Graphics Research Darmstadt1
 Bianca Christine Schwarz合作论文数1
 Anna Vogele合作论文数Institute of Computer Science II, Bonn University1Ilse Schwendenwein合作论文数1
 Jürgen Bernard合作论文数Department of Informatics, University of Zurich1




