The continuous sulfur dioxide detector (CSD) is a sensitive instrument for reliable measurements at high time resolution in the atmosphere. This new instrument is based on a SO2 measurement technique utilizing the sulfur chemiluminescence detector, previously validated in a rigorously blind experiment sponsored by the National Science Foundation. Simplified sample handling, dénuder separation technology, and the intrinsic sensitivity and fast response of the detector permit measurement at levels below 100 parts per trillion by volume in tens of seconds with the CSD. The CSD provides a differential measurement where response from ambient SO2 is determined by the difference between air containing SO2 and air scrubbed of SO2, where both air samples contain other detectable sulfur species. Digital signal post processing with phase‐locked amplification of the detector signal enhances the precision and temporal resolution of the CSD. Oversampling of the detector signal at 10 Hz permits subsequent data retrieval to be adapted to changing ambient levels by either enhancing signal to noise when sulfur dioxide levels are low or by maximizing temporal resolution of derived data when levels are high. he instrument has advantages over existing instruments based on Chromatographie separation in that the CSD provides accurate and reliable measurements at low parts per trillion by volume sulfur dioxide with high time resolution. The CSD is compact and automated and does not require cryogenic materials, making this instrument suitable for remote field locations. The high temporal resolution, specificity for SO2, and sensitivity of the CSD make it a good candidate for installation on an aircraft. Airborne studies of SO2 with a sensitive, fast time response instrument may offer new insight into the understanding of phenomena such as gas‐to‐particle conversion, long‐range transport of pollutants, and the oxidation of biogenically produced sulfur gases.
A diffusion denuder, total sulfur chemiluminescence detector instrument for the measurement of SO2 was tested as the second part of the Gas‐Phase Sulfur Intercomparison Experiment (GASIE 2). The SO2 at mixing ratios between 27 and 182 parts per trillion by volume (pptv) was provided by a dynamic dilution apparatus. The data were kept blind from the other party and analyzed by two independent referees. The following was concluded: (1) The independent calibrations of each system are within a few percent. (2) The precision on any one day is better than day‐to‐day variability. (3) Runs in dry air show a small but significant nonzero intercept in correlation plots. (4) No effects of adding NO2 + O3 or CO2 + CH4 + CO + dimethylsulfide are distinguishable. (5) A small but significant effect due to added H2O is evident in both slope and intercept, but the source could not be discerned. (6) On any one day the systems can distinguish among 0, 20, and 40 pptv, but because of day‐to‐day variability, they can only distinguish among 0, 30, and 60 pptv on different days.
To explore the extent to which ocean mixed‐layer dynamics influences dimethyl sulfide (DMS) sea‐to‐air flux at high latitudes, a model of DMS ocean mixing, biological production, and sea‐to‐air flux was developed. This biophysical one‐dimensional model is driven by meteorology. The model simulates DMS seawater concentrations and vertical distributions, and DMS sea‐to‐air flux for Prince William Sound and the Gulf of Alaska, from early March through December. Sensitivity analyses revealed that DMS sea‐to‐air flux is most affected by the rates of flagellate production, Zooplankton grazing, photooxidation, and microbial consumption of DMS. Model results show that under conditions of substantial vertical mixing, such as high wind stress or convective mixing, DMS sea‐to‐air flux increases significantly. At high latitudes these events may coincide with wind‐driven mixing or the overturning of surface seawater due to decreasing sea surface temperatures in the autumn. Parameterizations used to estimate emissions of such a highly variable gas as dimethyl sulfide need to include ocean mixed‐layer dynamics. The current model is limited by the small number of DMS loss and production rate measurements available. The measurements that do exist have large ranges and come almost exclusively from low and midlatitude regions, mostly during the summer months under calm conditions. Field measurements are needed from high‐latitude systems to refine this model, making it an effective tool for designing field campaigns, improving the accuracy of DMS sea‐to‐air flux estimations, and assessing the contribution of northern oceans to the atmospheric sulfur budget.
Nonprecipitating clouds leave a distinctive fingerprint on the aerosol particles that cycle through them by segregating aerosol particles into two populations, those which are incorporated into cloud droplets and those which are not. This leads to a bimodal or double-peaked character in the aerosol number distribution. If some reasonable assumptions are made, cloud microphysical properties can be inferred from the bimodal aerosol distributions. We have collected over 1700 bimodal distributions from five Stations in North America and inferred cloud droplet concentration and maximum supersaturation in the clouds which processed the aerosol particles. Average cloud droplet concentrations are 100-200 cm(-3) at "background" stations, while at the polluted site, cloud droplet concentrations were as high as 3000 cm(-3). Inferred values of maximum supersaturation ranged from 0.3% at clean sites to 0.1% at the polluted site. Cloud droplet concentration and maximum supersaturation were usually inversely correlated. Cloud droplet concentration and geometric mean diameter of the cloud-processed mode in the aerosol number distribution were also inversely correlated. These two relationships can be understood by comparison with a simple model of cloud activation.
ADVERTISEMENT RETURN TO ISSUEPREVBook ReviewNEXTAtmospheric Chemistry and Physics: From Air Pollution to Climate Change By John H. Seinfeld (California Institute of Technology) and Spyros N. Pandis (Carnegie Mellon University). Wiley-VCH: New York. 1997. $89.95. xxvii + 1326 pp. ISBN 0-471-17815-2.Peter Q. Olsson and Richard L. BennerView Author Information University of Alaska, FairbanksCite this: J. Am. Chem. Soc. 1999, 121, 6, 1423Publication Date (Web):December 2, 1998Publication History Published online2 December 1998Published inissue 1 February 1999https://doi.org/10.1021/ja985605yCopyright © 1999 American Chemical SocietyRIGHTS & PERMISSIONSArticle Views2020Altmetric-Citations11LEARN ABOUT THESE METRICSArticle Views are the COUNTER-compliant sum of full text article downloads since November 2008 (both PDF and HTML) across all institutions and individuals. These metrics are regularly updated to reflect usage leading up to the last few days.Citations are the number of other articles citing this article, calculated by Crossref and updated daily. Find more information about Crossref citation counts.The Altmetric Attention Score is a quantitative measure of the attention that a research article has received online. Clicking on the donut icon will load a page at altmetric.com with additional details about the score and the social media presence for the given article. Find more information on the Altmetric Attention Score and how the score is calculated. Share Add toView InAdd Full Text with ReferenceAdd Description ExportRISCitationCitation and abstractCitation and referencesMore Options Share onFacebookTwitterWechatLinked InReddit Read OnlinePDF (19 KB) Get e-AlertsSUBJECTS:Air pollution,Atmospheric chemistry,Climate change,Materials,Students Get e-Alerts
We propose a climate stabilizing feedback loop involving biogenic sulfur. The mechanism is similar to the "CLAW" hypothesis (Charlson et al., 1987) but does not require the active participation of the ocean biota. The magnitude of the feedback response in this loop is derived by convective transport of biogenic sulfur over tropical oceans into the middle and high troposphere. Once aloft, the sulfur is oxidized into low-volatile species which nucleate new particles that later subside back into the subtropical marine boundary layer (MBL) and serve as cloud condensation nuclei (CCN). The MBL clouds are susceptible to albedo modification by changes in CCN concentrations (Platnick and Twomey, 1995). We envision that as global temperatures rise the sea surface warms, convective mass transport of sulfur will rise and the increased mass of sulfur in the upper troposphere will lead to higher numbers of particles or a shift in the particle size distribution to larger sizes. In either case, there is an increase in the number of particles large enough to act as CCN in the air subsiding backinto the MBL. The increase in CCN increases the cloud albedo, decreases the solar input to the surface and the temperature decreases. More measurements are needed to confirm whether the magnitude of increased sulfur carried through the loop as a function of increased sea surface temperature is sufficient to close the loop and regulate the climate.
In this paper, we discuss results from an experiment conducted on natural aerosol in a clean Arctic environment during the spring. The aerosol behaved as though coated with a volatile film, possibly of sulfuric acid. The thermography of the aerosol observed is consistent with a small fraction of the sulfate being neutralized by ammonium as evidenced by an ammonium to sulfate ratio of 0.14. The volatility behavior of the aerosol is also consistent with an increase in the ammonium to sulfate ratio to 0.39 over one day. The change in the ammonium to sulfate ratio and aerosol volume is consistent with 10 pptv of ammonia in the atmosphere being lost to the aerosol during the period. These values are consistent with others observed in the Arctic winter.
Seven techniques for the field measurement of trace atmospheric SO2 were compared simultaneously over 1 month in 1994 using samples produced in situ by dynamic dilution. Samples included SO2 in dry air, in humid air, and in air with potentially interfering gases added, In addition, 2 days of comparison using diluted ambient air were conducted. Six of the seven techniques compared well, with good linear response and no serious interferences but with a range of calibration differences of about 50%,
: The atmosphere of the Arctic is charged with gaseous and particulate material, mostly of industrial origin during the winter and spring months. Assessing the health and environmental impacts of this phenomenon, known as Arctic Haze, in the U. S. Arctic regions represents the long term goal of this research project. The haze is primarily sulfate, but it also contains industrial signatures of trace heavy metals which have been used to establish source origins. Based on inventories of such tracers, it has been estimated that industrial sources in Eurasia contribute approximately 80 percent of the Arctic Haze, while sources in the northeastern United States make up most of the remaining fraction.
The University of Alaska Fairbanks participated in the Gas-Phase Sulfur Intercomparison Experiment (GASIE) to evaluate the sulfur chemiluminescence detector (SCD). The SCD is a relatively new sulfur selective detection technology (Benner and Stedman, 1989, 1990, 1994; Benner, 1991; Stedman and Benner, 1995). The system used during GASIE is referred to as the diffusion denuder/sulfur chemiluminescence detector (DD/SCD). We chose to use a diffusion denuder to separate SO2 from other sulfur species rather than a gas chromatograph because one of our long-term goals is to develop the DD/SCD into a unique system capable of resolving low pptv levels of SO2 on timescales of 1 min or less. The principles of detection of the DD/SCD and how it was operated during GASIE are presented. Results from the GASIE program are presented in detail by Stecher et al. (this issue). In this paper, we briefly describe what was learned about the diffusion DD/SCD technique from GASIE. To address the problems revealed, the DD/SCD has been completely redesigned and rigorously tested in our laboratory. The modifications made, how these modification eliminate many of the problems found during GASIE, and results form subsequent laboratory testing are discussed.
Real‐time total gaseous sulfur concentrations were measured (sampling frequency 1 Hz) from the R/V Oceanus as part of the Atlantic Stratocumulus Transition Experiment/Marine Aerosol and Gas Exchange (ASTEX/MAGE) field campaign in the Azores during June of 1992. The measurements were used to estimate sulfur gas sea‐to‐air flux, determine the size scale of sulfur gas inhomogeneities in the marine boundary layer, and the timescale of sampling necessary to characterize a meaningful air mass. Using the time scale of sampling and wind speed measurements, the size scale of sampling can also be determined. Sea‐to‐air sulfur gas flux estimates were obtained using a variance method and the inertial‐dissipation method. Values from five 1‐hour measurement periods on two different days ranged from 21 to 28 μmol/m2 d and 11 to 17 μmol/m2 d, respectively. These values are above the range of 1 to 13 μmol/m2 d reported by Blomquist et al. (this issue) during ASTEX/MAGE, based on the dimethyl sulfide (DMS) concentration in surface seawater, using the stagnant boundary layer model of air‐sea exchange. A power spectrum of the sulfur gas time series shows the contribution of each turbulent eddy size to the total signal variance. In a representation of the power spectrum, the area under any portion of the curve is proportional to variance. From these power spectra we have obtained the fraction of the total variance in ground level sulfur concentration fluctuations as a function of time. The data indicate that air samples should be integrated for 1000 s for ground‐based measurements.
AbstractBiogenic emissions of sulfur from the ocean surface are believed to be a significant contribution to the atmospheric aerosol burden, thus playing a significant role in climate. The possibility exists for using remotely sensed data to locate sources, map distributions, and estimate global-scale fluxes of marine sulfur flux. By definition, estimates of surface trace-gas flux from satellites are indirect. Empirical algorithms must be derived using direct surface flux measurements. This technology does not currently exist, and may be many years from coming to fruition. This paper discusses the possibilities of developing a satellite-based dimethyl sulphide (DMS) flux capability and describes a new technique that can be used to develop the necessary empirical relationships. It demonstrates the feasibility of using a sulfur chemiluminescence detector (SCD) for measuring surface sulfur-gas flux directly from the ground. It also estimates ocean surface sulfur-gas flux using two related, indirect methods, known as the variance method and the inertial dissipation method. These methods can be used in the Arctic, where the ocean-to-atmosphere flux may be a significant fraction of global biogenic sulfur emissions.
A technique is described for low parts-per-trillion (ppt) detection of SO 2 with high temporal resolution compared to current filter sampling methods. A sulfur chemiluminescence detector, equipped with a quartz burner chamber and a sample probe with a critical orifice, was used as a single detector to analyze SO 2 in ambient air by alternately cycling the sample airstream through a SO 2 denuder. The method provides one SO 2 concentration reading every 10 min. The limits of detection and quantitation were found to be 20 and 70 pptv, respectively. Results from field measurements at a remote site on the south rim of the Grand Canyon during November 1991 are presented, and they indicate a highly variable distribution of SO 2 from the limit of detection to near 2 ppbv
The sulfur chemiluminescence detector (SCD) is a sensitive, highly selective sulfur detection system based on reaction in hydrogen/air combustion followed by extraction and low-pressure chemiluminescence. This report documents investigations into the fundamental chemical processes occurring in the SCD. The conclusion from this work is that ozone reacts with sulfur monoxide (SO) to form electronically excited SO2. A gas-phase titration of the SO formed indicates that approximately four of every 1000 sulfur-containing molecules entering the flame arrive at the reaction cell as SO. This new understanding of the SCD will allow future studies to concentrate on optimization of instrumental performance based on the appropriate chemical mechanism.
ADVERTISEMENT RETURN TO ISSUEPREVArticleNEXTField evaluation of the sulfur chemiluminescence detectorRichard L. Benner and Donald H. StedmanCite this: Environ. Sci. Technol. 1990, 24, 10, 1592–1596Publication Date (Print):October 1, 1990Publication History Published online1 May 2002Published inissue 1 October 1990https://pubs.acs.org/doi/10.1021/es00080a021https://doi.org/10.1021/es00080a021research-articleACS PublicationsRequest reuse permissionsArticle Views169Altmetric-Citations29LEARN ABOUT THESE METRICSArticle Views are the COUNTER-compliant sum of full text article downloads since November 2008 (both PDF and HTML) across all institutions and individuals. These metrics are regularly updated to reflect usage leading up to the last few days.Citations are the number of other articles citing this article, calculated by Crossref and updated daily. Find more information about Crossref citation counts.The Altmetric Attention Score is a quantitative measure of the attention that a research article has received online. Clicking on the donut icon will load a page at altmetric.com with additional details about the score and the social media presence for the given article. Find more information on the Altmetric Attention Score and how the score is calculated. Share Add toView InAdd Full Text with ReferenceAdd Description ExportRISCitationCitation and abstractCitation and referencesMore Options Share onFacebookTwitterWechatLinked InRedditEmail Other access optionsGet e-Alertsclose Get e-Alerts
ADVERTISEMENT RETURN TO ISSUEPREVArticleNEXTUniversal sulfur detection by chemiluminescenceRichard L. Benner and Donald H. StedmanCite this: Anal. Chem. 1989, 61, 11, 1268–1271Publication Date (Print):June 1, 1989Publication History Published online1 May 2002Published inissue 1 June 1989https://pubs.acs.org/doi/10.1021/ac00186a018https://doi.org/10.1021/ac00186a018research-articleACS PublicationsRequest reuse permissionsArticle Views362Altmetric-Citations87LEARN ABOUT THESE METRICSArticle Views are the COUNTER-compliant sum of full text article downloads since November 2008 (both PDF and HTML) across all institutions and individuals. These metrics are regularly updated to reflect usage leading up to the last few days.Citations are the number of other articles citing this article, calculated by Crossref and updated daily. Find more information about Crossref citation counts.The Altmetric Attention Score is a quantitative measure of the attention that a research article has received online. Clicking on the donut icon will load a page at altmetric.com with additional details about the score and the social media presence for the given article. Find more information on the Altmetric Attention Score and how the score is calculated. Share Add toView InAdd Full Text with ReferenceAdd Description ExportRISCitationCitation and abstractCitation and referencesMore Options Share onFacebookTwitterWechatLinked InRedditEmail Other access optionsGet e-Alertsclose Get e-Alerts
 Donald H. Stedman合作论文数5
 Dennis K. Nicks合作论文数Aeronomy Laboratory, National Oceanic and Atmospheric Administration4
 Glenn E. Shaw合作论文数Department of Atmospheric Sciences, College of Natural Science and Mathematics, University of Alaska Fairbanks4
 Will Cantrell合作论文数Department of Physics;Michigan Technological University;Department of Physics, Michigan Technological University3Clara M. Jodwalis合作论文数3S.O. Farwell合作论文数2David R. Crosley合作论文数Molecular Physics Laboratory, SRI International2Paul D Goldan合作论文数2Douglas L. Mactaggart合作论文数2Wt Luke合作论文数1Df Miller合作论文数1
 Daniel Jaffe合作论文数School of Science, Technology, Engineering & Mathematics, Physical Sciences Division, University of Washington Bothell1
 George Luther合作论文数School of Marine Science & Policy, College of Earth, Ocean & Environment, University of Delaware;Department of Chemistry and Biochemistry, University of Delaware1
 Eric S. Saltzman合作论文数Department of Earth System Science, University of California, Irvine;Department of Chemistry, University of California, Irvine1Jianguo Wu合作论文数1William D. Dorko合作论文数1
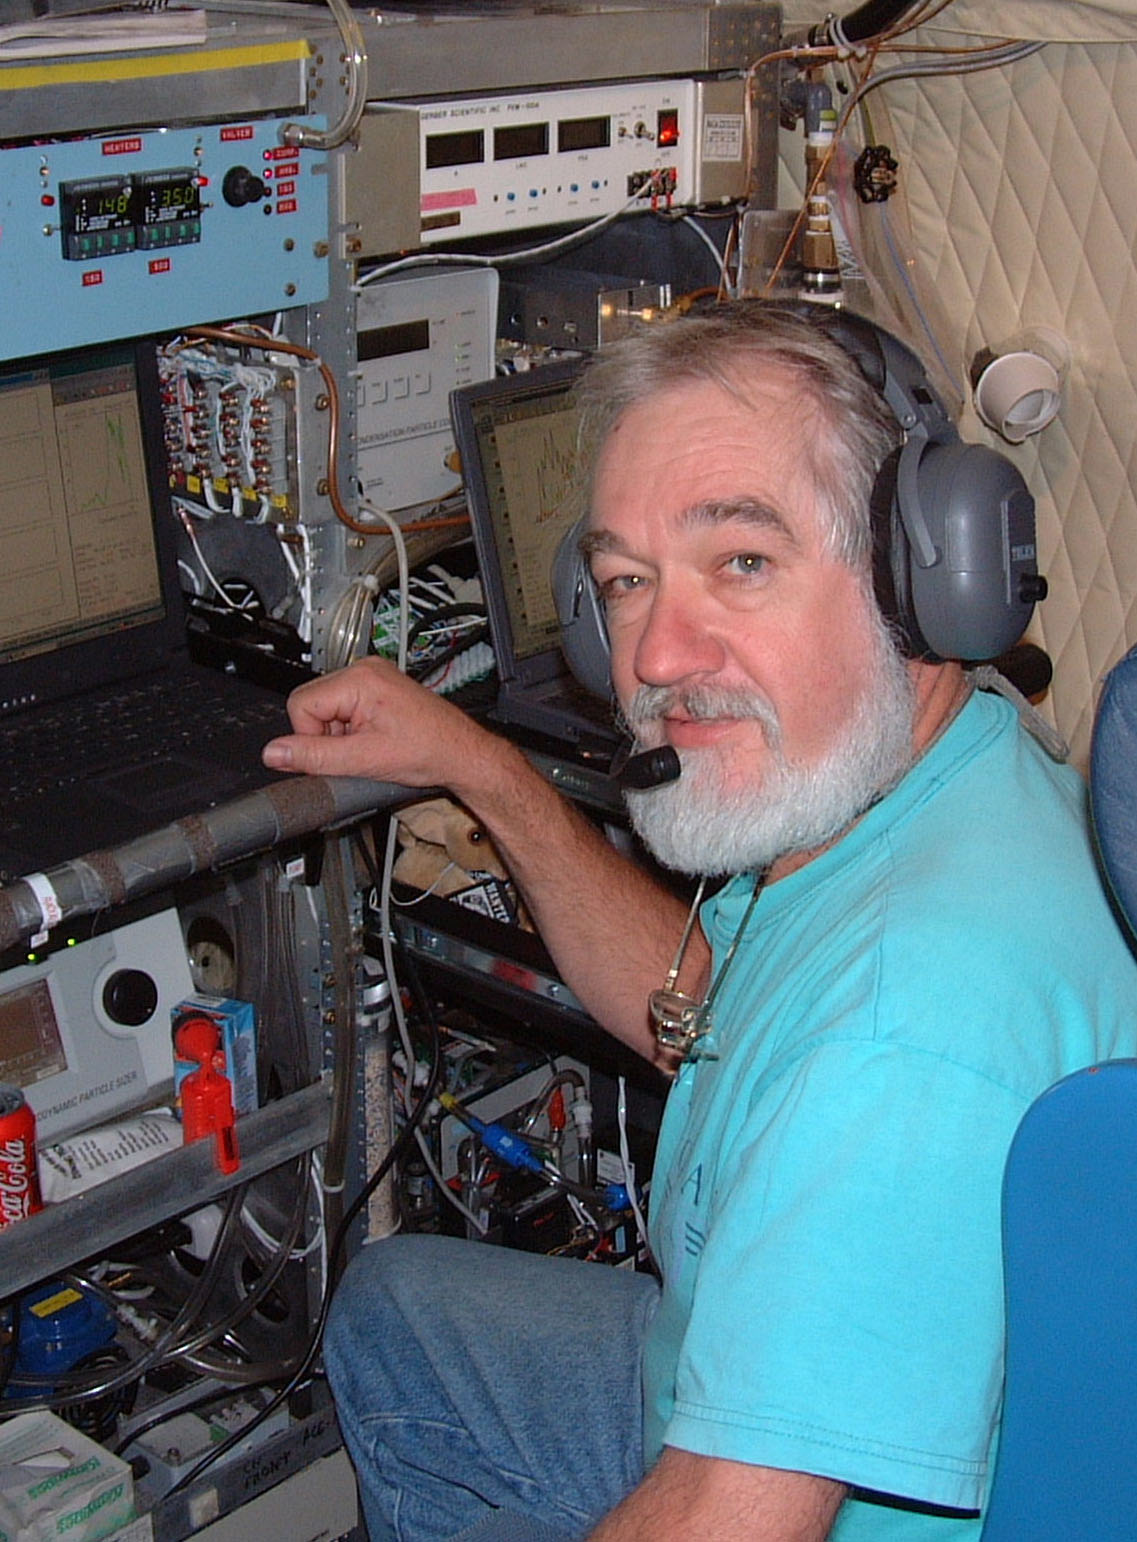 Antony Clarke合作论文数Department of Oceanography, School of Ocean & Earth Science & Technology, University of Hawai`i at Manoa1
 Eric Scheuer合作论文数Earth Systems Research Center, University of New Hampshire1William G. Coulombe合作论文数1Donald C Thornton合作论文数1Ronald J. Ferek合作论文数1Peter Q. Olsson合作论文数1M. S. Gallagher合作论文数1
 David L. Eslinger合作论文数1Gunter Weller合作论文数1David E. Schorran合作论文数1
 Barry Lefer合作论文数Department of Earth and Atmospheric Sciences, University of Houston1N. Beltz合作论文数1Udo Krischke合作论文数1
 Robert Talbot合作论文数Department of Earth and Atmospheric Sciences, College of Natural Sciences and Mathematics, University of Houston1




