This study reports satellite evidence for the most northerly blown dust activity yet observed on Earth. A systematic inspection of high-resolution satellite imagery identified active dust events and their sources >82 degrees N in Peary Land, Greenland. In the absence of any local weather measurements, for all observed dust activity a focus period in April 2020 with multiple dust plumes, reanalysis climate data found the majority of dust events to be associated with wind speeds exceeding a typical threshold value for blowing sand and dust uplift. Wind direction variability points to dust-raising by cold airflow down-valley winds, likely from nearby ice masses.
Abstract. The observation and quantification of mineral dust fluxes from high-latitude sources remains difficult due to a known paucity of year-round in situ observations and known limitations of satellite remote sensing data (e.g., cloud cover and dust detection). Here we explore the chronology of dust emissions at a known and instrumented high latitude dust source: Lhù’ààn Mân (Kluane Lake) in Yukon, Canada. At this location we combine ground instrumentation, space-based remote sensing platforms, ground-based AERONET data, and oblique camera images to (i) investigate the daily to annual chronology of dust emissions recorded by these instrumental and remote sensing methods (at timescales ranging from minutes to years), and (ii) use data intercomparisons to comment on the principal factors that control the detection of dust in each case. Dust emissions were observed using oblique time-lapse (RC) cameras installed at Lhù’ààn Mân for up to 23 hours a day. These were used as a baseline for analysis of aerosol retrievals from in situ metrological data, AERONET, and co-incident MODIS MAIAC. Use of high-cadence remote camera (RC) data collected during dust events allowed us to optimise the use of combination of date quality (DQ) 1 (aerosol optical depth - AOD) and DQ2 (single scattering albedo and Angstöm exponent) to best represent AOD dust retrievals from AERONET. Nevertheless, when compared with time series of RC data, optimised AERONET data only manage an overall 26 % detection rate for events (sub day) but 100 % detection rate for dust event days (DED) when dust was within the field of view. Here, in this instance, RC and remote sensing data were able to suggest that the low event detection rate was attributed to fundamental variations in dust advection trajectory, dust plume height, and inherent restrictions in sun angle at high latitudes. Working with a time series of optimised AOD data (covering 2018/2019), we were able to investigate the gross impacts of DQ choice on DED detection at the month/year scale. Relative to ground observations, AERONET’s DQ2.0 cloud screening algorithm may remove as much as 97 % of known dust events (3 % detection). Finally, when undertaking an AOD comparison for DED and non-DED retrievals, we find that cloud screening of MODIS/AERONET lead to a combined low sample of co-incident dust events, and weak correlations between retrievals. Our results quantify and explain the extent of under-representation of dust in both ground and space remote sensing method; a factor which impacts on the effective calibration and validation of global climate and dust models.
When luminescence dating was being developed much scientific effort was invested in showing it could achieve the correct ages, but this is now not routinely carried out for established protocols. This paper focussed on known age deposits from two case studies to explore whether correct ages were achieved. Case study 1 used the Storegga tsunami deposit dated to 8.2 ka sampled both horizontally and vertically and measured with OSL, IRSL and pIRIR. All results, for both quartz and feldspars, returned the correct age for the horizontal sample. Results from the vertical sample were more problematic with issues attributed to ongoing feldspar contamination of quartz and to beta heterogeneity. To agree with the independent age control single aliquot results required combination of >400 palaeodose replicates and in the case of IRSL the use of minimum age models. Measurements of feldspars at the single grain level using pIRIR measurements showed much improvement. Case study 2 used a barchan dune on the Tibet Plateau, China known to have been in position ∼10 years. Both quartz and feldspars returned young ages close to the true age, but the feldspar ages with brighter luminescence signal were more accurate once the luminescence signal to background ratio was optimised. On the basis of this study we advise against sampling vertically. We also recommend measuring feldspars with single grain pIRIR where possible, measuring >150 palaeodose replicates per sample and choosing feldspars rather than quartz for very young samples.
Tropical forests harbour the highest biodiversity on the planet and are essential to human livelihoods and the global economy. However continued loss and degradation of forested landscapes, coupled with a rapidly rising global population, is placing incredible pressure on forests globally. The United Nations has developed the Reducing Emissions from Deforestation and forest Degradation (REDD +) programme in response to the challenges facing tropical forests and in recognition of the role they can play in climate mitigation. REDD + requires consistent and reliable monitoring of forests, however, national-level methodologies for measuring degradation are often bespoke and, because of an inability to track degradation effectively, the majority of countries combine reporting for deforestation and forest degradation into a single value. Here, we extend a recent analysis that enabled the detection of selective logging at the scale of a logging concession to a regional-scale estimation of selective logging activities. We utilized logging records from across Brazil to train a supervised classification algorithm for detecting logged pixels in Landsat imagery then predicted the extent of logging over a 20 year period throughout Rondonia, Brazil. Approximately one-quarter of the forested lands in Rondonia were cleared between 2000 and 2019. We estimate that 11.0% of the forest area present in 2000 had been selectively logged by 2019, comprising >11 500 km(2)of forest. In general, rates of selective logging were twice as high in the first decade relative to the last decade of the period. Our approach is a considerable advance in developing an operationalized selective logging monitoring system capable of detecting subtle forest disturbances over large spatial scales.
Hundreds of millions of hectares of tropical forest have been selectively logged, either legally or illegally. Methods for detecting and monitoring tropical selective logging using satellite data are at an early stage, with current methods only able to detect more intensive timber harvest (>20 m 3 ha −1 ). The spatial resolution of widely available datasets, like Landsat, have previously been considered too coarse to measure the subtle changes in forests associated with less intensive selective logging, yet most present-day logging is at low intensity. We utilized a detailed selective logging dataset from over 11,000 ha of forest in Rondônia, southern Brazilian Amazon, to develop a Random Forest machine-learning algorithm for detecting low-intensity selective logging (< 15 m 3 ha −1 ). We show that Landsat imagery acquired before the cessation of logging activities (i.e. the final cloud-free image of the dry season during logging) was better at detecting selective logging than imagery acquired at the start of the following dry season (i.e. the first cloud-free image of the next dry season). Within our study area the detection rate of logged pixels was approximately 90% (with roughly 20% commission and 8% omission error rates) and approximately 40% of the area inside low-intensity selective logging tracts were labelled as logged. Application of the algorithm to 6152 ha of selectively logged forest at a second site in Pará, northeast Brazilian Amazon, resulted in the detection of 2316 ha (38%) of selective logging (with 20% commission and 7% omission error rates). This suggests that our method can detect low-intensity selective logging across large areas of the Amazon. It is thus an important step forward in developing systems for detecting selective logging pan-tropically with freely available data sets, and has key implications for monitoring logging and implementing carbon-based payments for ecosystem service schemes.
A method is described to significantly enhance the signature of dust events using observations from the Spinning Enhanced Visible and InfraRed Imager (SEVIRI). The approach involves the derivation of a composite clear-sky signal for selected channels on an individual time step and pixel basis. These composite signals are subtracted from each observation in the relevant channels to enhance weak transient signals associated with either (a) low levels of dust emission or (b) dust emissions with high salt or low quartz content. Different channel combinations, of the differenced data from the steps above, are then rendered in false color imagery for the purpose of improved identification of dust source locations and activity. We have applied this clear-sky difference (CSD) algorithm over three (globally significant) source regions in southern Africa: the Makgadikgadi Basin, Etosha Pan, and the Namibian and western South African coast. Case study analyses indicate three notable advantages associated with the CSD approach over established image rendering methods: (i) an improved ability to detect dust plumes, (ii) the observation of source activation earlier in the diurnal cycle, and (iii) an improved ability to resolve and pinpoint dust plume source locations.
Spatial interpolation of rain gauge data is important for ecohydrology study or modelling of land degradation. The monthly rainfall data recorded at 68 stations in Jornada basin was analysed to study the spatial patterns of rainfall. The inverse distance weighting spatial interpolation method was applied to model the spatial variability of rainfall for a wet (1992) and dry (1994) years. The rainfall interpolation was tested for the basin wide region and by constraining the rainfall-interpolation within the study area boundary. The accuracy of the interpolation result was measured by adopting the leave-one-out cross validation method. The result indicates that the rainfall displayed a strong spatial variability trend from the southwest to the northeast. The result from the CV analysis of the total data points for both year showed that the IDW interpolation method produced from data points within the study area boundary produced better fits compared to the CV result from all the data points within the Jornada basin. The result from constraining the rainfall-interpolation within the study-area boundary showed that the interpolation error from the edge effects can be minimised and result of the predicted values showed a closer fit to the measured values. DOI: 10.5901/mjss.2015.v6n4s3p108
Within the framework of the Dust Observations for Models (DO4Models) project, the performance of three commonly used dust emission schemes is investigated in this paper using a box model environment. We constrain the model with field data (surface and dust particle properties as well as meteorological parameters) obtained from a dry lake bed with a crusted surface in Botswana during a 3 month period in 2011. Our box model results suggest that all schemes fail to reproduce the observed horizontal dust flux. They overestimate the magnitude of the flux by several orders of magnitude. The discrepancy is much smaller for the vertical dust emission flux, albeit still overestimated by up to an order of magnitude. The key parameter for this mismatch is the surface crusting which limits the availability of erosive material, even at higher wind speeds. The second-most important parameter is the soil size distribution. Direct dust entrainment was inferred to be important for several dust events, which explains the smaller gap between modelled and measured vertical dust fluxes. We conclude that both features, crusted surfaces and direct entrainment, need to be incorporated into dust emission schemes in order to represent the entire spectra of source processes. We also conclude that soil moisture exerts a key control on the threshold shear velocity and hence the emission threshold of dust in the model. In the field, the state of the crust is the controlling mechanism for dust emission. Although the crust is related to the soil moisture content to some extent, we are not as yet able to deduce a robust correlation between state of crust and soil moisture.
Salt pans (or playas) are common in arid environments and can be major sources of windblown mineral dust, but there are uncertainties associated with their dust emission potential. These landforms typically form crusts which modify both their erosivity and erodibility by limiting sediment availability, modifying surface and aerodynamic roughness and limiting evaporation rates and sediment production. Here we show the relationship between seasonal surface moisture change and crust pattern development based on both remote-sensing and field surface and atmospheric measurements. We use high resolution (sub-cm) terrestrial laser scanning (TLS; ground-based lidar) surveys over weekly, monthly and annual timescales to accurately characterise crustal ridge thrusting and collapse. This can be as much as 2 mm/day on fresh pan areas that have recently been reset by flooding. Over a two month period, this …
Climate and weather prediction hinge on numerical models. Most of the climate models included in the Coupled Model Intercomparison Project 5 (CMIP5) and which will underpin the Intergovernmental Panel for Climate Change 5th Assessment Report (IPCC AR5) include a dust module because dust is known to play an important role in the Earth system. However dust emission schemes in climate models are relatively simple and are tuned to represent observed background aerosol concentrations most of which are many thousands of kilometres from source regions. The physics of dust emission in the models was developed from idealised experiments such as those conducted in wind tunnels decades ago. Improvement of current model dust emission schemes has been difficult to achieve because of the paucity of observations from key dust sources. Dust Observations for Models (DO4Models) is a project …
Numerical models need to include dust in order to avoid large radiative and associated dynamical errors as these are the only tools we have to predict future weather and climate. The simulation of the dust cycle depends on a wide range of earth system components but begins with realistic representation of source areas. At a global scale, attention to source areas has improved modeling, despite most of the improvements have come through simple, large-scale, source area representation that is likely highly parameterized and generalized. Notable is the absence of any real source area observations at model resolution in almost any previous studies. This research outlines the beginnings of the DO4 project, which through the novel approach of using the regional model as a test-bed for global high resolution models aims to undo the enduring problem of lack of suitable dust source area data. From July to October …
This chapter contains sections titled: The nature and occurrence of pans, playas and salt lakes Pan hydrology and hydrochemistry Influences of pan hydrology and hydrochemistry on surface morphology Aeolian processes in pan environments Pans and playas as palaeoenvironmental indicators References
The Geographical JournalVolume 176, Issue 1 p. 119-119 Deserts and Desert Environments – By Julie Laity Robert Bryant, Robert Bryant University of SheffieldSearch for more papers by this author Robert Bryant, Robert Bryant University of SheffieldSearch for more papers by this author First published: 05 February 2010 https://doi.org/10.1111/j.1475-4959.2009.00347_6.xRead the full textAboutPDF ToolsRequest permissionExport citationAdd to favoritesTrack citation ShareShare Give accessShare full text accessShare full-text accessPlease review our Terms and Conditions of Use and check box below to share full-text version of article.I have read and accept the Wiley Online Library Terms and Conditions of UseShareable LinkUse the link below to share a full-text version of this article with your friends and colleagues. Learn more.Copy URL Share a linkShare onFacebookTwitterLinked InRedditWechat Volume176, Issue1March 2010Pages 119-119 RelatedInformation
Rates of carbon exchange in northern peatlands are dependent on the composition, structure and spatial arrangement of vegetation. Whilst in situ observations can provide detailed information for a given location, remote sensing is the only viable means of collecting land-surface data in a spatially continuous manner across a range of spatial scales. In this paper we review and evaluate many existing and emerging remote sensing approaches used to retrieve peatland land-surface data of relevance to the carbon cycle. We review studies documented in the scientific literature that use remotely sensed data to (i) generate vegetation maps, which may be used to extrapolate field observations, calibrate and extrapolate carbon models and inform peatland management efforts; and (ii) retrieve vegetation biophysical properties, which can be used to parameterize process-based models (e.g. leaf area index (LAI)). There has been considerable progress in the development and implementation of remote sensing approaches that provide data relating to peatland carbon processes. However, there remain a number of methodological challenges, which limit the effectiveness of remote sensing data in some instances. Consequently, we propose that future research approaches focus on (i) continued development, testing and validation of approaches to overcome difficulties caused by the heterogeneous nature of peatland vegetation surfaces (e.g. mixture modeling); (ii) assessment of spatial errors and uncertainty in image classifications, (iii) synergistic use of multiple datasets, (iii) development of scaling algorithms and (iv) continued development of radiative transfer models that can be applied to heterogeneous peatland plant assemblages.
Remote sensing of near-surface hydrological conditi ons within northern peatlands has the potential to prov ide important large-scale hydrological information regarding ecological and carbon-balance processes occurring within such systems. The paper details ho w the spectral properties (400– 2500 nm) of Sphagnum mosses may provide a suitable proxy for near-surfac e peatland hydrological conditions. We investigate th effects of changes in near-surface and surface mois ture upon the spectral characteristics of Sphagnum moss canopies. Laboratory-based canopy reflectance data were collected from a number of Sphagnum species, subjected to drying and subsequent rewetting. Sever al spectral indices developed from the near infra-red (NIR) and shortwave infra-red (SWIR) liquid water absorpt i n bands and a biophysical index were correlated with measures of near-surface moisture. Each species of Sphagnum exhibited a clear and well-defined spectral response to reductions in volumetric moisture conte nt (VMC); reflecting the general water tolerance of ea ch species, and its location in relation to the water table. Airborne imagery were also collected during 2002 fo r a raised bog located in W. Wales. Details regarding t he integration of laboratory and airborne remote sensi ng data for mapping near surface hydrological conditio ns using the spectral reflectance characteristics of Sphagnum are discussed
 Richard Washington合作论文数School of Geography and the Environment, University of Oxford7
 Frank D. Eckardt合作论文数Department of Environmental and Geographical Science, University of Cape Town7
 Giles Wiggs合作论文数School of Geography and the Environment, University of Oxford6
 David Gilvear合作论文数6
 James King合作论文数Sch Geog & Environm, Univ Oxford6
 Angela Harris合作论文数School of Environment, Education and Development, Faculty of Humanities, The University of Manchester5
 Andy Baird合作论文数School of Geography, Faculty of Environment, University of Leeds4
 Nick Drake合作论文数Department of Geography, School of Global Affairs, Faculty of Social Science & Public Policy, King’s College London4
 Joao Carreiras合作论文数3
 DS Thomas合作论文数3
 Matthew G Hethcoat合作论文数Environm Dynam Grp, Univ Sheffield3
 David Edwards合作论文数School of Biosciences, Faculty of Science, The University of Sheffield3P. Mcdonald合作论文数3
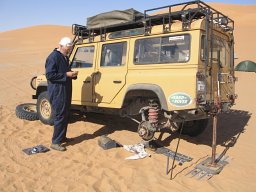 Kevin White合作论文数Department of Geography, University of Reading3
 Andrew N. Tyler合作论文数Department of Environmental Science, University of Stirling3AC Millington合作论文数2
 Joanna Nield合作论文数2JM Nield合作论文数2
 Helen E Brindley合作论文数Department of Physics, Faculty of Natural Sciences, Imperial College London2
 Karsten Haustein合作论文数Institute of Meteorology, Leipzig University2
 Graham Ferrier合作论文数2
 Carlos Peres合作论文数School of Environmental Sciences, Faculty of Science, University of East Anglia2
 David S.G. Thomas合作论文数School of Geography and the Environment, University of Oxford/Oxford Martin School, University of Oxford2M.P Rainey合作论文数2kathryn j vickery合作论文数2Joseph M. Cook合作论文数1J. Wegerdt合作论文数1Dsg Thomas合作论文数1GFS Wiggs合作论文数1Thomas Gribbin合作论文数1Aj Hodson合作论文数1Rosemary Alice Huck合作论文数1
 Archana Dayal合作论文数Dept Geog, Univ Sheffield1
 Sathish Mayanna合作论文数Carl Zeiss Microscopy GmbH1J C Ryan合作论文数Brown University1
 Lam Kuok Choy合作论文数Pusat Kajian Pembangunan, Sosial dan Persekitaran SEEDS, Univ Kebangsaan Malaysia1
 Stefan Hofer合作论文数Univ Oslo, Dept Geosci, Oslo, Norway1
 S. McKenzie Skiles合作论文数Dept Geog, Univ Utah1
 Ken Irvine合作论文数Department of Water Resources and Ecosystems, IHE Delft1
 Nick Shaw合作论文数School of Pharmacy, Faculty of Health and Behavioural Sciences, The University of Queensland1
 Natalie M. Mahowald合作论文数Department of Earth and Atmospheric Sciences, College of Agriculture and Life Sciences, Cornell University1Jacqueline E Russell合作论文数Department of Physics, Faculty of Natural Sciences, Imperial College London1Jonathan E Murray合作论文数Department of Physics, Faculty of Natural Sciences, Imperial College London1
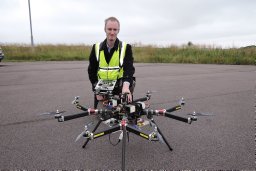 Owen Mcaree合作论文数1
 Andrew J. Tedstone合作论文数School of Geosciences, University of Edinburgh;School of Geosciences, University of Edinburgh1
 Martyn Tranter合作论文数Bristol Glaciology Centre, University of Bristol1
 McCutcheon Jenine合作论文数Department of Earth Sciences, The University of Western Ontario1
 Edward Hanna合作论文数School of Geography and Lincoln Centre for Water & Planetary Health, University of Lincoln, Think Tank, Ruston Way, Lincoln, LN6 7FL, UK1
 Filipe M. Franca合作论文数Setor de Ecologia - Programa de Pós-Graduação em Ecologia Aplicada, Universidade Federal de Lavras1




