After adapting to high-pass filtered (sharpened) images, subsequent images appear to be blurred. Similarly, after looking to low-pass filtered (blurred) images, subsequent images appear sharpened. Until now these two effects were assumed to reflect a response change in the same underlying mechanism. We investigated the characteristics of the adaptation curves as a function of adapting stimuli. Methods: The procedures were modified from Webster et al (2002). Observers adapted (initial 30s, top-up 3sec) to images that were digitally blurred or sharpened by varying the slope of the spatial spectrum up to ±0.50 relative to the natural slope. Observers were asked to decide whether a briefly presented (500ms) test image was perceived “too blurred or too sharp compared to what you think is normal”. Twenty seven observers were tested to determine the point of subjective neutrality (PSN the spectral slope of the image that appears normal). Observers adapted to at least one scene at a minimum of 7 adaptation levels. The PSN for each adaptation level was used to compute individual adaptation curves. Results: Adaptation curves were characterized by the slope of the sigmoid fitted curves (representing the gain of adaptation) and the asymptotes (saturation levels). All observers showed repeatable adaptation effects. Inter-observer variability in the gain of adaptation was found. In addition, within-observer differences were found in the saturation levels to low-pass and high-pass filtered images; some observers showed less adaptation (or even none) to blur than to sharp or vice versa. Conclusions: Adaptation to blurred and sharpened images varies among individuals. Asymmetry between adaptation to blurred and sharpened images suggest a different process for each of these phenomena previously considered parallel.
Image enhancement has been proposed as a potential aid for the visually impaired (1). Digital image enhancement may be used to improve visibility of video images and printed pictures. We demonstrated its value with optically simulated cataracts (1). Use of enhancement filters based on the patient's contrast sensitivity function was shown to modestly reduce magnification demands for reading of patients with central scotoma (2). However, the value of image enhancement in recognizing and perceiving gray scale images has not been demonstrated. If improvement is noted, these techniques may be implemented in various ways. Television programs can be enhanced either at a central broadcasting location or the patient's receiver, or a portable system may be used with a head-mounted, closed-circuit TV system to aid mobility (3). Difficulty with face recognition is a frequent early complaint of many patients with macular disease (4). Faces can be recognized both when low pass filtered to a large degree (5) or high pass filtered (6,7). Since most image enhancement techniques are in the form of high pass filtering, this study evaluated improvement in face recognition with the adaptive en~ hancement algorithm (1). To evaluate actual face recognition rather than the ability to discriminate among test faces, we tested patient ability to recognize celebrities.
Computerized driving simulators are good platforms for evaluating driving abilities but the wealth of data collected must be analyzed with careful attention to the underlying questions of the research program. In the context of an ongoing study we have developed analyses to quantify vehicle-handling skills and head movement behaviors that are relevant to hemianopia (loss of half the visual field on the same side in both eyes). By evaluating skills in specific segments of the drive (straights, curves, turns) we can address important driving behaviors that are relevant to the condition under investigation. These behaviors may be masked when studied across the entire drive, but may be easily detected in specific drive segments. In this methodology paper we describe the development of our assessments and analyses for patients with hemianopia, and use sample data plots from individual cases to demonstrate that our analyses are sensitive to lane position biases, vehicle handling difficulties, and inadequate or compensatory head movements at intersections.
Driving simulator technology provides a safe method for evaluating the impact of vision loss on different components of the driving task and the potential efficacy of visual aids intended to compensate for a particular type of vision loss. Most previous investigations have used general driving scenarios. It is proposed here that scenarios with different task requirements be designed specifically to address the condition under investigation. As an example, the design of driving scenarios and tasks that are specific for the evaluation of one type of visual field loss, homonymous hemianopia, is described. Results of pilot studies show that even with a small sample size, the design is sufficiently sensitive to differentiate individuals with hemianopic visual field loss from control drivers. These results suggest that careful design of test situations, measurements, and analyses provides a strong basis for investigations of driving performance of individuals with specific types of vision impairment and could be used to evaluate the efficacy of low-vision driving aids.
While walking, people rely on visual judgments to avoid collisions. People with severe peripheral vision loss (tunnel vision) report frequent collisions with obstacles. We used a virtual environment to examine how normally-sighted subjects performed with and without simulated tunnel vision in a collision-detection task. The virtual environment consisted of a treadmill situated in front of a large rear-projected screen (about 95 degrees wide). Subjects walked down a simulated shopping mall corridor and were shown one-second glimpses of human-sized obstacles at eccentricities from zero to 12 degrees relative to their heading. Subjects were asked to judge whether continued walking in the same direction would have resulted in a collision with the obstacle. Head and eye tracking were used to dynamically adjust a dark mask restricting the subjects field of vision. Restrictions revealed only parts of the scene within circles 5, 10 or 20 degrees in diameter centered at the subjects' center of gaze. Not surprisingly, subjects failed to see obstacles more frequently as their vision was increasingly restricted. However, when subjects were allowed to repeat obstacle presentations that they failed to see, performance at discriminating collisions was unaffected by peripheral vision restriction.
Wideband enhancement was implemented by detecting visually relevant edge and bar features in an image to produce a bipolar contour map. The addition of these contours to the original image resulted in increased local contrast of these features and an increase in the spatial bandwidth of the image. Testing with static television images revealed that visually impaired patients (n = 35) could distinguish the enhanced images and preferred them over the original images (and degraded images). Most patients preferred a moderate level of wideband enhancement, since they preferred natural-looking images and rejected visible artifacts of the enhancement. Comparison of the enhanced images with the originals revealed that the improvement in the perceived image quality was significant for only 22% of the patients. Possible reasons for the limited increase in perceived image quality are discussed, and improvements are suggested.
Purpose: Homonymous hemianopia (the loss of vision on the same side in each eye) impairs patient ability to navigate and walk safely. We evaluated a novel, prism field-expansion correction for hemianopia in an extended-wearing trial (Peli, 2000 Optom Vision Sci, 77:453). The impact of the prisms on several measures was evaluated. Methods: 11 subjects with complete hemianopia (4 left; 7 right) with neither visual neglect nor cognitive decline participated in the 7-visit study. To extend the horizontal visual field, subjects' spectacles were fitted with both upper and lower Fresnel prism segments (40 PD) across the lens on the side of the visual loss only. Subjects were asked to wear these Peripheral Prism glasses as much as comfortably possible for the duration of the study, which averaged 9 (range: 5 to 12) weeks. Adaptation to the change in perceived direction through the prisms was evaluated at 4 of 7 visits. Way-finding (walk safely to directed locations) and cognitive mapping in an unfamiliar environment (large shopping mall) and perceived quality of life were evaluated at the start and end of the study. Results: Visual Field: About 20° field expansion in upper and lower quadrants was demonstrated for all subjects (binocular perimetry, Goldmann V4e). Perceived Direction: 2 subjects demonstrated a transient adaptation, and conscious adaptation to the change in visual d irection produced by the prism. Clinical Success: Subjects reported wearing the glasses for an average of 4.1 + 4.0 hours/day. At the end of study, 6 of 11 subjects reported benefit and that they would continues wearing the device. 1-3 months after study end, 5 of these 6 subjects reported still habitually wearing the aid. Mall: Way-finding and cognitive mapping had improved at the end of the study, but this appears to have been a practice effect. Quality of Life: At study end, reduced difficulty with noticing obstacles to the side (p=0.07) and moving in stores (p=0.12), but increased difficulty with curbs (p=0.06) was reported. Conclusion: Peripheral Prism glasses provided reported benefit (usually in obstacle avoidance) to about half the subjects in the study. The limited improvement in measured functional performance may have been due to insensitive measurement techniques, a study wearing period that was too short, or suggests that additional training is required.
The area of interest (AOI) on a video frame may be necessary: (1) to develop a television magnifying aid for people with low vision; (2) to implement some data compression schemes; and (3) to transform images for rendering on devices with small display areas. We determined the AOI in video frames by recording and analyzing the eye movements of 4 groups (Young Male, Young Female, Older Male and Older Female) of 5 subjects each while they watched 5–10 minute video segments of 6 movies. Within group AOI coincidence (temporal and spatial) was marked on a frame if valid eye position data was available for at least 4 of the 5 subjects and the bivariate contour ellipse area (BVCA)(k=1, P=63.2%) was < 9 deg2 (the screen was 27×15 deg2). Analysis of the male group's data on 4 movies only was completed to date. Within group, temporal coincidence occurred for about 50% of all frames in each movie (chance would have been < 25%). The within-group AOI coincidence rate was 25%. Between the older and younger age groups, the AOI were < 3 deg apart at least 60% of the time. This was not due to the AOI being clustered around the center of the screen since only 27% of the time they were within 3 deg of the center of the screen. For a < 25 deg2 BVCA, the AOI were within 5deg of the screen center at least 70% of the time accounting for much of the 84% of the time that the AOI were within 5 deg of each other. Conclusion: Across the two groups the AOIs were within 2% of the screen area for a minimum of 15% of frames (where temporal coincidence chance rate was 6%). The high level of AOI coincidence within and across age groups, even away from the screen's center, suggests that a single AOI might be appropriate for varied audiences in many applications. Analysis of the frames where group AOIs differ might be of interest in determining what type of visual or content categories would account for such difference between gender and age group AOIs.
Updated) Purpose: To see if making the experience in virtual reality closer to the “real world” experience (e.g. actually walking, rather than standing or sitting, in a walking simulator) affects task performance. Improved experience of “presence” might make performance in the virtual reality similar to real-world performance, whereas poor presence or an incorrect rendition might impair performance. Methods: We measured perception of a potential collision with stationary obstacles using four experimental situations to compare: standing or walking; walking with or without participant speed control; and correct or incorrect viewpoint. Participants stood or walked on a treadmill 75cm in front of a 95-degree-wide screen that displayed a “shopping mall” corridor with textured floor and shop fronts. Adult-man-size obstacles appeared for 1 second and participants indicated whether they would collide if they continued on the same path. Data for 14 participants were analyzed to find the participant’s perceived safe passing distance and decision quality. Results: When standing, participants had a slightly smaller perceived safe passing distance (p=0.07) and made better decisions (p=0.01) than when walking. Walking with and without participant speed control provided equivalent performance. The incorrect viewpoint biased the results to one side (p=0.08). Conclusions: Our attempts to increase realism did not alter perception of potential collisions. Our with-participant-speedcontrol walking condition required that the participant exert effort to propel the treadmill (i.e. not motorized), which might reduce task performance compared to a feedback-controlled motorized system. An incorrect viewpoint (rendition) caused a bias so obstacle side should be considered in data analysis. Other issues that might affect the experience of presence, including head-tracking and binocular view (stereo cue of flat screen), are under investigation. Supported in part by NIH grant EY12890
Purpose: “Tunnel vision” (severely restricted visual fields) impairs mobility. We evaluated a novel spectacle-based prism device proposed to assist such patients6,8. Methods: To extend the visual fields, two prisms separated by a vertical junction (like a Franklin bifocal) were fitted apex-to-apex over one eye. The other eye had a conventional correction. This creates visual confusion (two different objects at the same apparent direction). Nine patients with advanced retinitis pigmentosa or choroideremia and an average visual field width of 12 ± 5 degrees wore the Trifield glasses for an average of 11 ± 6 weeks. Adaptation to the change in perceived direction of objects seen through the prisms, a perceptual integration of the Trifield device, was evaluated with a pointing task. The ability to navigate and walk safely in an unfamiliar shopping mall was also assessed. Perceived quality of life was evaluated using questionnaires (Rasch analysis5) before and after study. Results: Visual field expansion with Trifield glasses was demonstrated using perimetry. Patients reported detection of obstacles that would otherwise be outside their visual field. However, generally they were unable to determine the location of the obstacle and we found no adaptation to perceived direction. With Trifield glasses, patients walked more slowly in the mall at the end of the study. There were no changes in mobility-related quality of life. At the end of the study, only 4 of 8 patients reported a benefit from Trifield glasses. It is possible that our study length did not provide sufficient time to adjust to the complex visual scene created by the Trifield glasses, particularly since patients only wore them about 0.5 hour per day. However, 10 ± 2 months after completing the study only 1 of 5 patients continued to use Trifield glasses. Conclusions: Trifield glasses provided some benefit to some patients, by giving warning of nearby objects and aid in search for missing objects. However, the benefits were limited and only experienced by 4 out of 8 patients. Adaptation to binocular confusion is difficult even when it provides VF expansion. Supported in part by NIH Grant EY12890, a grant from the FFB, and a grant from the JCRC (SERI/MEEI).
Models of the spatial response of human vision are important for applied work, but the available contrast sensitivity function (CSF) data vary widely due to the diverse spatiotemporal stimuli used over the years. To assist selection, this paper: (1) reports measurements of the effects on the CSF of varying the spatial and temporal windows of grating patches; (2) demonstrates that the widely discrepant CSFs from previous studies can be accounted for by using these results; and (3) discusses simple criteria for choosing CSFs for practical applications. CSFs were measured for several combinations of spatial and temporal waveforms, using the same subjects under otherwise identical conditions. The CSF was measured over the range of 0.5-10 c/deg using Gabor-type patches of 1.0-, 0.5-, 0.25-, and 0.125-octave spatial bandwidths using both abrupt and gradual temporal presentations. The results were compared with the CSF obtained with a fixed aperture (4 deg x 4 deg) grating pattern. Increasing the number of cycles resulted in increased sensitivity at intermediate frequencies, changing the CSF to a narrower bandpass shape. For each patch bandwidth, the gradual presentation CSF had a narrower spatial pass band than with the abrupt presentation. The relevance of the large differences in the CSFs obtained with different stimuli to our understanding of visual performance is discussed.
The appearance of objects generally does not change with changes in the size of their retinal image that occur as the distance from the observer increases or decreases. Contrast constancy ensures this invariance for suprathreshold image features, but fully robust size invariance also requires invariance at threshold, so that near-threshold image features do not appear or disappear with distance changes. Since the angular size and the eccentricity of image features covary with distance changes, the threshold requirement for invariance could be satisfied approximately if contrast thresholds were to vary as the product of the spatial frequency and the eccentricity from the fovea. This model fits contrast thresholds for orientation identification over spatial frequencies of 1-16 cycles/deg and for retinal eccentricities of as much as 23 deg. Contrast detection thresholds from six different studies conform to this model over an even wider range of spatial frequencies and retinal eccentricities. The fitting variable, the fundamental eccentricity constant, was similar for all three studies that measured detection along the horizontal meridian and was higher for the orientation identification contrast thresholds along the same meridian. The eccentricity constant from studies that measured detection along the vertical meridian was higher than the constant calculated for the horizontal meridian and lower than the eccentricity constant for chromatic isoluminance gratings. Our model and these results provide new tools for analyzing the visibility of displays and for designing equal-visibility or variable-visibility displays.
Invariant perception of objects is desirable. Contrast constancy assures invariant appearance of suprathreshold image features as they change their distance from the observer. Fully robust size invariance also requires equal contrast thresholds across all spatial frequencies and eccentricities so that near-threshold image features do not appear or disappear with distance changes. This clearly is not the case, since contrast thresholds increase exponentially with eccentricity. We showed that a less stringent constraint actually may be realized. Angular size and eccentricity of image features covary with distance changes. Thus the threshold requirement for invariance could be approximately satisfied if contrast thresholds were to vary as the product of spatial frequency and eccentricity from the fovea. Measurements of observers' orientation discrimination contrast thresholds fit this model well over spatial frequencies of 1 - 16 cycles/degree and for retinal eccentricities up to 23 degrees. Measurements of observers' contrast detection thresholds from three different studies provided an even better fit to this model over even wider spatial frequency and retinal eccentricity ranges. The fitting variable, die fundamental eccentricity constant, was similar for all three studies (0.036, 0.036, 0.030, respectively). The eccentricity constant for the orientation discrimination thresholds was higher (0.048 and 0.050 for two observers, respectively). We simulated the appearance of images with a nonuniform visual system by applying the proper threshold at each eccentricity and spatial frequency. The images exhibited only small changes over a simulated 4-octave distance range. However, the change in simulated appearance over the same distance range was dramatic for patients with central visual field loss. The changes of appearance across the image as a function of eccentricity were much smaller than in previous simulations, which used data derived from visual cortex anatomy rather than direct measurements of visual function. Our model provides a new tool for analyzing the visibility of displays and for designing equal visibility or various visibility displays.
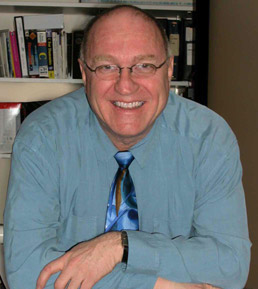 Eliezer Peli合作论文数Tufts Medical Center, Tufts University School of Medicine;Schepens Eye Research Institute, Harvard Medical School;Dalian Maritime University19
 Russell L. Woods合作论文数Department of Ophthalmology, Harvard Medical School, Harvard University;Boston Children's Hospital;Schepens Eye Research Institute, Massachusetts Eye and Ear8
 James Barabas合作论文数MIT4Aaron J Mandel合作论文数3Lawrence E. Arend合作论文数2Jian Yang合作论文数2
 Randolph D Easton合作论文数Psychology Department, Boston College2Yitzhak Yitzhaky合作论文数Ben-Gurion University
The Electro-Optics Engineering Department2
Randolph D Easton合作论文数Psychology Department, Boston College2Yitzhak Yitzhaky合作论文数Ben-Gurion University
The Electro-Optics Engineering Department2 Alexandra A. Bowers合作论文数Harvard Medical School, Harvard University2Henry L. Apfelbaum合作论文数2Tamara L.Y Bond合作论文数2Lynda Bobrow合作论文数2Le Arend合作论文数1r g giorgi合作论文数1Albu Amanda合作论文数1
 Eliot L. Berson合作论文数Department of Ophthalmology, Harvard Medical School, Harvard University1Schepens Eye合作论文数1
 Ju Han Kim合作论文数Division of Biomedical Informatics, Seoul National University College of Medicine;Seoul National University Graduate School1Clement L. Trempe合作论文数Eye Research Institute of Retina Foundation and Retina Associates1Kent E. Higgins合作论文数1
 Gang Luo合作论文数Vision Research and Technology Lab, Schepens Eye Research Institute, Harvard Medical School, Harvard University;Massachusetts Eye and Ear1
 Fuensanta A Vera-Diaz合作论文数Myopia Research Center, New England College of Optometry Boston1Robert G. Giorgi合作论文数1George M. Young合作论文数1Jeong-Hoon Kim合作论文数1
 P. Matthew Bronstad合作论文数Department of Psychology, The University of Texas1




