A mixture model for repeated measures based on nonlinear functions with random effects is reviewed. The model can include individual schedules of measurement, data missing at random, nonlinear functions of the random effects, of covariates and of residuals. Individual group membership probabilities and individual random effects are obtained as empirical Bayes predictions. Although this is a complicated model that combines a mixture of populations, nonlinear regression, and hierarchical models, it is straightforward to estimate by maximum likelihood using SAS PROC NLMIXED. Many different models can be studied with this procedure. The model is more general than those that can be estimated with most special purpose computer programs currently available because the response function is essentially any form of nonlinear regression. Examples and sample code are included to illustrate the method.
This research analyzed the factor structure at both the item- and subtest-level of California's norm- and criterion-referenced standardized educational achievement tests (SEAT) used in that state's high-stakes educational accountability assessments. It was shown through full information factor analysis and multidimensional IRT models (e.g., TESTFACT and NOHARM) that, at the item-level, SEATs are invariably highly unidimensional (i.e., they appear to tap a unidimensional theta scale) even when items representing such diverse content areas such as English, science, mathematics, and history are analyzed simultaneously as a single measure. These item-level factors also accounted for a relatively small proportion (1/4 to 1/3) of the variance. It was also shown that, when these tests are analyzed using more reliable indicators such as subtests, a much richer factor structure emerged that accounted for a larger portion (about 2/3) of the total common variance. As expected, these factor structure configurations (and underlying dimensionality) were preserved across the item- and subtest-levels. However, the factors emerging from both the item- and subtest-level analyses were highly correlated and produced strong second-order and general factors. The meaning underlying these results was examined, along with their implications with respect to the assumptions underlying modern approaches to test calibration, scaling, and score interpretation.
There has been considerable interest in nonlinear latent variable models specifying interaction between latent variables. Although it seems to be only slightly more complex than linear regression without the interaction, the model that includes a product of latent variables cannot be estimated by maximum likelihood assuming normality. Consequently, many approximate methods have been proposed. Recently, a maximum likelihood method of estimation based on the expectation–maximization algorithm has been suggested that is optimum if the distribution assumptions are true. In this article, the authors outline an alternative marginal maximum likelihood estimator using numerical quadrature. A key feature of the approach is that in the marginal distribution of the manifest variables the complicated integration can be reduced, often to a single dimension. This allows a direct approach to maximizing the log-likelihood and makes the method relatively straightforward to use.
A method is presented for marginal maximum likelihood estimation of the nonlinear random coefficient model when the response function has some linear parameters. This is done by writing the marginal distribution of the repeated measures as a conditional distribution of the response given the nonlinear random effects. The resulting distribution then requires an integral equation that is of dimension equal to the number of nonlinear terms. For nonlinear functions that have linear coefficients, the improvement in computational speed and accuracy using the new algorithm can be dramatic. An illustration of the method with repeated measures data from a learning experiment is presented.
Nonlinear patterns of change arise frequently in the analysis of repeated measures from longitudinal studies in psychology. The main feature of nonlinear development is that change is more rapid in some periods than in others. There generally also are strong individual differences, so although there is a general similarity of patterns for different persons over time, individuals exhibit substantial heterogeneity in their particular response. To describe data of this kind, researchers have extended the random coefficient model to accommodate nonlinear trajectories of change. It can often produce a statistically satisfying account of subject-specific development. In this review we describe and illustrate the main ideas of the nonlinear random coefficient model with concrete examples.
This paper presents the results of a post hoc component analysis designed to tease apart the effects of different intervention strategies used in Project Northland, a group-randomized, community-wide, multi-level intervention trial originally conducted in the 1990's to prevent and reduce alcohol use among a cohort of mainly White students in rural Minnesota. This study focuses on Phase I, when students were in 6th–8th grade. The intervention during this phase included five components: classroom curricula, peer leadership, youth-driven/led extra-curricular activities, parent involvement programs, and community activism. Student exposure to/participation in these components was followed over time using reliable process measures. These measures were used as time-varying covariates in growth curve analyses to estimate the effects of the intervention components over time. Multi-item scales from annually-administered student surveys were used to measure relevant outcome variables, like alcohol use. The impact of the components appears to have been differential. The strongest effects were documented for the planners of extra-curricular activities and parent program components. The classroom curricula proved moderately effective, but no effects were associated with differential levels of community activism. The interactions tested here did not provide support for synergistic effects between selected intervention components. Care must be taken when selecting and combining intervention strategies meant to reduce adolescent alcohol use.
The nonlinear random coefficient model has become increasingly popular as a method for describing individual differences in longitudinal research. Although promising, the nonlinear model it is not utilized as often as it might be because software options are still somewhat limited. In this article we show that a specialized version of the model can be fit to data using SEM software. The specialization is to a model in which the parameters that enter the function in a linear manner are random, whereas those that are nonlinear are common to all individuals. Although this kind of function is not as general as is the fully nonlinear model, it still is applicable to many different data sets. Two examples are presented to show how the models can be estimated using popular SEM computer programs.
Quantitative psychology is concerned with the development and application of mathematical models in the behavioral sciences. Over time, models have become more complex, a consequence of the increasing complexity of research designs and experimental data, which is also a consequence of the utility of mathematical models in the science. As models have become more elaborate, the problems of estimating them have become increasingly challenging. This paper gives an introduction to a computing tool called automatic differentiation that is useful in calculating derivatives needed to estimate a model. As its name implies, automatic differentiation works in a routine way to produce derivatives accurately and quickly. Because so many features of model development require derivatives, the method has considerable potential in psychometric work. This paper reviews several examples to demonstrate how the methodology can be applied.
When writing can change your life, when writing can enrich you by offering much money, why don't you try it? Are you still very confused of where getting the ideas? Do you still have no idea with what you are going to write? Now, you will need reading. A good writer is a good reader at once. You can define how you write depending on what books to read. This factor analysis at 100 historical developments and future directions can help you to solve the problem. It can be one of the right sources to develop your writing skill.
This paper reports on the development and validation of a survey instrument for measuring the culture of Quality Management (QM) in K-12 educational settings. The intent was to develop an instrument that would tap both the behavioral norms and the underlying values and beliefs associated with a Quality culture. The process used in the development and honing of this measurement instrument included theory review, qualitative data analysis, practitioner input, and both exploratory and confirmatory factor analytic techniques. Measures of fit and interpretability as well as reliability and validity evidence suggest the iteratively derived survey largely achieves the goal of providing verified scales for evaluating multiple aspects of a school’s Quality culture.
D. J. Bauer and P. J. Curran (2003) cautioned that results obtained from growth mixture models may sometimes be inaccurate. The problem they addressed occurs when a growth mixture model is applied to a single, general population of individuals but findings incorrectly support the conclusion that there are 2 subpopulations. In an artificial sampling experiment, they showed that this can occur when the variables in the population have a nonnormal distribution. A realistic perspective is that although a healthy skepticism to complex statistical results is appropriate, there are no true models to discover. Consequently, the issue of model mis-specification is irrelevant in practical terms. The purpose of a mathematical model is to summarize data, to formalize the dynamics of a behavioral process, and to make predictions. All of this is scientifically valuable and can be accomplished with a carefully developed model, even though the model is false.
The quadratic regression model is popular and effective in describing a wide variety of data, but it is based on a function whose parameters are not easy to interpret. We suggest an alternative form of the quadratic model that has the same expectation function, but also has the useful feature that its parameters are interpretable. Examples are provided of a simple regression problem and also of a nonlinear mixed-effects model. The models can be estimated with available software.
Behavior that develops in phases may exhibit distinctively different rates of change in one time period than in others. In this article, a mixed-effects model for a response that displays identifiable regimes is reviewed. An interesting component of the model is the change point. In substantive terms, the change point is the time when development switches from one phase to another. In a mixed-effects model, the change point can be a random coefficient. This possibility allows individuals to make the transition from one phase to another at different ages or after different lengths of time in treatment. Two examples are reviewed in detail, both of which can be estimated with software that is widely available.
 Joseph A. Cote合作论文数Washington State University8
 douglas j mccormick合作论文数6Norman Cliff合作论文数6Stephen H. C. Du Toit合作论文数5James Barnes合作论文数4Julie Irwin合作论文数4
 Peter M. Bentler合作论文数Department of Psychology, College of Life Sciences, University of California, Los Angeles4
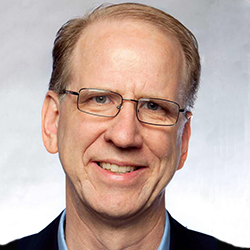 Edward Malthouse合作论文数Industrial Engineering and Management Sciences, McCormick School of Engineering and Applied Science, Northwestern University4
 Donald R. Lehmann合作论文数Marketing Division, Graduate School of Business, Columbia University4
 Richard P. Bagozzi合作论文数Stephen M. Ross School of Business, University of Michigan4
 Cheryl L. Perry合作论文数Michael & Susan Dell Center for Healthy Living, University of Texas Health Science Center at Houston;Department of Health Promotion and Behavioral Sciences, School of Public Health, University of Texas Health Science Center at Houston4
 Jeffrey R. Harring合作论文数Department of Measurement, Statistics and Evaluation, University of Maryland4
 Michael W. Browne合作论文数Department of Statistics, College of Arts and Sciences, The Ohio State University3
 Jayne A. Fulkerson合作论文数School of Nursing, University of Minnesota;Division of Epidemiology, School of Public Health, University of Minnesota3Susan J. Henly合作论文数3
 David W. Stewart合作论文数University of Southern California Southern California3Gloria Rakita Leon合作论文数Department of Psychology, College of Liberal Arts, University of Minnesota3
 Klebe Kelli J合作论文数Department of Psychology, University of Colorado at Colorado Springs.2
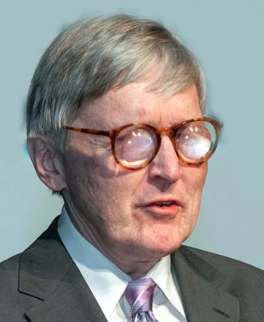 Gordon Legge合作论文数Minnesota Laboratory for Low-Vision Research, Department of Psychology, College of Liberal Arts, University of Minnesota;Center for Applied and Translational Sensory Science, University of Minnesota2Richard G. Netemeyer合作论文数2Celina Tamaki合作论文数2
 Roderick P. Mcdonald合作论文数The Ontario Institute for Studies in Education2
 Tim Ambler合作论文数2Christopher S Kallie合作论文数2
 Timothy Bruce Heath合作论文数University of Iowa2L. F. Schoenfeldt合作论文数1
 Irini Moustaki合作论文数Department of Statistics, London School of Economics and Political Science1Melissa H Stigler合作论文数1
 Keith Widaman合作论文数Graduate School of Education, University of California, Riverside1
 John J. McArdle合作论文数Department of Psychology, University of Southern California1Gaffney Tim W合作论文数1
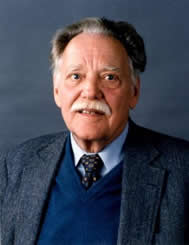 William M. Meredith合作论文数University of California1
 James R. Detert合作论文数Harvard University1
 Kenneth A. Bollen合作论文数Department of Sociology, College of Arts and Sciences, The University of North Carolina at Chapel Hill;Department of Psychology and Neuroscience, College of Arts and Sciences, University of North Carolina at Chapel Hill1Yasuo Amemiya合作论文数1
 Guangjian Zhang合作论文数Department of Urology, Medical College of Wisconsin1
 Solange R. Salomao合作论文数Department of Ophthalmology, Federal University of São Paulo1Dennis P. Mcguire合作论文数1
 Robert C. Maccallum合作论文数University of North Carolina at Chapel Hill1
 J. Stephen Mansfield合作论文数Department of Psychology, University of Minnesota1Carolyn L. Williams合作论文数1
 Emilio Ferrer合作论文数University of California Department of Psychology1
 Kelli A Komro合作论文数University of Florida Gainesville1
 Roger Schroeder合作论文数Carlson School of Management, University of Minnesota1
 Thomas J. Reynolds合作论文数Mathematical Psychology Laboratory, The Rockefeller University1




