The M-w 6.4 and M-w 7.1 Ridgecrest earthquake sequence occurred on 4 and 5 July 2019 within the eastern California shear zone of southern California. Both events produced extensive surface faulting and ground deformation within Indian Wells Valley and Searles Valley. In the weeks following the earthquakes, more than six dozen scientists from government, academia, and the private sector carefully documented the surface faulting and ground-deformation features. As of December 2019, we have compiled a total of more than 6000 ground observations; approximately 1500 of these simply note the presence or absence of fault rupture or ground failure, but the remainder include detailed descriptions and other documentation, including tens of thousands of photographs. More than 1100 of these observations also include quantitative field measurements of displacement sense and magnitude. These field observations were supplemented by mapping of fault rupture and ground-deformation features directly in the field as well as by interpreting the location and extent of surface faulting and ground deformation from optical imagery and geodetic image products. We identified greater than 68 km of fault rupture produced by both earthquakes as well as numerous sites of ground deformation resulting from liquefaction or slope failure. These observations comprise a dataset that is fundamental to understanding the processes that controlled this earthquake sequence and for improving earthquake hazard estimates in the region. This article documents the types of data collected during postearthquake field investigations, the compilation effort, and the digital data products resulting from these efforts.
Paleoenvironmental records from a southern California coastal saltmarsh reveal evidence for repeated late Holocene coseismic subsidence events. Field analysis of sediment gouge cores established discrete lithostratigraphic units extend across the wetland. Detailed sediment analyses reveal abrupt changes in lithology, percent total organic matter, grain size, and magnetic susceptibility. Microfossil analyses indicate that predominantly freshwater deposits bury relic intertidal deposits at three distinct depths. Radiocarbon dating indicates that the three burial events occurred in the last 2000 calendar years. Two of the three events are contemporaneous with large-magnitude paleoearthquakes along the Newport-Inglewood/Rose Canyon fault system. From these data, we infer that during large magnitude earthquakes a step-over along the fault zone results in the vertical displacement of an approximately 5-km2 area that is consistent with the footprint of an estuary identified in pre-development maps. These findings provide insight on the evolution of the saltmarsh, coseismic deformation and earthquake recurrence in a wide area of southern California, and sensitive habitat already threatened by eustatic sea level rise.
A statewide assessment for geological evidence of tsunamis, primarily from distant-source events, found tsunami deposits at several locations, though evidence was absent at most locations evaluated. Several historical distant-source tsunamis, including the 1946 Aleutian, 1960 Chile, and 1964 Alaska events, caused inundation along portions of the northern and central California coast. Recent numerical tsunami modeling results identify the eastern Aleutian Islands subduction zone as the “worstcase” distant-source region, with the potential for causing tsunami runups of 7–10 m in northern and central California and 3–4 m in southern California. These model results, along with a review of historical topographic maps and past geotechnical evaluations, guided site selection for tsunami deposit surveys. A reconnaissance of 20 coastal marshlands was performed through site visits and coring of shallow surface sediments to determine if evidence for past tsunamis existed. Although conclusive evidence of tsunami deposits was not found at most of the sites evaluated, geologic evidence consistent with tsunami inundation was found at two locations: Three marshes in the Crescent City area and Pillar Point marsh near Half Moon Bay. Potential tsunami deposits were also evaluated at the Carpinteria Salt Marsh Reserve in Santa Barbara County. In Crescent City, deposits were ascribed to tsunamis on the basis of stratigraphic architecture, particle size, and microfossil content, and they were further assigned to the 1964 Alaska and 1700 Cascadia tsunamis on the basis of dating by cesium-137 and radiocarbon methods, respectively. The 1946 tsunami sand deposit was clearly identified throughout Pillar Point marsh, and one to two other similar but highly discontinuous sand layers were present within 0.5 m of the surface. A tsunami-origin interpretation for sand layers at Carpinteria is merely consistent with graded bedding and unsupported by diatom or foraminiferal assemblages. Additional studies, including age dating, grain-size, and microfossil analyses are underway for the deposits at Crescent City, Pillar Point marsh, and Carpinteria, which may help further identify if other tsunami deposits exist at those sites. The absence of evidence for tsunamis at other sites examined should not preclude further work beyond the reconnaissance-level investigations at those locations.
Data on the specific timing of postfire flash floods and debris flows are very limited. We describe a method to measure the response times of small burned watersheds to rainfall using a low‐cost pressure transducer, which can be installed quickly after a fire. Although the pressure transducer is not designed for sustained sampling at the fast rates (≤2 s) used at more advanced debris flow monitoring sites, comparisons with high‐frequency stage data show that measured spikes in pressure sampled at 1 min intervals are sufficient to detect the passage of most debris flows and floods. Postevent site visits are used to measure the peak stage and identify flow type on the basis of deposit characteristics. The basin response time scale (tb) to generate flow at each site was determined from an analysis of the cross correlation between time series of flow pressure and 5 min rainfall intensity. This time scale was found to be less than 30 min for 40 postfire floods and 11 postfire debris flows recorded in 15 southern California watersheds (≤1.4 km2). Including data from 24 other debris flows recorded at 5 more instrumentally advanced monitoring stations, we find there is not a substantial difference in the median tb for floods and debris flows (11 and 9 min, respectively); however, there are slight, statistically significant differences in the trends of flood and debris flow tb with basin area, which are presumably related to differences in flow speed between floods and debris flows.
 Eileen Hemphill-Haley合作论文数4
 Joseph A Carlin合作论文数3
 Matthew E Kirby合作论文数Geological Sciences Department, California State University, Fullerton3Brady P. Rhodes合作论文数3scott w starratt合作论文数2casey loofbourrow合作论文数2Dylan Caldwell合作论文数2
 Mary Mcgann合作论文数US Geol Survey2
 Harvey M. Kelsey合作论文数Department of Geology, Humboldt State University2Katherine M. Scharer合作论文数Department of Geological Sciences, 1272 University of Oregon, Eugene, OR 97403, USA2Don F. Hoirup合作论文数2
 Bruce Richmond合作论文数U.S. Geological Survey2Steve Watt合作论文数2
 Catherine Chagué-Goff合作论文数School of Biological, Earth & Environmental Sciences, University of New South Wales 2
 James Goff合作论文数School of Biological, Earth & Environmental Sciences, University of New South Wales2Richard Koehler合作论文数1Judith Zachariasen合作论文数1Matt O'Neal合作论文数1Thomas F. Bullard合作论文数1Kelly Blake合作论文数1robert w peters合作论文数1Daniel J. Ponti合作论文数1James Luke Blair合作论文数1Carla M. Rosa合作论文数1Jeffrey Bachhuber合作论文数1Michael DeFrisco合作论文数1Nicholas Graehl合作论文数1Christopher Madugo合作论文数1Gordon Seitz合作论文数1Brian Swanson合作论文数1Eleanor Spangler合作论文数1Jerome Treiman合作论文数1Francesca Valencia合作论文数1
 Brian P.E. Olson合作论文数1Timothy Dawson合作论文数1Joshua Vanderwal合作论文数1Salena Padilla合作论文数1Alana Williams合作论文数1Stephanie Nale合作论文数1Carlos Gutierrez合作论文数1Nathaniel Roth合作论文数1
 Todd L Ericksen合作论文数1Maxime Mareschal合作论文数1Alexandra J. Pickering合作论文数United States Geological Survey1
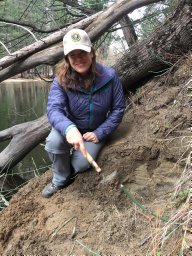 Elizabeth K. Haddon合作论文数US Geol Survey, Geol Minerals Energy & Geophys Sci Ctr1
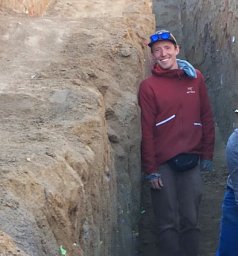 Colin Chupik合作论文数Bur Reclamat, US Geol Survey1
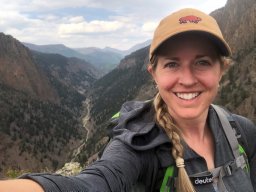 Jessica Ann Thompson Jobe合作论文数Geologic Hazards Science Center, U.S. Geological Survey1
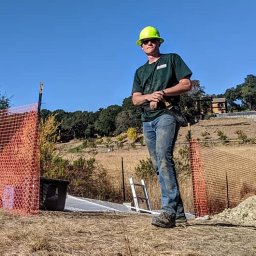 Daniel D. Mongovin合作论文数Dept Geol, Univ Kansas1
 Xiaohua Xu (许效华)合作论文数School of Earth and Space Sciences, University of Science and Technology of China1




