Web visualization dashboards are popular. We propose a system called RAIV that can capture and archive web visualizations into self-contained objects. RAIV also uses a client-server architecture to host and manage archived objects as online galleries, which users can use a standard web browser to experience without needing to install any additional software. RAIV supports intelligent search as well. When a search target has been found, RAIV can show the interaction path required to reach that target. We demonstrate RAIV's capability using a genomics web visualization system called KnowEnG from NCSA and publicly available census data visualizations from US Census.
We present a simple comparative framework for testing and developing uncertainty modeling in uncertain marching cubes implementations. The selection of a model to represent the probability distribution of uncertain values directly influences the memory use, run time, and accuracy of an uncertainty visualization algorithm. We use an entropy calculation directly on ensemble data to establish an expected result and then compare the entropy from various probability models, including uniform, Gaussian, histogram, and quantile models. Our results verify that models matching the distribution of the ensemble indeed match the entropy. We further show that fewer bins in nonparametric histogram models are more effective whereas large numbers of bins in quantile models approach data accuracy.
The term "in situ processing" has evolved over the last decade to mean both a specific strategy for visualizing and analyzing data and an umbrella term for a processing paradigm. The resulting confusion makes it difficult for visualization and analysis scientists to communicate with each other and with their stakeholders. To address this problem, a group of over 50 experts convened with the goal of standardizing terminology. This paper summarizes their findings and proposes a new terminology for describing in situ systems. An important finding from this group was that in situ systems are best described via multiple, distinct axes: integration type, proximity, access, division of execution, operation controls, and output type. This paper discusses these axes, evaluates existing systems within the axes, and explores how currently used terms relate to the axes.
As application scientists develop and deploy simula- tion codes on to leadership-class computing resources, there is a need to instrument these codes to better understand performance to efficiently utilize these resources. This instrumentation may come from independent third-party tools that generate and store performance metrics or from custom instrumentation tools built directly into the application. The metrics collected are then available for visual analysis, typically in the domain in which there were collected. In this paper, we introduce an approach to visualize and analyze the performance metrics in situ in the context of the machine, application, and communication domains (MAC model) using a single visualization tool. This visualization model provides a holistic view of the application performance in the context of the resources where it is executing.
Data analysis and visualization are an essential part of the scientific discovery process. As HPC simulations have grown, I/O has become a bottleneck, which has required scientists to turn to in situ tools for simulation data exploration. Incorporating additional data, such as runtime performance data, into the analysis or I/O phases of a workflow is routinely avoided for fear of excaberting performance issues. The paper presents how the Uintah Framework, a suite of HPC libraries and applications for simulating complex chemical and physical reactions, was coupled with VisIt, an interactive analysis and visualization toolkit, to allow scientists to perform parallel in situ visualization of simulation and runtime performance data. An additional benefit of the coupling made it possible to create a "simulation dashboard" that allowed for in situ computational steering and visual debugging.
SummaryTo achieve their mission and goals, HPC centers continually strive to improve the effectiveness of their resources and services to best serve their constituencies. Collectively, the community has learned a great deal about how to manage and operate HPC centers, provide robust and effective services, and develop new communities as well as about other important aspects. Yet, cataloguing best practices to help inform and guide the broader HPC community is not often done. To improve the situation, the Blue Waters project has documented sets of best practices that have been adopted for the deployment and operation over the past five years of the Blue Waters leadership system, a large Cray XE6/XK7 supercomputer at NCSA. Those practices, described in this paper, cover aspects of managing and operating the system and its resources, supporting its users, and expanding the diversity of applications and communities. Although the technical practices are sometimes discussed relative to Cray systems and leadership‐scale systems, we believe that they would benefit the deployment and operation of other large HPC installations as well.
This PhD will be done in the context of the Inria Project Lab (IPL) HPC-BigData: High Performance Computing and Big Data. The goal of this IPL is to gather teams from HPC, Big Data and Machine Learning (ML) areas to work at the intersection between these domains. External partners include: ATOS/Bull, Argonne National Lab (ANL), Laboratoire de Biochimie Théoerique (LBT), CNRS, ESI-Group, Grid’5000.
Performance-related diagnostic data routinely collected by administrators of HPC machines is an excellent target for the application of machine learning approaches. There is a clear notion of “good” and “bad” and there is an obvious application: performance prediction and optimization. In this paper we will detail utilizing machine learning to model I/O on the Blue Waters supercomputer. We will outline data collection alongside usage of two representative machine learning approaches. Our final goal is the creation of a practical utility to advise application developers on I/O optimization strategies and further provide a heuristic allowing developers to weigh efforts against expectations. We have additionally devised an incremental experimental framework in an attempt to pinpoint impacts and causes thereof; in this way we hope to partially open the machine learning black box and communicate additional insights/considerations for future efforts. Keywords-component; formatting; style; styling;
In this work, we pose the question of whether, by considering qualitative information such as a sample target image as input, one can produce a rendered image of scientific data that is similar to the target. The algorithm resulting from our research allows one to ask the question of whether features like those in the target image exists in a given dataset. In that way, our method is one of imagery query or reverse engineering, as opposed to manual parameter tweaking of the full visualization pipeline. For target images, we can use real-world photographs of physical phenomena. Our method leverages deep neural networks and evolutionary optimization. Using a trained similarity function that measures the difference between renderings of a phenomenon and real-world photographs, our method optimizes rendering parameters. We demonstrate the efficacy of our method using a superstorm simulation dataset and images found online. We also discuss a parallel implementation of our method, which was run on NCSA's Blue Waters.
Large scale molecular dynamics simulations produce terabytes of data that is impractical to transfer to remote facilities. It is therefore necessary to perform visualization tasks in-situ as the data are generated, or by running interactive remote visualization sessions and batch analyses co-located with direct access to high performance storage systems. A significant challenge for deploying visualization software within clouds, clusters, and supercomputers involves the operating system software required to initialize and manage graphics acceleration hardware. Recently, it has become possible for applications to use the Embedded-system Graphics Library (EGL) to eliminate the requirement for windowing system software on compute nodes, thereby eliminating a significant obstacle to broader use of high performance visualization applications. We outline the potential benefits of this approach in the context of visualization applications used in the cloud, on commodity clusters, and supercomputers. We discuss the implementation of EGL support in VMD, a widely used molecular visualization application, and we outline benefits of the approach for molecular visualization tasks on petascale computers, clouds, and remote visualization servers. We then provide a brief evaluation of the use of EGL in VMD, with tests using developmental graphics drivers on conventional workstations and on Amazon EC2 G2 GPU-accelerated cloud instance types. We expect that the techniques described here will be of broad benefit to many other visualization applications.
The increasing gap between computational power and I/O performance in new supercomputers has started to drive a shift from an offline approach to data analysis to an inline approach, termed in situ visualization (ISV). While most visualization software now provides ISV, they typically visualize large dumps of unstructured data, by rendering everything at the highest possible resolution. This often negatively impacts the performance of simulations that support ISV, in particular when ISV is performed interactively, as in situ visualization requires synchronization with the simulation. In this work, we advocate for a smarter method of performing ISV. Our approach is data-driven: it aims to detect potentially interesting regions in the generated dataset in order to feed ISV frameworks with “the interesting” subset of the data produced by the simulation. While this method mitigates the load on ISV frameworks by making them more efficient and more interactive, it also helps scientists focus on the relevant part of their data. We investigate smart ISV in the context of a climate simulation, with a set of generic filters derived from information theory, statistics and image processing, and show the tradeoff between performance and quality of visualization.
The process of optimizing parallel I/O can quite easily become daunting. By the nature of its implementation there are many highly sensitive, tunable parameters and a subtle change to any of these may have drastic or even completely counterintuitive results. There are many factors affecting performance: complex hardware configurations, significant yet unpredictable system loads, and system level implementations that perform tasks in unexpected ways. A final compounding issue is that an optimization is very likely specific to only a single application. The state of the art then is usually a fuzzy mixture of expertise and trial-and-error testing. In this work we introduce a characterization of application I/O based on a combination of job-level and filesystem-level aggregation. We will show how this characterization may be used to analyze parallel I/O performance to not only validate I/O best practices but also communicate benefits in a user centric way. Keywords-Parallel I/O; Filesystems; HPC
The algorithms foundational to visualization are central to the production visualization tools running at computing centers around the world and consume tremendous amounts of finite, limited resources. We believe that understanding the performance characteristics of these algorithms is critical in being good stewards of computational centers' resources. In this paper, we report initial studies on one such foundational algorithm: parallel particle advection. We have performed an extensive parameter study of the de facto standard algorithm that is commonly used in parallel production visualization tools as well as for in situ visualization environments. Our study has shown that the default parameters used in this algorithm lead to generally poor results, and identify settings that optimized performance on the system in our parameter sweep.
With exascale computing on the horizon, reducing performance variability in data management tasks (storage, visualization, analysis, etc.) is becoming a key challenge in sustaining high performance. This variability significantly impacts the overall application performance at scale and its predictability over time. In this article, we present Damaris, a system that leverages dedicated cores in multicore nodes to offload data management tasks, including I/O, data compression, scheduling of data movements, in situ analysis, and visualization. We evaluate Damaris with the CM1 atmospheric simulation and the Nek5000 computational fluid dynamic simulation on four platforms, including NICS’s Kraken and NCSA’s Blue Waters. Our results show that (1) Damaris fully hides the I/O variability as well as all I/O-related costs, thus making simulation performance predictable; (2) it increases the sustained write throughput by a factor of up to 15 compared with standard I/O approaches; (3) it allows almost perfect scalability of the simulation up to over 9,000 cores, as opposed to state-of-the-art approaches that fail to scale; and (4) it enables a seamless connection to the VisIt visualization software to perform in situ analysis and visualization in a way that impacts neither the performance of the simulation nor its variability. In addition, we extended our implementation of Damaris to also support the use of dedicated nodes and conducted a thorough comparison of the two approaches—dedicated cores and dedicated nodes—for I/O tasks with the aforementioned applications.
As parallel I/O subsystem in large-scale supercomputers is becoming complex due to multiple levels of software libraries, hardware layers, and various I/O patterns, detecting performance bottlenecks is a critical requirement. While there exist a few tools to characterize application I/O, robust analysis of file system behavior and associating file-system feedback with application I/O patterns are largely missing. Toward filling this void, we introduce Lustre IO Profiler, called LIOProf, for monitoring the I/O behavior and for characterizing the I/O activity statistics in the Lustre file system. In this paper, we use LIOProf for both uncovering pitfalls of MPI-IO’s collective read operation over Lustre file system and identifying HDF5 overhead. Based on LIOProf characterization, we have implemented a Lustre-specific MPI-IO collective read algorithm, enabled HDF5 collective metadata operations and applied HDF5 datasets optimization. Our evaluation results on two Cray systems (Cori at NERSC and Blue Waters at NCSA) demonstrate the efficiency of our optimization efforts.
While many parallel visualization tools now provide in situ visualization capabilities, the trend has been to feed such tools with large amounts of unprocessed output data and let them render everything at the highest possible resolution. This leads to an increased run time of simulations that still have to complete within a fixed-length job allocation. In this paper, we tackle the challenge of enabling in situ visualization under performance constraints. Our approach shuffles data across processes according to its content and filters out part of it in order to feed a visualization pipeline with only a reorganized subset of the data produced by the simulation. Our framework leverages fast, generic evaluation procedures to score blocks of data, using information theory, statistics, and linear algebra. It monitors its own performance and adapts dynamically to achieve appropriate visual fidelity within predefined performance constraints. Experiments on the Blue Waters supercomputer with the CM1 simulation show that our approach enables a 5x speedup with respect to the initial visualization pipeline and is able to meet performance constraints.
As parallel I/O subsystem in large-scale supercomputers is becoming complex due to multiple levels of software libraries, hardware layers, and various I/O patterns, detecting performance bottlenecks is a critical requirement. While there exist a few tools to characterize application I/O, robust analysis of file system behavior and associating file-system feedback with application I/O patterns are largely missing. Toward filling this void, we introduce Lustre IO Profiler, called LIOProf, for monitoring the I/O behavior and for characterizing the I/O activity statistics in the Lustre file system. In this paper, we use LIOProf for uncovering pitfalls of both MPI-IO’s collective read operation over Lustre file system and identifying HDF5 overhead. Based on LIOProf characterization, we have implemented a Lustre-specific MPI-IO collective read algorithm, enabled HDF5 collective metadata operations and applied HDF5 datasets optimization. Our evaluation results on two Cray systems (Cori at NERSC and Blue Waters at NCSA) demonstrate the efficiency of our optimization efforts.
The scientific visualization community increasingly questions the use of rainbow colormaps. This is not unfounded as significant problems are readily seen in a luminance plot of the rainbow colormap. Many good, generally applicable colormaps are proposed as direct replacements for the rainbow. However, there are still many who choose rainbows and like them. Would a colormap with perfect luminance and the chromaticity of a rainbow find a wider audience? This was our motivation in studying the range of chromatic effects arising from luminance corrections. Consequently we developed a framework for adjusting colormaps to various degrees which produces favorable results on a wide range of colormaps. In this work we will detail this framework and demonstrate its effectiveness on several colormaps.
 Tom Peterka合作论文数Argonne National Laboratory9
 Gabriel Antoniu合作论文数INRIA Rennes – Bretagne Atlantique Research Center;IRISA9
 Matthieu Dorier合作论文数Argonne National Laboratory9
 Kalyana Chadalavada合作论文数HPCC Enterprise Solutions Engineering, Dell Inc6
 Dave Pugmire合作论文数Computer Science and Mathematics Division, Oak Ridge National Laboratory5
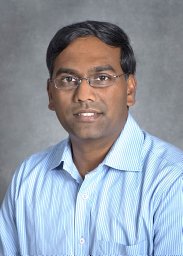 Surendra Byna合作论文数Lawrence Berkeley National Laboratory4
 Leigh Orf合作论文数Department of Geology and Meteorology, Central Michigan University4
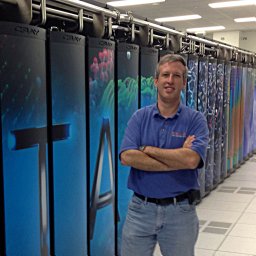 Sean Ahern合作论文数Oak Ridge National Laboratory4
 Jian Huang合作论文数3
 Franck Cappello合作论文数Mathematics and Computer Science Division, Argonne National Laboratory3
 Jeremy S. Meredith合作论文数Oak Ridge National Laboratory3
 Gregory H. Bauer合作论文数Graduate School of Business Administration;University of Rochester;Graduate School of Business Administration, University of Rochester3
 Shadi Ibrahim合作论文数INRIA3Luc Bougé合作论文数KerData Team at IRISA and INRIA Rennes - Bretagne Atlantique Research Center.3
 Mohammad H. Raji合作论文数Department of Mechanical Engineering, Sharif University of Technology3
 J. Fullop合作论文数3
 Orcun Yildiz合作论文数2Silvio Rizzi合作论文数2
 John A Schmidt合作论文数2
 Leonardo Arturo Bautista-Gomez合作论文数INRIA, Tokyo Institute of Technology2
 Peter Messmer合作论文数2Allen R. Sanderson合作论文数University of Utah2
 Venkatram Vishwanath合作论文数Argonne Natl Lab2
 Forrest M. Hoffman合作论文数Computational Sciences & Engineering Division, Oak Ridge National Laboratory;Climate Change Science Institute, Oak Ridge National Laboratory;Department of Civil & Environmental Engineering, College of Engineering, University of Tennessee, Knoxville2
 Kenneth Moreland合作论文数Oak Ridge National Laboratory2
 Quincey Koziol合作论文数The HDF Group, Champaign, IL2
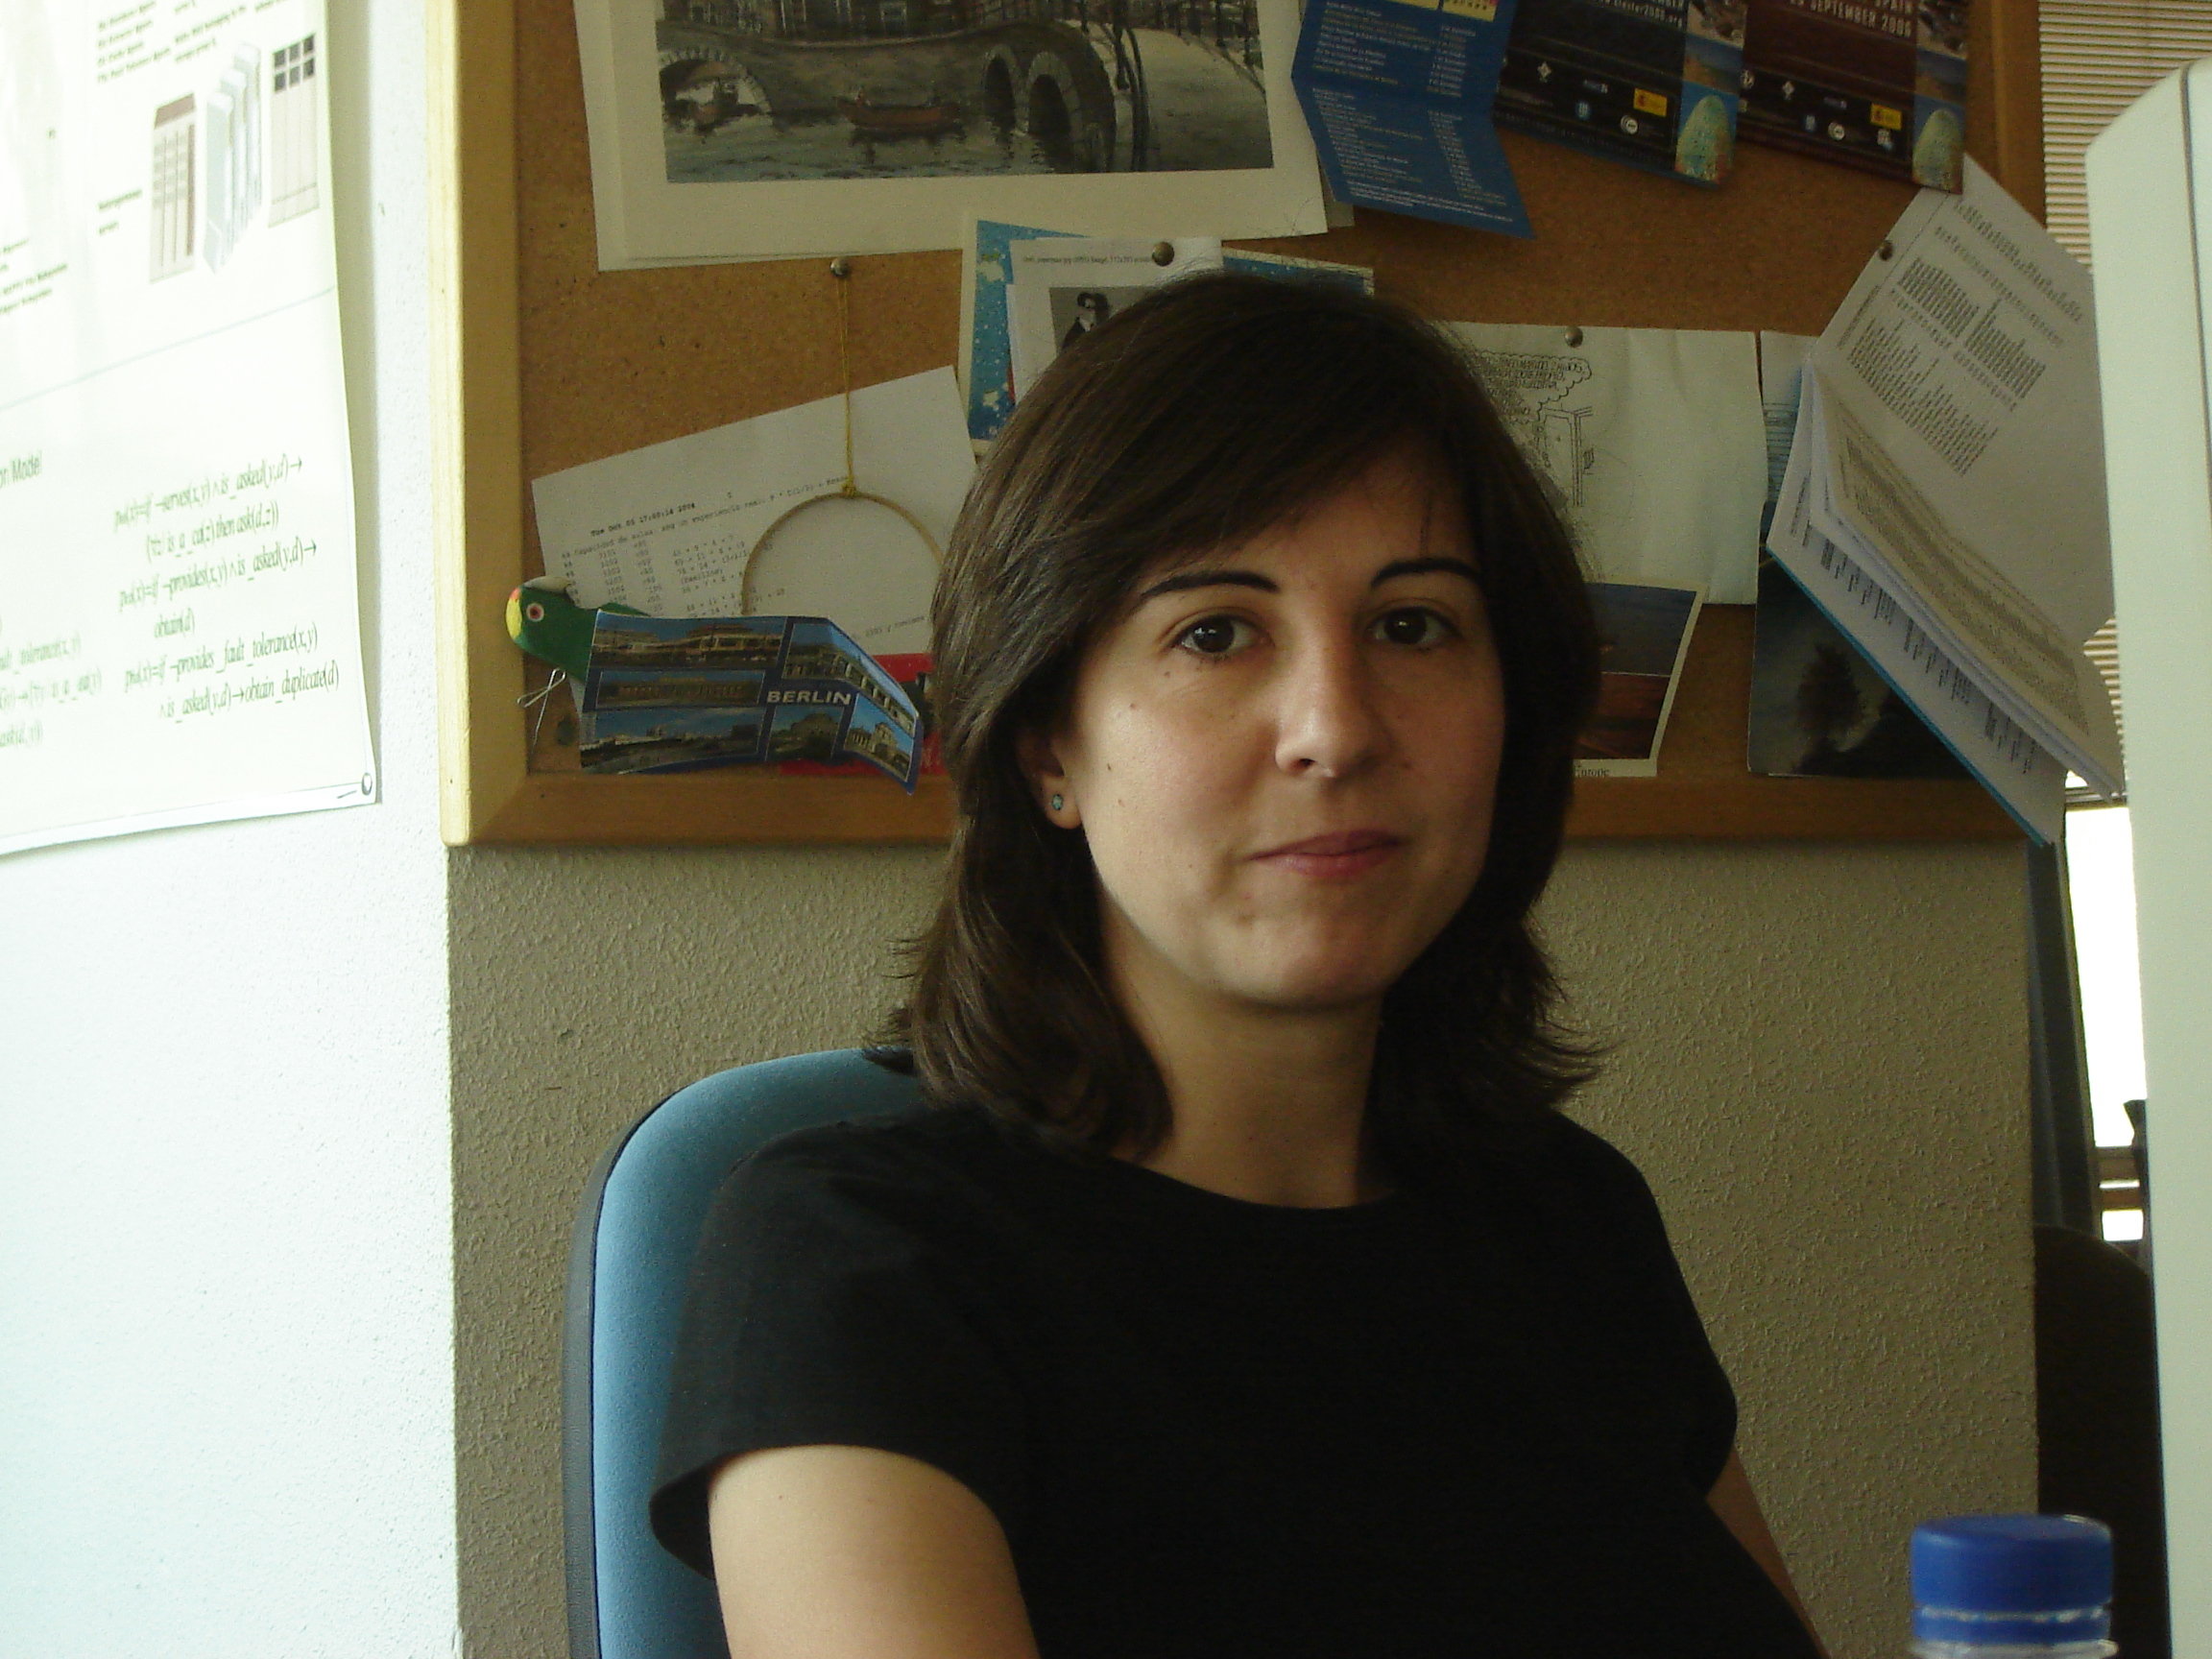 M. S. Pérez合作论文数Dept. de Arquitectura y Tecnolog??a de Sistemas Inform??ticos;Universidad Polit??cnica de Madrid;Facultad de Inform??tica2
 Marc Snir合作论文数Department of Computer Science, Siebel School of Computing and Data Science, The Grainger College of Engineering, University of Illinois at Urbana-Champaign2
 Vishwanath Venkatesan合作论文数Department of Computer Science, University of Houston2
 Alan Humphrey合作论文数2
 Alexandru Costan合作论文数INRIA Rennes - Bretagne Atlantique2
 George Ostrouchov合作论文数Department of Business Analytics & Statistics, Haslam College of Business, The University of Tennessee, Knoxville2
 Brett M. Bode合作论文数Department of Chemistry, Iowa State University2Chad Jones合作论文数1Sudhanshu Sane合作论文数1Tom Uram合作论文数1Andrew C. Bauer合作论文数1Andy J Nonaka合作论文数1Joe Insley合作论文数1
 Scot Breitenfeld合作论文数1
 Steffen Frey合作论文数Bernoulli Institute, Faculty of Science and Engineering, University of Groningen1
 Michael Kuhn合作论文数Otto von Guericke University Magdeburg1jean m favre合作论文数1E. Brugger合作论文数1
 Neil Fortner合作论文数1
 Matthew Larsen合作论文数Lawrence Livermore National Laboratory1
 James Kress合作论文数Oak Ridge Natl Lab, Oak Ridge, TN 37831 USA1




