Most proteins exert their functions in complex with other interactors. Single mutations can exhibit a profound impact on perturbing protein interactions, leading to human disease. However, predicting the effect of single mutations on protein interactions remains a major computational challenge. Deep learning, particularly protein language models or transformers, has become an effective tool in bioinformatics for protein structure prediction. However, the functional divergence of mutations makes it difficult to predict their interaction perturbation profiles. To address this fundamental challenge, we present eSIG-Net (edgetic mutation Sequence-based Interaction Grammar Network), a novel sequence-based "Interaction Language Model" for predicting protein interaction alterations caused by single mutations. eSIG-Net combines various protein sequence embeddings, introduces a mutation-encoding module with syntax and evolutionary insights, and employs contrastive learning to evaluate mutation-induced interaction changes. eSIG-Net significantly outperforms current state-of-the-art sequence-based and structure-based prediction methods at predicting mutational impact on protein interactions. We highlight examples where eSIG-Net nominates causal variants with high confidence and elucidates their functional role under relevant biological contexts. Together, eSIG-Net is a first-in-kind "interaction language model" that can accurately predict interaction-specific rewiring by single mutations with only sequence information, and exhibits generalizability across biological contexts.
Supplementary Figure S5. Overall survival in patients with or without baseline liver metastases.
<p>Supplementary Figures 1-10. Figure-S1. Immune score prediction of response to PD-1 immune checkpoint blockade; Figure-S2. Immune mutation burden in cancer; Figure-S3. Transcriptome alteration of immunome in cancer; Figure-S4. Enrichment of differentially expressed genes (DEGs) in immunological gene signatures; Figure-S5. Immune infiltration score in cancer; Figure-S6. Candidate immune responder genes in cancer; Figure-S7. The ROC curves for different signatures in two datasets; Figure-S8. Barplots showing the AUCs of different signatures across 17 datasets; Figure-S9. CNV alteration and QTL of immune-related genes; Figure-S10. QTLs of immune-related genes across cancer types.</p>
Supplementary Figure 3. Effects of MLN8237 on markers of apoptosis and senescence. A-B) Immunofluorescence analysis of p53 wildtype CAL-51 TNBC cell line stably transfected with a p73 shRNA construct (p73-55).
Supplemental Table 1: Molecular and clinical characteristics of the 10 CRC explants used in the PDX model experiments. Seven explants have a KRAS mutation, 4 have a PIK3CA mutation, and none have a BRAF mutation. Over half of the explants came from patients who had previously received treatment for mCRC. Supplemental Table 2: Using DCE-MRI measurements, treatment with cabozantinib demonstrated significant decrease in vascularity on day 28 compared to baseline and day 7. Regorafenib treatment did not demonstrate a decrease in vascularity. Supplemental Table 3: [18F] FDG-PET imaging revealed significantly reduced FDG avidity on days 7 and days 28 of cabozantinib treatment compared to baseline, whereas FDG avidity did not diminish in the regorafenib treated explants. Supplemental Table 4: To better understand the potential metabolic effects of cabozantinib, we analysed signalling pathways involved in metabolism using the KEGG database. Receptor tyrosine kinase (RTK) assay revealed a decrease in many of the pathways responsible for cell metabolism after 3 days of cabozantinib treatment in three of the sensitive CRC explants. Supplemental Figure 1: Cabozantinib and regorafenib treatment in a Humanized HGF mouse model. Cabozantinib had greater antitumor effects when compared to regorafenib in the hHGF scid mice in CRC203 and CRC020. Similar results were observed when compared to athymic nude mice for CRC203 (REG TGII: 39.3, Cabo TGII: 14.93) and CRC020 (REG TGII: 17.5, Cabo TGII: -5.68). Supplemental Figure 2: Changes in TIE2 and VEGFR2 expression were variable and did not demonstrate a sustained decrease after treatment with regorafenib. Supplemental Figure 3: After 7 days of regorafenib treatment, there was no significant reduction in activation of p-AXL, AKT, and pS6 compared to control, and there was a variable trend in p-MET and p-RET levels as measured by RTK assay. Supplemental Figure 4: Regorafenib treatment led to decreased ATG3, LC3A/B, and beclin-1 in the CRC098 explant; however, levels of these enzymes increased in the CRC162 explant. Supplemental Figure 5: In vitro analysis of caspase 3/7 expression in cell lines HCT116 (a, c) and HT29 (b, d) after cabozantinib and crizotinib treatment showed significant increase in autophagy index relative to control*** and to regorafenib###. Caspase 3/7 expression was measured via fluorescence using the CYTO-ID® Autophagy Detection Kit. Crizotinib combined with SBI-020695, an anti-ULK-1 agent, did not result in increased caspase 3/7 expression, whereas caspase 3/7 expression significantly increased with cabozantinib plus SBI-020695.
Supplementary Table 2 - PDF file 62K, Suppl Table 2 IC50s for single agents and combination
<p>Table S3. Critical regions of immunological genes that are associated with immune response in cancer.</p>
CCR Translation for This Article from Development of an Integrated Genomic Classifier for a Novel Agent in Colorectal Cancer: Approach to Individualized Therapy in Early Development
Supplementary Data from Preclinical Development of the Class-I–Selective Histone Deacetylase Inhibitor OKI-179 for the Treatment of Solid Tumors
Supplementary Table 3: Quantification of total cell counts and average cellular size under conditions depicted in Fig. 4A.
 Todd M Pitts合作论文数Anschutz Med Campus, Univ Colorado108
 John J Tentler合作论文数80
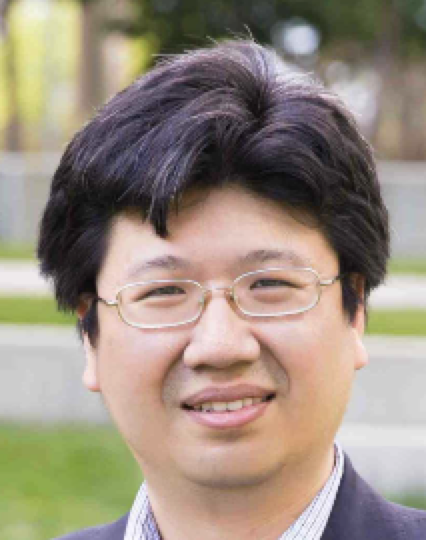 Aik Choon Tan合作论文数Department of Oncologic Sciences, University of South Florida;Huntsman Cancer Institute, Department of Oncological Sciences, University of Utah80
 Stephen Leong合作论文数Division of Medical Oncology, University of Colorado Cancer Center55
 Wells Messersmith合作论文数Department of Medicine-Medical Oncology, University of Colorado54
 Eric Rowinsky合作论文数School of Medicine, New York University52
 Daniel D. Von Hoff合作论文数Translational Genomics Research Institute;HonorHealth Clinical Research Institute;Mayo Clinic47
 Diamond Jennifer R合作论文数43Lia Gore合作论文数39
 Selby Heather合作论文数39
 Anna Spreafico合作论文数University of Toronto;Division of Medical Oncology and Hematology, Princess Margaret Cancer Centre, University Health Network31Newton Timothy P合作论文数31
 Christopher Lieu合作论文数Division of Medical Oncology, Department of Medicine, School of Medicine, University of Colorado;University of Colorado Cancer Center;University of Colorado Hospital31
 Stacey M Bagby合作论文数27Kulikowski Gillian N合作论文数21Geoffrey R. Weiss合作论文数21Arcaroli John J合作论文数19La Hammond合作论文数18
 Lillian Siu (萧丽欣)合作论文数Cancer Clinical Research Unit, Princess Margaret Cancer Centre;University of Toronto;Ontario Institute for Cancer Research;Princess Margaret Hospital18McManus Martine C合作论文数18Kachaeva Maria I合作论文数18
 Miguel Villalona Calero合作论文数Chao Family Comprehensive Cancer Center, University of California, Irvine18M Kraynak合作论文数17S. Diab合作论文数17Flanigan Sara A合作论文数17Klauck Peter J合作论文数17Davis S Lindsey合作论文数Department of Medical Oncology, University of Colorado Cancer Center17
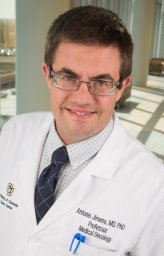 Antonio Jimeno合作论文数The Sidney Kimmel Comprehensive Cancer Center, Johns Hopkins University School of Medicine17
 Daniel L Gustafson合作论文数17D.R. Camidge合作论文数16S Holden合作论文数16
 Sharyn Baker合作论文数Division of Pharmaceutics and Pharmacology, College of Pharmacy, The Ohio State University;Comprehensive Cancer Center, The Ohio State University16Manuel Hidalgo Medina合作论文数16
 Roy S. Herbst合作论文数Yale Cancer Center, School of Medicine, Yale University15Anastasia A. Ionkina合作论文数14M. Basche合作论文数14Lisa A. Hammond合作论文数14
 D. Ross Camidge合作论文数Division of Medical Oncology, School of Medicine, University of Colorado13Spratlin Jennifer L合作论文数13CD Britten合作论文数12Cindy O'Bryant合作论文数12
 Howard A. Skip Burris III合作论文数Sarah Cannon Research Institute12C Aylesworth合作论文数11J G Kuhn合作论文数11M Morrow合作论文数11Anna Capasso合作论文数11
 Amita Patnaik合作论文数South Texas Accelerated Research Therapeutics;Division of Medical Oncology, University of Texas Health Science Center at San Antonio11L Smetzer合作论文数10Lindsey N Micel合作论文数10




