This article presents a Virtual Reality (VR) tour designed to preserve the cultural heritage of Majuli Island, the world's largest river island, located in northeastern India. Facing severe erosion from the Brahmaputra River, Majuli's rich cultural heritage is at risk. Our VR tour aims to safeguard and showcase both tangible and intangible aspects of the island's heritage using multimodal content, including 360-degree images, videos, drone footage, and textual information. The system features teleportation, virtual vehicles, maps for global and local navigation, and an interactive virtual tablet to enhance user experience. We discuss the design, implementation, and evaluation of the VR tour, with a study of N = 27 participants to assess user presence, the effectiveness of capturing Majuli's heritage, and any cybersickness. Results show that the VR tour successfully represented the island's heritage and provided a strong sense of presence, but also led to increased oculomotor symptoms after the tour. This immersive VR experience aims to preserve Majuli's cultural legacy for future generations.
Cybersickness (CS), also known as visually induced motion sickness (VIMS) is a condition that can affect individuals when they interact with virtual reality (VR) technology. This condition is characterized by symptoms such as nausea, dizziness, headaches, eye fatigue, etc., and can be caused by a variety of factors. Finding a feasible solution to reduce the impact of CS is extremely important as it will greatly enhance the overall user experience and make VR more appealing to a wider range of people. We have carefully compiled a list of 223 highly pertinent studies to review the current state of research on the most essential aspects of CS. We have provided a novel taxonomy that encapsulates various aspects of CS measurement techniques found in the literature. We have proposed a set of CS mitigation guidelines for both developers and users. We have also discussed various CS-inducing factors and provided a taxonomy that tries to capture the same. Overall, our work provides a comprehensive overview of the current state of research in CS with a particular emphasis on different measurement techniques and CS mitigation strategies, identifies research gaps in the literature, and provides recommendations for future research in the field.
Walking through a virtual environment is significant in many virtual reality applications. To provide a realistic walking experience, researchers have developed many virtual locomotion techniques where users provide constant input for walking. Usually, the user’s continuous input is mapped with the visual stimulus to make the user experience walking in the virtual environment. However, system-automated virtual tours allow the users to navigate in the virtual environment without any continuous input for travelling, leaving no room for mapping user input with walking. Due to its low interaction fidelity, it is less preferred to implement realistic walking for a system-automated tour. In order to improve the walking realism (visually), in this work, we have proposed an instantaneous walking speed prediction model for a system-automated tour. We built and validated the model by collecting walking data from 40 users. The model was then evaluated with the help of an empirical study (N = 34). We found that using the speed predicted by the model as the visual optic flow can enhance the realistic walking experience than using a constant average walking speed. This work may motivate the developers and researchers to incorporate realistic walking experiences on a system-automated virtual tour.
When navigating through 3D environments from a first-person perspective, the limited field-of-view poses challenges in locating off-screen Points Of Interest (POIs), particularly when using the compact screen of a mobile phone. Existing techniques for visualizing off-screen POIs tend to clutter the screen, negatively affecting the visualization’s overall effectiveness. To resolve this problem, we propose a method for displaying off-screen POIs in high-density settings (with over 15 POIs). The proposed approach uses 3D arrows placed along the edges of the smartphone screen to point to the POIs. To minimize clutter, a cluster of POIs is represented by a single 3D arrow pointing to the cluster’s centroid. A model known as the cluttering threshold has also been developed to determine the number of POIs to include in a cluster while maintaining direction information. Additionally, a distance filter is implemented to reduce clutter in dense environments. The effectiveness of the proposed system was evaluated using a within-subject study involving 16 participants. The results indicate that our approach is considerably more efficient and accurate than the current state-of-the-art systems, namely, 3DWedge+ and Halo3D, particularly when the number of POIs in the environment is high.
The application of machine learning (ML) has grown and is now used to enhance learning outcomes. In blended classroom settings, ML, emerging smartphones and wearable technologies are commonly used to improve teaching and learning. The combination of these advanced technologies and ML plays a crucial role in enhancing real-time feedback quality. However, there are abundant scopes of improvement and strong need for further careful investigations in this area. We propose an ML-based intelligent real-time feedback system to address current research challenges for blended classrooms. The proposed system provides real-time feedback to students and teachers. We build an Android application for our intelligent feedback interfaces. The user interfaces use students' academic performance prediction models with real-time states and dynamic feedback timings based on historic feedback statistics. In addition, the feedback scheduling algorithms, choices of peripheral devices for real-time feedback, and feedback modalities to optimize fatigue make our system interfaces intelligent and novel. The end users well-received the intelligent features and technology of the proposed system. Our empirical findings indicate that unique design elements, such as dynamic timing, choice of peripheral devices, and modalities of real-time feedback, are crucial in integrating the system with blended classes. The intelligent characteristics of the proposed system have been appreciated by a large proportion of the end-users (90.90% of teachers and 84.21% of students) for use in real-time blended classroom environments. The higher comparative system usability scale (SUS) scores with benchmarks show real promise of the system design.
Classroom monitoring using information communications technology (ICT) plays a significant role in enhancing teaching-learning in a blended learning environment. Learning analytics (LA) is such a popular classroom monitoring tool. LA helps teachers to the collection, interpretation, and analysis of students performance data generated during teaching and learning process. However, designing interactive LA is challenging for real-time blended classroom use. We observed significant flaws in handling large classroom monitoring challenges in a state-of-the-art system. To address those flaws and challenges, we propose the “Manas Chakshu” - a real-time ICT-based interactive LA for large blended classrooms. The core idea of the visual LA system consists of two interactive levels. The overview and the overview+detail levels are used to optimize the screen-area utilization of the available display. The system computes classroom status with the help of novel weighted states and Euclidian distance for highlighting critical classroom regions. We compare the theoretical performance of our aid with the state-of-the-art system. We found that Manas Chakshu performed better in 89.12% of the cases based on theoretical performance analysis. We also implemented Manas Chakshu as an Android application and conducted an empirical study with 39 teachers. Study results show that our system reduces average classroom monitoring time by 27.96% compared to the state-of-the-art system. We found the perceived usability in terms of teachers’ satisfaction, efficiency, and learnability ratings of the proposed system were high. The average mean ratings on a five-point Likert scale are 4.06, 3.86, and 4.02. The results show the perceived usabilities and high system usability scale (SUS) scores (average 76.86) of the proposed system were highly acceptable to the teachers.
In an asynchronous e-learning, students find themselves all alone in their learning process. This feeling of loneliness results in frustration and loss of motivation, leading to a high drop-out rate. Tracking engagement while the student is learning allows intervention at an appropriate time. Instructors are overwhelmed by data reports provided to them in the online courses. In this work, the researchers proposed a student engagement visualization dashboard that visualizes the instantaneous engagement levels every minute, visualizes trends of student engagement levels, and filters and displays the least engaged learner to address the above challenges. The researchers also evaluated the usability of this visualizer in a controlled experiment and found out that the perceived usefulness by the teachers was high. The visualizer allows teachers to gain insight into the engagement levels of all the students at a glance. It will also allow the teacher to take immediate action.
In asynchronous e-learning, students find themselves all alone in their learning process. This feeling of loneliness mostly results in frustration and loss of motivation, leading to a high drop-out rate. Tracking engagement while the student is learning allows intervention at an appropriate time. However, instructors may get overwhelmed by data provided to them in the online courses. In our work, we propose a student engagement visualization dashboard that visualizes the instantaneous engagement levels every minute, visualizes trends of student engagement levels and filters and displays the least engaged learner to address the above challenges. We visualized engagement levels that were predicted from a model. We also evaluated the usability of this visualizer in a controlled experiment and found out that the perceived usefulness by the teachers was high. The visualizer allows teachers to gain insight into the engagement levels of all the students at a glance. It also allows the teacher to take immediate action.
Designing peripheral warnings and notifications to support teaching-learning is progressively increasing. However, existing work usually fails to effectively integrate real-time alerts and tackle poor students in a blended classroom. We present an in-class multimodal alert method for teachers and students to address the challenges. The system utilizes performance prediction and classification of students for real-time alert. The classification of students based on course performance helped in optimizing the number of alerts. The peripheral device selection aided in preventing the disruption in the lecture follow. Moreover, alert content delivery timing (start, during, and end of the class session) is used to reduce alert fatigue. We reported the design and the initial study results. The results show that 25 teachers and students reacted positively to the system design, technology, and features.
Augmented Reality (AR) applications often need to represent the user's points of interest (POIs) on the handheld display. Because of the limited field of view, certain POIs remain off-screen. In order to make the user aware of the off-screen POIs, researchers have proposed many visualization techniques. However, those techniques are not suitable for visualizing the vertically spread off-screen POIs. Moreover, visualizing many off-screen POIs (for a dense environment) on the device screen may create visual clutter. Addressing these issues, in this paper, we present AroundArrow, a technique to visualize off-screen POIs using 3D arrows. We use a decluttering technique that uses a system-independent recommendation system to prioritize POIs on directional basis. We evaluated this technique by comparing it with the state of the art techniques, namely Halo3d and Arrow2D. We found that AroundArrow performs significantly better than these techniques for distinguishing the distribution of off-screen POIs in terms of verticality. For the decluttering system, an empirical study was performed to establish an ideal range of a parameter, namely Cluttering Threshold (CT).
The duration of a virtual reality tour can be a crucial factor in affecting user experience. Lengthy exposure to a virtual environment can cause severe health issues similar to motion sickness, and wearing the Head-Mounted Display for a long duration can make the user fatigued. Minimising the duration of VR exposure can always help in addressing these issues. In this work, we have proposed an approach to minimise the duration of a system-controlled virtual tour by optimising the path connecting all the sites of the virtual environment. To optimise the duration, we theoretically compute the optimal time and the path to cover all the places of a virtual environment by reducing the problem to the famous Vehicle Routing Problem (VRP). Following our approach, we have also created a VR tour for the largest river island in the world, Majuli (Assam, India).
Students in the online learning who have other responsibilities of life such as work and family face attrition. Constructing a model of engagement with smallest granule of time has not been implemented widely, but implementing it is important as it allows to uncover more subtle patterns. We built a student engagement prediction model using 9 features that were significant out of 13 features to affect the levels of student engagement and emerged in the final model. The student engagement prediction model was built using non-linear regression technique from three factors: behavioral, collaboration and emotional factors across micro level time scale such as 5 minutes to identify at risk students as quickly as possible before they disengage. The accuracy of the model was found to be 83.3%. The results of the study will give teachers the chance to provide early interventions and guidelines for designing online learning activities.
Travelling is one of the significant interactions in virtual reality (VR). Until now, researchers have come up with many Virtual Locomotion Techniques (VLT) to supply natural, efficient and usable ways of navigating in VR while not causing VR sickness. Stationary VLTs are those which does not demand any physical movement from the user to travel in the virtual environment. In order to improve the experience of walking in this VLT, it is essential to show the view transition speed that mimics the natural walking speed of the user. In this paper, we describe a within-subject study that was performed to establish a range of perceptually natural walking speeds while being stationary. In the study, we provided vibrotactile feedbacks behind the ears of the subjects to avoid motion sickness. The subjects were exposed to visuals with gains ranging from 1.0 to 3.0. The slowest speed was the estimated natural speed of the user, and the highest speed was three times faster than this. The perceived naturalness of the speed was evaluated using the self-report. We found the range of the visual gain to be 1.40 to 1.78.
In improving the teaching and learning experience in a classroom environment, it is crucial for a teacher to have a fair idea about the students who need help during a lecture. However, teachers of large classes usually face difficulties in identifying the students who are in a critical state. The current methods for classroom visualization are limited in showing both the status and location of a large number of students in a limited display area. Additionally, comprehension of the states adds cognitive load on the teacher working in a time-constrained classroom environment. In this article, we propose a two-level visualizer for large classrooms to address the challenges. In the first level, the visualizer generates a colored matrix representation of the classroom. The colored matrix is a quantitative illustration of the status of the class in terms of student clusters. We use three colors: red, yellow, and green, indicating the most critical, less critical, and the normal cluster on the screen, respectively. With tap/click on the first level, detailed information for a cluster is visualized as the second level. We conducted extensive studies for our visualizer in a simulated classroom with 12 tasks and 27 teacher participants. The results show that the visualizer is efficient and usable.
User attentional analyses on web elements help in synthesis and rendering of webpages. However, majority of the existing analyses are limited in incorporating the intrinsic visual features of text and images. This study aimed to analyze the influence of elements’ visual features (font-size, font-family, color, etc., for text; and brightness, color, intensity, etc., for images) besides their position on users’ free-viewing visual attention. The investigation includes: (i) user’s position-based attention allocation on text and image web elements, (ii) identification of informative visual features with respect to the attention, (iii) performance of informative visual features in predicting the ordinal visual attention (fixation-indices). Towards the study, an eye-tracking experiment was conducted with 42 participants on 36 real-world webpages. The analyses revealed: (i) Though users predominantly allocate the initial attention to MiddleCenter}, MiddleLeft, TopCenter, TopLeft regions, the elements in Right and Bottom regions are not completely ignored; (ii) Space -related (column-gap, line-height, padding) and font Size -related (font-size, font-weight) intrinsic text features, and Mid-level Color Histogram intrinsic image features are informative, while position and size are informative for both the types; (iii) the informative visual features predict the ordinal visual attention on an element with 90% average accuracy and 70% micro-F1 score. Our approach finds applications in element-granular web-designing and user attention prediction.
Travelling speed plays an essential role in the overall user experience while navigating inside a virtual environment. Researchers have used various travelling speed that matches the user speed profile in order to give a natural walking experience. However, predicting a user’s instantaneous walking speed can be challenging when there is no continuous input from the user. Target selection-based techniques are those where the user selects the target to reach there automatically. These techniques also lack naturalness due to their low interaction fidelity. In this work, we have proposed a mathematical model that can dynamically compute the instantaneous natural walking speed while moving from one point to another in a virtual environment. We formulated our model with the help of user studies.
Consideration of affective states of students in the teaching-learning process is very important. However, it is cumbersome for a teacher to detect the states in real-time, especially in a large classroom. Although literature contains many techniques for systematic detection of the affective states, most of them either are expensive both in terms of computational and economical aspects or do not fit in the classroom environment. Assuming a blended learning environment comprising smartphones, we have proposed a process model to detect the affective states of the students. Empirical studies affirm that the model is able to detect the states with high accuracy. Apart from training and testing the model with affective data collected through a novel game designed by us, the model has been additionally validated with EEG signals of thirty six participants.
The attentional analysis on graphical user interfaces (GUIs) is shifting from Areas-of-Interest (AOIs) to Data-of-Interest (DOI). However, the heterogeneity data modalities on GUIs hinder the DOI-based analyses. To overcome this limitation, we present a Canonical Correlation Analysis (CCA) based approach to unify the heterogeneous modalities (text and images) concerning user attention. Especially, the influence of interface and user idiosyncrasies in establishing the cross-modal correlation is studied. The performance of the proposed approach is analyzed for free-viewing eye-tracking experiments conducted on bi-modal webpages. The results reveal: (i) Cross-modal text and image visual features are correlated when the interface idiosyncrasies, alone or along with user idiosyncrasies, are constrained. (ii) The font-families of text are comparable to color histogram visual features of images in drawing the users’ attention. (iii) Text and image visual features can delineate the attention of each other. Our approach finds applications in user-oriented webpage rendering and computational attention modeling.
Quantifying and predicting the user attention on web image elements finds applications in synthesis and rendering of elements on webpages. However, the majority of the existing approaches either overlook the visual characteristics of these elements or do not incorporate the users’ visual attention. Especially, obtaining a representative quantified attention (for images) from the attention allocation of multiple users is a challenging task. Toward overcoming the challenge for free-viewing attention, this paper introduces four weighted voting strategies to assign effective visual attention (fixation index (FI)) for web image elements. Subsequently, the prominent image visual features in explaining the assigned attention are identified. Further, the association between image visual features and the assigned attention is modeled as a multi-class prediction problem, which is solved through support vector machine-based classification. The analysis of the proposed approach on real-world webpages reveals the following: (i) image element’s position, size and mid-level color histograms are highly informative for the four weighting schemes; (ii) the presented computational approach outperforms the baseline for four weighted voting schemes with an average accuracy of 85% and micro F1-score of 60%; and (iii) uniform weighting (same weight for all FIs) is adequate for estimating the user’s initial attention while the proportional weighting (weight the FI in proportion to its likelihood of occurrence) extends to the latter attention prediction.
Aesthetics measurement is important in determining and improving the usability of a webpage. Wireframe models, the collection of the rectangular objects, can approximate the size and positions of the different webpage elements. The positional geometry of these objects is primarily responsible for determining aesthetics as shown in studies. In this work, the authors propose a computational model for predicting webpage aesthetics based on the positional geometry features. In this study, the authors found that ten out of the thirteen reported features are statistically significant for webpage aesthetics. Using these ten features, the authors developed a computational model for webpage aesthetics prediction. The model works on the basis of support vector regression. The authors rated the wireframe models of 209 webpages by 150 participants. The average users' ratings and the ten significant features' values were used to train and test the aesthetics prediction model. Five-fold cross-validation technique shows the model can predict aesthetics with a Root Mean Square Error (RMSE) of only 0.42.
 Anupam Basu合作论文数Faculty at School of Engineering, Shiv Nadar University;Sister Nivedita University9
 Sandeep Vidyapu合作论文数IIT Guwahati, India8
 Nilotpal Biswas合作论文数Indian Institute of Technology Guwahati7
 Ranjan Maity合作论文数indian institute of technology guwahati7
 Debasis Samanta合作论文数Department of Computer Science and Engineering, Indian Institute of Technology7
 V. Vijaya Saradhi合作论文数7
 Subrata Tikadar合作论文数Indian Inst Technol Guwahati, Gauhati, India6
 Ujjwal Biswas合作论文数4
 Tamarapalli, V.合作论文数4
 Debangshu Banerjee合作论文数3
 Yogesh Deshpande合作论文数University of Western Sydney3
 Pradeep Yammiyavar合作论文数Indian Institute of Technology3A Basu合作论文数2Arpit Singh合作论文数2
 Nikumani Choudhury合作论文数2
 Monojit Choudhury合作论文数Mohamed bin Zayed University of Artificial Intelligence2
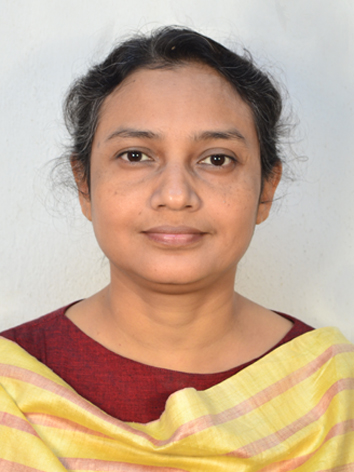 Sudeshna Sarkar合作论文数Computer Science & Engineering Department
Indian Institute of Technology Kharagpur2Siddharth Jain合作论文数1
Sudeshna Sarkar合作论文数Computer Science & Engineering Department
Indian Institute of Technology Kharagpur2Siddharth Jain合作论文数1 Sudhanshu Mittal合作论文数1Sandeep Sarma合作论文数1
 Shrinivas Acharya合作论文数1
 Ananya Jana合作论文数1
 Sudhakar Kumar合作论文数Chandigarh College of Engineering and Technology1Basu, A.合作论文数1Ranti Dev Sharma合作论文数Department of Computer Science, Indian Institute of Technology, Guwahati, India1
 Samarth Tripathi合作论文数Advanced AI LG Electronics1Khade, G.合作论文数1
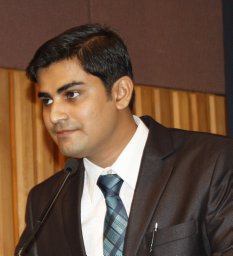 Koushik Chakraborty合作论文数Utah State University1
 Animesh Mukherjee合作论文数Department of Computer Science and Engineering, Indian Institute of Technology, Kharagpur1
 Anand Kumar合作论文数Laboratory of Medical Informatics, University of Pavia1
 Pradipta Biswas合作论文数University of Cambridge1
 Nahar Singh合作论文数National Physical Laboratory (Council of Scientific & Industrial Research), Dr. K.S. Krishnan Road, New Delhi-110012, India1Yedatore Venkatakrishnaiya Venkatesh合作论文数Indian Institute of Technology Madras1Subrata Laha合作论文数1
 Krishna Kumar合作论文数Department of Physics, Faculty of Sciences, Indian Institute of Technology Kharagpur1
 Michael Burch合作论文数Institut fur Visualisierung und Interaktive Systeme, University of Stuttgart1
 Soumyajit Dey合作论文数Indian Institute of Technology Kharagpur1Dipak Bansal合作论文数1
 Susmit Biswas合作论文数Advanced Micro Devices, Inc1




