Global trait axes reveal overarching dimensions of plant functional variation. However, how these dimensions are spatially organized within and across forest types remains unclear. We combined drone-based full-range imaging spectroscopy with crown-level measurements of 16 physiological, morphological and biochemical traits across temperate, subtropical and tropical forests in China to enable spatially-explicit trait mapping. Through site-training scenario, leaf-to-canopy scaling and spectral-domain modelling tests, we find that reliable canopy trait retrieval depends not only on trait and spectral coverage, but also on preserving trait-spectral relationships across sites and scales. Spectral predictions recovered observed multivariate covariation, summarizing crown variation into a leaf-economics dimension and two additional biochemical dimensions related to hydro-thermal regulation and defence/metabolism. Mapping these dimensions revealed distinct community-level trait organization alongside substantial species- and crown-level variation within forests. These findings link remotely sensed trait retrieval to environmental filtering and plant functional differentiation, providing a scalable framework for monitoring forest functional diversity.
AimSuccessional changes in functional diversity provide insights into community assembly by indicating how species are filtered into local communities based on their traits. Here, we assess successional changes in taxonomic and functional richness, evenness and redundancy along gradients of climate, soil pH and forest cover.LocationNeotropics.Time periodLast 0-100 years.Major taxa studiedTrees.MethodsWe used 22 forest chronosequence studies and 676 plots across the Neotropics to analyse successional changes in Hill's taxonomic and functional diversity of trees, and how these successional changes vary with continental-scale gradients in precipitation, soil pH and surrounding forest cover.ResultsTaxonomic and functional richness and functional redundancy increased, while taxonomic and functional evenness decreased over time. Functional richness and evenness changed strongly when not accounting for taxonomic richness, but changed more weakly after statistically accounting for taxonomic richness, indicating that changes in functional diversity are largely driven by taxonomic richness. Nevertheless, the successional increases in functional richness when correcting for taxonomic richness may indicate that environmental heterogeneity and limiting similarity increase during succession. The taxonomically-independent successional decreases in functional evenness may indicate that stronger filtering and competition select for dominant species with similar trait values, while many rare species and traits are added to the community. Such filtering and competition may also lead to increased functional redundancy. The changes in taxonomically-independent functional diversity varied with resource availability and were stronger in harsh, resource-poor environments, but weak in benign, productive environments. Hence, in resource-poor environments, environmental filtering and facilitation are important, whereas in productive environments, weaker abiotic filtering allows for high initial functional diversity and weak successional changes.Main conclusionWe found that taxonomic and functional richness and functional redundancy increased and taxonomic and functional evenness decreased during succession, mainly caused by the increasing number of rare species and traits due to the arrival of new species and due to changing (a)biotic filters.
Urban heat islands (UHIs) are a common phenomenon in metropolitan areas worldwide where the air temperature is significantly higher in urban areas than in surrounding suburban, rural or natural areas. Mitigation strategies to counteract UHI effects include increasing tree cover and green spaces to reduce heat. The successful application of these approaches necessitates a deep understanding of the thermal tolerances in urban trees and their susceptibility to elevated urban temperatures. We evaluated how the photosynthetic thermal optimum (Topt), photosynthetic heat tolerance (T50) and key leaf thermoregulatory morphological traits (leaf area [LA], specific leaf area, leaf width, thickness and leaf dry matter content) differ between conspecific trees growing in 'hot' (UHI) vs 'cool' parts of Montreal, Canada (with a difference of 3.4 degrees C in air temperature), to assess the ability of seven common tree species to acclimation to higher temperatures. We hypothesized that individuals with hotter growing temperatures would exhibit higher Topt and T50, as well as leaf thermoregulatory morphological traits aligned with conservative strategies (e.g., reduced LA and increased leaf mass) compared with their counterparts in the cooler parts of the city. Contrary to our a priori hypotheses, LA increased with growing temperatures and only four of the seven species had higher T50 and only three had higher Topt values in the hotter area. These results suggest that many tree species cannot acclimate to elevated temperatures and that the important services they provide, such as carbon capture, can be negatively affected by high temperatures caused by climate change and/or the UHI effect. The ability vs inability of tree species to acclimate to high temperatures should be considered when implementing long term tree planting programs in urban areas.
Alpine grassland vegetation supports globally important biodiversity and ecosystems that are increasingly threatened by climate warming and other environmental changes. Trait-based approaches can support understanding of vegetation responses to global change drivers and consequences for ecosystem functioning. In six sites along a 1314 m elevational gradient in Puna grasslands in the Peruvian Andes, we collected datasets on vascular plant composition, plant functional traits, biomass, ecosystem fluxes, and climate data over three years. The data were collected in the wet and dry season and from plots with different fire histories. We selected traits associated with plant resource use, growth, and life history strategies (leaf area, leaf dry/wet mass, leaf thickness, specific leaf area, leaf dry matter content, leaf C, N, P content, C and N isotopes). The trait dataset contains 3,665 plant records from 145 taxa, 54,036 trait measurements (increasing the trait data coverage of the regional flora by 420%) covering 14 traits and 121 plant taxa (ca. 40% of which have no previous publicly available trait data) across 33 families.
Foliar traits such as specific leaf area (SLA), leaf nitrogen (N) and phosphorus (P) concentrations play an important role in plant economic strategies and ecosystem functioning. Various global maps of these foliar traits have been generated using statistical upscaling approaches based on in-situ trait observations.Here, we intercompare such global upscaled foliar trait maps at 0.5° spatial resolution (six maps for SLA, five for N, three for P), categorize the upscaling approaches used to generate them, and evaluate the maps with trait estimates from a global database of vegetation plots (sPlotOpen). We disentangled the contributions from different plant functional types (PFTs) to the upscaled maps and characterized the differences between two trait metrics: community weighted mean (CWM) and top-of-canopy weighted mean (TWM).We found that the global foliar trait maps of SLA and N differ drastically and fall into two groups that are almost uncorrelated (for P only maps from one group were available). The primary factor explaining the differences between these groups is the exclusive use of PFT information combined with remote sensing-derived land cover products in one group while the other group mostly relied on environmental predictors. The impact of using TWM or CWM on spatial patterns was considerably smaller than that of including PFT and land cover information. The maps that used PFT and land cover information exhibit considerable similarities in spatial patterns that are strongly driven by land cover. The maps not using PFTs show a lower level of similarity and tend to be strongly driven by individual environmental variables.Overall, the maps using PFT and land cover information better reproduce the between-PFT trait differences and trait distributions of the plot-level sPlotOpen data, while the two groups performed similarly in capturing within-PFT trait variation. Upscaled maps of both groups were moderately correlated to grid-cell-level sPlotOpen data (R = 0.2-0.6), with considerable differences between upscaling approaches and overall higher correlations for SLA and N.Our findings highlight the importance of explicitly accounting for within-grid-cell trait variation, which has important implications for applications using existing maps and future upscaling efforts.
Aim: Andean forests are a global biodiversity hotspot. They harbour many species living within narrow climate ranges and a high functional diversity of trees. It remains still unclear how such hotspots respond to climatic changes over time. We investigated whether Andean forests are changing their functional composition over time along an elevational gradient by assessing changes in species composition, abundance and functional traits.Location: An elevational gradient in Colombia's northern Andes.Time Period: Species composition changes were studied two to four times from 2006 to 2017, and functional composition from 2016 to 2017.Major Taxa StudiedA total of 1104 tropical tree species with in situ traits characterization.Methods: We used seven morphological leaf traits and wood density values to analyse the functional trait dynamic over 10 years along an elevational gradient. By analysing changes in species composition, abundance and trait representation, we inferred the magnitude and direction of changes in functional composition. Then, we assessed if the functional change was related to climate change and demography.Results: With increased minimum temperature and vapour-pressure deficit, we found a decrease over time in mean values for leaf area and specific leaf area and increases in leaf thickness and leaf dry matter content. Long-term temperature increases are smaller with increasing elevation, but the magnitude of trait changes is greater than in lowlands.Main Conclusions: The functional composition is changing towards more conservative strategies over time across the elevation gradient, with the strongest changes observed at the highest elevations. This pattern is explained by the change in species turnover within communities due to higher recruitment rates of species with high leaf dry matter content values and low leaf area values. These shifts may be related to communities' responses to higher evapotranspiration demand and thermal stress, mainly at higher elevations.
Assessing the impacts of anthropogenic degradation and climate change on global carbon cycling is hindered by a lack of clear, flexible and easy-to-use productivity models along with scarce trait and productivity data for parameterizing and testing those models. We provide a simple solution: a mechanistic framework (RS-CFM) that combines remotely-sensed foliar-trait and canopy-structural data with trait-based metabolic theory to efficiently map productivity at large spatial scales. We test this framework by quantifying net primary productivity (NPP) at high-resolution (0.01-ha) in hyper-diverse Peruvian tropical forests (30040 hectares) along a 3322-m elevation gradient. Our analysis captures hotspots and elevational shifts in productivity more accurately and in greater detail than alternative empirical- and process-based models that use plant functional types. This result exposes how high-resolution, location-specific variation in traits and light competition drive variability in productivity, opening up possibilities to fully harness remote sensing data and reliably scale up from traits to map global productivity in a more direct, efficient and cost-effective manner.
Forests that regrow naturally on abandoned fields are important for restoring biodiversity and ecosystem services, but can they also preserve the distinct regional tree floras? Using the floristic composition of 1215 early successional forests (≤20 years) in 75 human-modified landscapes across the Neotropic realm, we identified 14 distinct floristic groups, with a between-group dissimilarity of 0.97. Floristic groups were associated with location, bioregions, soil pH, temperature seasonality, and water availability. Hence, there is large continental-scale variation in the species composition of early successional forests, which is mainly associated with biogeographic and environmental factors but not with human disturbance indicators. This floristic distinctiveness is partially driven by regionally restricted species belonging to widespread genera. Early secondary forests contribute therefore to restoring and conserving the distinctiveness of bioregions across the Neotropical realm, and forest restoration initiatives should use local species to assure that these distinct floras are maintained.
We analyze here how much carbon is being accumulated annually by secondary tropical dry forests (TDFs) and how structure, composition, time since abandonment, and climate can influence the dynamics of forest carbon accumulation. The study was carried out in Santa Rosa National Park in Guanacaste province, Costa Rica and Mata Seca State Park in Minas Gerais, Brazil. Total carbon storage and carbon accumulation were obtained for both sites from the sum of the aboveground carbon and belowground carbon gain plus the annual litterfall. Carbon accumulation of these TDFs varied from 2.6 Mg C ha−1 y−1 to 6.3 Mg C ha−1 y−1, depending on the age of the forest stands. Time since abandonment and number of stems per plot were the best predictors for carbon storage, annual carbon gains, and losses. Mortality rates and carbon losses were also associated with seasonal climate variability. We found significant correlations between tree mortality, carbon losses and mean seasonal temperature, mean seasonal precipitation, potential evapotranspiration, and the Oceanic Niño Index. Carbon dynamics in tropical dry forests are driven by time since abandonment and forest structure; however, rising temperature and El Niño Southern Oscillation (ENSO) events can have a significant impact on tree mortality and carbon losses. Depending on their location and land-use history, some dry forests are more impacted by climatic extremes than others, and differences between secondary stages are expected.
Tropical dry forests (TDFs) worldwide have an environment-sensitive phenological signal, which easily marks their response to the changing climatic conditions, especially precipitation and temperature. Using TDF phenological characteristics as a proxy, this study aims to evaluate their current continental response to climate change across the Americas. Here, we show that TDFs are resilient to water stress and droughts by increasing their rain use efficiency (RUE) in drier years and recovering to average RUE in the year following the drought. Additionally, we find that TDF productivity trends over the past 18 years are spatially clustered, with sites in the northern hemisphere experiencing increased productivity, while equatorial regions have no change, and the southern hemisphere exhibiting decreased productivity. The results indicate that the TDF will be resilient under future climatic conditions, particularly if there are increasing drought conditions.
Tropical forests disappear rapidly because of deforestation, yet they have the potential to regrow naturally on abandoned lands. We analyze how 12 forest attributes recover during secondary succession and how their recovery is interrelated using 77 sites across the tropics. Tropical forests are highly resilient to low-intensity land use; after 20 years, forest attributes attain 78% (33 to 100%) of their old-growth values. Recovery to 90% of old-growth values is fastest for soil (<1 decade) and plant functioning (<2.5 decades), intermediate for structure and species diversity (2.5 to 6 decades), and slowest for biomass and species composition (>12 decades). Network analysis shows three independent clusters of attribute recovery, related to structure, species diversity, and species composition. Secondary forests should be embraced as a low-cost, natural solution for ecosystem restoration, climate change mitigation, and biodiversity conservation.
A core goal of the National Ecological Observatory Network (NEON) is to measure changes in biodiversity across the 30-yr horizon of the network. In contrast to NEON's extensive use of automated instruments to collect environmental data, NEON's biodiversity surveys are almost entirely conducted using traditional human-centric field methods. We believe that the combination of instrumentation for remote data collection and machine learning models to process such data represents an important opportunity for NEON to expand the scope, scale, and usability of its biodiversity data collection while potentially reducing long-term costs. In this manuscript, we first review the current status of instrument-based biodiversity surveys within the NEON project and previous research at the intersection of biodiversity, instrumentation, and machine learning at NEON sites. We then survey methods that have been developed at other locations but could potentially be employed at NEON sites in future. Finally, we expand on these ideas in five case studies that we believe suggest particularly fruitful future paths for automated biodiversity measurement at NEON sites: acoustic recorders for sound-producing taxa, camera traps for medium and large mammals, hydroacoustic and remote imagery for aquatic diversity, expanded remote and ground-based measurements for plant biodiversity, and laboratory-based imaging for physical specimens and samples in the NEON biorepository. Through its data science-literate staff and user community, NEON has a unique role to play in supporting the growth of such automated biodiversity survey methods, as well as demonstrating their ability to help answer key ecological questions that cannot be answered at the more limited spatiotemporal scales of human-driven surveys.
One-third of all Neotropical forests are secondary forests that regrow naturally after agricultural use through secondary succession. We need to understand better how and why succession varies across environmental gradients and broad geographic scales. Here, we analyze functional recovery using community data on seven plant characteristics (traits) of 1,016 forest plots from 30 chronosequence sites across the Neotropics. By analyzing communities in terms of their traits, we enhance understanding of the mechanisms of succession, assess ecosystem recovery, and use these insights to propose successful forest restoration strategies. Wet and dry forests diverged markedly for several traits that increase growth rate in wet forests but come at the expense of reduced drought tolerance, delay, or avoidance, which is important in seasonally dry forests. Dry and wet forests showed different successional pathways for several traits. In dry forests, species turnover is driven by drought tolerance traits that are important early in succession and in wet forests by shade tolerance traits that are important later in succession. In both forests, deciduous and compound-leaved trees decreased with forest age, probably because microclimatic conditions became less hot and dry. Our results suggest that climatic water availability drives functional recovery by influencing the start and trajectory of succession, resulting in a convergence of community trait values with forest age when vegetation cover builds up. Within plots, the range in functional trait values increased with age. Based on the observed successional trait changes, we indicate the consequences for carbon and nutrient cycling and propose an ecologically sound strategy to improve forest restoration success.
Abstract Tropical dry forests (TDFs) have experienced pronounced droughts and increased temperatures for the last century. To assess whether these climatic shifts have influenced dry forest vegetation and ecosystem functioning, we integrated ground observations from a Costa Rican long‐term forest dynamics monitoring plot with remotely sensed measures of forest productivity and canopy functioning from a diverse set of satellite data. Previously reported long‐term climate data (1921–1997) show a reduction in annual rainfall, but since 1980 there has been no directional change in mean annual precipitation. However, the 2015 El Niño Southern Oscillation (ENSO)‐induced drought was unprecedented. Temperatures have increased by 1.1°C since 1931. However, the Landsat wet season (1987–2017) Enhanced Vegetation Index (EVI) (canopy greenness) and the dry season (1985–2017) fraction of non‐photosynthetic canopy cover all indicate that TDFs have become more deciduous but also more productive during the wet season. These changes are consistent with a shift in the functional composition observed in the long‐term plot as more drought‐deciduous tree species have increased in abundance. Nonetheless, more continuous 16‐d MODIS (the Moderate Resolution Imaging Spectroradiometer) measures of the EVI over the past 17 yr (2001–2017) showed no change in the total annual forest productivity. Further, while the 2015 ENSO event temporarily reduced forest EVI, it did not cause a longer‐term impact on forest productivity. Instead, high spatial resolution Worldview‐2 satellite imagery showed that forest phenology shifted in the subsequent years even though the region returned to normal precipitation. Our results indicate that while the species composition of TDFs may be sensitive to the long‐term trend of gradually increasing temperatures and aridity, the annual forest functioning has so far been resilient to long‐term drying and a large episodic extreme drought event. This study demonstrates the feasibility of synthesizing satellite images of different characteristics to study the vegetation dynamics of a long‐term forest dynamics plot. Our synoptically sensed results show that the longer‐term changing climate has been and is currently shifting the ecological functioning, and also provide a baseline to assess the impacts of an extreme drought year on TDFs.
Abstract It is a critical time to reflect on the National Ecological Observatory Network (NEON) science to date as well as envision what research can be done right now with NEON (and other) data and what training is needed to enable a diverse user community. NEON became fully operational in May 2019 and has pivoted from planning and construction to operation and maintenance. In this overview, the history of and foundational thinking around NEON are discussed. A framework of open science is described with a discussion of how NEON can be situated as part of a larger data constellation—across existing networks and different suites of ecological measurements and sensors. Next, a synthesis of early NEON science, based on >100 existing publications, funded proposal efforts, and emergent science at the very first NEON Science Summit (hosted by Earth Lab at the University of Colorado Boulder in October 2019) is provided. Key questions that the ecology community will address with NEON data in the next 10 yr are outlined, from understanding drivers of biodiversity across spatial and temporal scales to defining complex feedback mechanisms in human–environmental systems. Last, the essential elements needed to engage and support a diverse and inclusive NEON user community are highlighted: training resources and tools that are openly available, funding for broad community engagement initiatives, and a mechanism to share and advertise those opportunities. NEON users require both the skills to work with NEON data and the ecological or environmental science domain knowledge to understand and interpret them. This paper synthesizes early directions in the community’s use of NEON data, and opportunities for the next 10 yr of NEON operations in emergent science themes, open science best practices, education and training, and community building.
Forests are integral to global carbon cycling but are threatened by anthropogenic degradation and climate change. Assessing this global threat has been hindered by a lack of clear, flexible, and easy-to-use productivity models along with a lack of functional trait and productivity data for parameterizing and testing those models. Current productivity models are either extremely complex requiring up to hundreds of parameters, many sub-models, and considerable computational expense or rely on statistical trait-growth relationships that can be hard to extrapolate to new systems or climates. Here we provide a simple alternative: a remote sensing canopy functional model (RS-CFM) that uses remotely-sensed foliar traits and canopy structure data to efficiently map productivity at high-resolution and large spatial scales. We test this model by quantifying net primary productivity (NPP) at 0.01-ha resolution in 30,040 hectares of Peruvian tropical rainforest along a 3,322-m Amazon-to-Andes elevation gradient. Our model predicts local NPP and elevational shifts in NPP much more accurately and in greater detail than a prominent alternative method—NASA’s MODIS NPP product. Furthermore, we show how NPP estimates depend on light competition and identify the appropriate spatial resolution for remote productivity estimation. Our framework opens up possibilities to fully harness remote sensing data and reliably scale up from traits to map regional or global productivity in a more direct, efficient, and cost-effective manner.
Old-growth tropical forests harbor an immense diversity of tree species but are rapidly being cleared, while secondary forests that regrow on abandoned agricultural lands increase in extent. We assess how tree species richness and composition recover during secondary succession across gradients in environmental conditions and anthropogenic disturbance in an unprecedented multisite analysis for the Neotropics. Secondary forests recover remarkably fast in species richness but slowly in species composition. Secondary forests take a median time of five decades to recover the species richness of old-growth forest (80% recovery after 20 years) based on rarefaction analysis. Full recovery of species composition takes centuries (only 34% recovery after 20 years). A dual strategy that maintains both old-growth forests and species-rich secondary forests is therefore crucial for biodiversity conservation in human-modified tropical landscapes.
 Brian Enquist合作论文数Department of Ecology and Evolutionary Biology, College of Science, University of Arizona;The Santa Fe Institute;Oxford University;Rocky Mountain Biological Laboratory15
 G. Arturo Sanchez-Azofeifa合作论文数Dept Earth & Atmospher Sci, Univ Alberta13
 Mario M. Espirito-Santo合作论文数11
 Yule Roberta Ferreira Nunes合作论文数10
 Ben de Jong合作论文数9
 Rodrigo Munoz合作论文数9
 Francisco Mora合作论文数Inst Invest Ecosistemas & Sustentabilidad, Univ Nacl Autonoma Mexico9
 Jose Luis Hernandez-Stefanoni合作论文数Unidad Recursos Nat, Ctr Invest Cient Yucatan AC9
 Michiel Van Breugel合作论文数Department of Biological Sciences, Faculty of Science, National University of Singapore9
 Robin Chazdon合作论文数Department of Ecology and Evolutionary Biology, College of Arts and Sciences, University of Colorado Boulder;Tropical Forests & People Research Centre, Forest Research Institute, University of the Sunshine Coast9
 L (Lourens) Poorter合作论文数Forest Ecology and Forest Management Group, Wageningen University & Research9
 FJJM (Frans) Bongers合作论文数Wageningen University and Research9
 Miguel Martínez Ramos合作论文数Laboratorio de Ecología y Manejo de Bosques Tropicales, Instituto de Investigaciones en Ecosistemas y Sustentabilidad, Universidad Nacional Autónoma de México9Jefferson S. Hall合作论文数Center for Tropical Forest Science, Smithsonian Tropical Research Institute9
 Susana Ochoa-Gaona合作论文数El Colegio de la Frontera Sur Apartado Postal9Deborah K. Kennard合作论文数USDA Forest Service9
 Jorge A. Meave合作论文数Facultad de Ciencias, Universidad Nacional Autónoma de México9
 Daisy Dent合作论文数School of Biological Sciences, University of Aberdeen9
 Juan Manuel Dupuy合作论文数Unidad de Recursos Naturales, Centro de Investigación Científica de Yucatán A.C.9
 Susan Letcher合作论文数9
 Pedro Henrique Brancalion合作论文数Departamento de Ciências Florestais, Universidade de São Paulo;Instituto de Estudos Avangados, Universidade de São Paulo9
 Maria Das Dores Magalhaes Veloso合作论文数9
 Danae Rozendaal合作论文数Institute of Environmental Biology, Utrecht University9
 Ricardo Gomes César合作论文数Dept Forest Sci, Univ Sao Paulo8
 Catarina Jakovac合作论文数Forest Ecol & Management Grp, Wageningen Univ8
 Lohbeck Madelon合作论文数Forest Ecology and Forest Management Group, Wageningen University;Centro de Investigaciones en Ecosistemas, Universidad Nacional Autónoma de México;Wageningen University, Universidad Nacional Autónoma de México8
 Jarcilene Almeida Cortez合作论文数Departamento de Botânica, Centro de Ciências Biológicas, Universidade Federal de Pernambuco;Universidade Estadual de Montes Claros;Université de Sherbrooke8
 Saara J. Dewalt合作论文数Department of Biological Sciences, Clemson University8
 Patricia Balvanera合作论文数Centro de Investigaciones en Ecosistemas;noma de Mexico, Universidad Nacional Auto;Centro de Investigaciones en Ecosistemas, Universidad Nacional Autonoma de Mexico8
 Maria Uriarte合作论文数Dept. of Ecology, Evolution, and Environmental Biology, Columbia University8
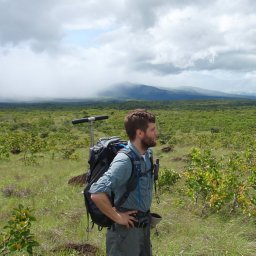 Justin M. Becknell合作论文数8
 Erika Marin-Spiotta合作论文数Department of Geography, University of Wisconsin–Madison;Wisconsin Sloan Center for Systemic Change, University of Wisconsin–Madison;Wisconsin Inclusion in Science and Engineering Leadership Institute, University of Wisconsin–Madison8
 George A L Cabral合作论文数7
 Naomi Schwartz合作论文数Department of Geography, Faculty of Arts, The University of British Columbia7
 Bryan Finegan合作论文数Department of Ecology and Evolutionary Biology, University of Connecticut;Division for Inclusive Green Development, Centro Agronomico Tropical de Investigacion y Ensenanza;College of Natural Resources, University of Idaho7
 Dylan Craven合作论文数Center for Tropical Forest Science, Smithsonian Tropical Research Institute;Yale School of Forestry and Environmental Studies, New Haven, Connecticut, United States of America.;Yale School of Forestry and Environmental Studies, Smithsonian Tropical Research Institute7
 Marielos Pena-Claros合作论文数Programa de Manejo de Bosques de la Amazonia;Department of Plant Ecology;Utrecht University;Department of Plant Ecology, Utrecht University7
 André Braga Junqueira合作论文数Coordenação de Pesquisas em Ciências Agronômicas, Instituto Nacional de Pesquisas da Amazônia7Hans Van der wal合作论文数7
 G. Wilson Fernandes合作论文数Departamento de Biologia Geral, Federal University of Minas Gerais;Department of Biology, Stanford University7
 Daniel Piotto合作论文数School of Forestry and Environmental Studies, Yale University7
 Ima Celia Guimaraes Vieira合作论文数6
 Sandra Cristina Muller合作论文数6
 Katia Zanini合作论文数Dept Ecol, Univ Fed Rio Grande do Sul6Jorge Rodríguez-Velázquez合作论文数Universidad Nacional Autónoma de México, Universidad Nacional Autónoma de México6
 Julie S Denslow合作论文数Institute for Pacific Islands Forestry, United States Department of Agriculture Forest Service6
 Greg Asner合作论文数Center for Global Discovery and Conservation Science, Arizona State University;School of Ocean Futures, Arizona State University;Hawaiʻi Marine Education and Research Center6
 Edwin Lebrija-Trejos合作论文数Forest Ecology and Forest Management Group;Wageningen University;Forest Ecology and Forest Management Group, Wageningen University6
 Rita C. G. Mesquita合作论文数Biological Dynamics of Forest Fragments Project;INPA ), National Institute for Amazonian Research;Smithsonian Tropical Research Institute6




