ARC is a new method to generates time series of a full set of biophysical parameters derived from optical EO. Here, we examine relationships between this ‘full’ set and maize yield. 15 Parameters per pixel are estimated over the US corn belt using ARC, to fully describe the phenology, soil, and crop status over time for typical behaviour. ARC is tested for a new model over an area of irrigated and rain-fed winter crop in South Africa. We find that care must be taken for episodic events, and robust filtering methods should be developed for ARC, but average magnitude and timing is well-expressed. We find that a robust yield model (over time and space) can be created at the county-level for maize using only EO parameters with RMSE of 704-938 kg/ha using a non-linear model, but the results are only slightly poorer if a linear model is used. It compares well to a model that also includes weather data, showing that a model can be driven by optical EO data alone.
High temporal soil moisture at field scale resolution (10 m-100 m) is important for smart farming decisions. Although, medium and coarse resolution (1 km-50 km) soil moisture information is operationally available on a large scale, high resolution (field scale) datasets are not. This study propose a data assimilation approach to downscale medium resolution (1 km x 1 km) soil moisture information-of intense agriculturally cultivated areas-to field scale. For achieving high transferability of the proposed method, the used input data (Sentinel-1 VV backscatter, Sentinel-2 derived vegetation water content, literature values) can be provided systematically from global operational satellites. Microwave and optical data are used together as input data of a radiative transfer model to derive soil moisture information with high temporal and spatial resolution. The retrieval approach shows a mean ubRMSE for soil moisture estimates of all test fields (Munich-North-Isar test site, Bavaria, Germany) with 0.045 m(3)/m(3) and 0.037 m(3)/m(3) for 2017 and 2018. Furthermore, the retrieved soil moisture estimates cover a broad range of values from 0.05 m(3)/m(3) to 0.4 m(3)/m(3). In addition, the temporal evolution of the soil moisture patterns are in line with precipitation events. Moreover, the drying behavior is matched as well. The proposed method showed that for the test area, high resolution soil moisture time series can be provided by only using remote sensing derived input data. In this way, this study is another step towards providing high spatio-temporal soil moisture information for precision farming purposes.
Machine learning models are used to identify crops in satellite data, which achieve high classification accuracy but do not necessarily have a high degree of transferability to new regions. This paper investigates the use of machine learning models for crop classification using Sentinel-2 imagery. It proposes a new testing methodology that systematically analyzes the quality of the spatial transfer of trained models. In this study, the classification results of Random Forest (RF), eXtreme Gradient Boosting (XGBoost), Stochastic Gradient Descent (SGD), Multilayer Perceptron (MLP), Support Vector Machines (SVM), and a Majority Voting of all models and their spatial transferability are assessed. The proposed testing methodology comprises 18 test scenarios to investigate phenological, temporal, spatial, and quantitative (quantitative regarding available training data) influences. Results show that the model accuracies tend to decrease with increasing time due to the differences in phenological phases in different regions, with a combined F1-score of 82% (XGBoost) when trained on a single day, 72% (XGBoost) when trained on the half-season, and 61% when trained over the entire growing season (Majority Voting).
Changes in vertical geochemical gradients within the Western Pacific Warm Pool (WPWP) are important indicators of the region's upper ocean response to climate changes and to the oceanographic coupling between the thermocline and surface mixed layer. Here, we reconstruct temperature and delta O-18(sw) at International Ocean Discovery Program Site U1486 (1332 m water depth, 2.22' S, 144. 36' E) located in the Bismarck Sea in the southern sector of the WPWP. A 670-kyr record of Delta delta O-18 between the surface-dwelling foraminifera Globigerinoides ruber sensu stricto and the thermocline-dwelling foraminifera Pulleniatina obliquiloculata and Globorotalia tumida (when combined with Mg/Ca-based temperature and d18Osw estimates) suggests long-term thermocline shoaling and a progressively increasing vertical salinity gradient commencing near 240 ka. Through a detailed comparison to other Pacific records, it becomes clear this is not solely a local phenomenon, as we identify widespread cooling of the thermocline in the low-latitude Pacific after similar to 240 ka. After examining our temperature reconstructions alongside new delta O-18(sw) and constant flux proxy-derived focusing factor records, we potentially also validate previous models which find obliquity-induced strengthening of low-latitude Pacific currents. We extend this to support periods of increased transport of high-salinity thermocline water masses through the South Pacific low-latitude western boundary current system. These results indicate greater variability in thermocline circulation given amplified obliquity and strengthen previous evidence that variability in the WPWP thermocline is independent from the drivers of WPWP surface variability.
The Sentinel-1 mission consists of two polar-orbiting satellites acquiring Synthetic Aperture Radar data (SAR) at C-band (frequency of 5.405 GHz) with a revisit time of 6 days. The SAR data is distributed free of charge via the Copernicus Open Access Hub (https: //scihub.copernicus.eu/) by European Space Agency (ESA) and the European Commission. Large archives are also provided by Data and Information Access Services (DIAS) which serve the purpose to facilitate the access and use of Sentinel Data. Due to the specific imaging geometry of the radar system, the acquired radar data contains different radiometric and geometric distortions. The radiometric quality is affected by spreading loss effect, the non-uniform antenna pattern, possible gain changes, saturation, and speckle noise. Geometric distortions such as foreshortening, layover or shadowing effects are based on the side looking radar acquisition system. To account for these radiometric and geometric distortions, the Sentinel-1 Level 1 data has to be corrected radiometrically and geometrically before the data can be used for further analysis or within third party applications. Therefore, either an automatic or manual pre-processing of Sentinel-1 images is needed.
Global mean sea level (GMSL) during intermediate interglacial Marine Isotope Stage 3 (MIS 3) (60–26 ka) has proven difficult to constrain. Paleo‐sea level estimates based on ice margin, modeling, and paleo‐shoreline reconstructions indicate that MIS 3 GMSL was substantially higher than reconstructed from deep‐ocean benthic foraminifera oxygen isotope (δ 18 O) and coral records, implying much smaller ice sheets during MIS 3. Here, we use the δ 18 O and Mg/Ca chemistry of surface and thermocline dwelling foraminifera in the Sulu Sea in the western Pacific margin to estimate relative changes of the influx of South China Sea surface flow through the Sulu Sea over the last 140 ka. We show that this South China Sea throughflow is controlled in part by changes in GMSL modulating the depth of the 36 m deep Karimata Strait at the southern end of the South China Sea. We constrain maximum allowable GMSL at the beginning and end of MIS 3 to −22 ± 6 and −29 ± 5 m, respectively, and minimum allowable GMSL during interglacial stages MIS 5c and 5a (117–72 ka) to range from −3 ± 8 to −8 ± 8 m and −11 ± 7 to −12 ± 7 m, respectively. Our results constrain MIS 3 GMSL, but do not rule out higher MIS 3 ice margin, modeling, and paleo‐shoreline‐based MIS 3 GMSL estimates or lower coral and seawater δ 18 O‐based estimates. Our results favor the highest MIS 5a and 5c GMSL estimates and confirm that the Sunda Shelf served as a land‐bridge for human and megafauna migration during MIS 3 when humans first arrived in Borneo.
The meridional migration of the bifurcation latitude of the Pacific North Equatorial Current (NEC) in the western boundary of the tropical Pacific modulates the strength of the Kuroshio Current. Using salinity reanalysis data, we show the NEC bifurcation latitude also acts as the dominant control on thermocline salinity of the Sulu Sea, just west of the Philippine archipelago, by regulating influx of western Pacific thermocline water via the Luzon Strait. We used oxygen isotopes (δ18O) and Mg/Ca in the thermocline-dwelling foraminifera Globorotalia tumida from Sulu Sea sediment core MD97-2141 to determine past thermocline δ18Ow and salinity variability spanning ∼20–5 ka with an average sampling interval of ∼50 years and infer past changes in the NEC bifurcation latitude. Our Sulu Sea thermocline reconstruction reveals high salinity from ∼18.8–15.5 ka, ∼12.2–11.5 ka, and from ∼9.5–8.5 ka indicating the NEC bifurcation latitude was shifted north and the Kuroshio was weak at those times. Low Sulu Sea thermocline salinity from ∼13.0–12.4 ka, ∼11.5–10.9 ka, and from ∼8.5 ka until the end of the record at ∼5.6 ka indicates the NEC bifurcation latitude was shifted south and the Kuroshio Current was relatively strong. Comparison to other paleoclimate records suggests the observed northward (southward) shifts of the NEC bifurcation latitude were driven by southward (northward) shifts of the Indo-Pacific ITCZ, consistent with modern mechanisms controlling interannual NEC bifurcation variability. The NEC bifurcation latitude shifts likely modulated northward energy transport via the Kuroshio Current and the mean temperature and salinity of the Indonesian Throughflow.
Soil moisture is a key variable in the terrestrial water and energy system. This study presents an hourly index that provides soil moisture estimates on a high spatial and temporal resolution (1 km × 1 km). The long established Antecedent Precipitation Index (API) is extended with soil characteristic and temperature dependent loss functions. The Soilgrids and ERA5 data sets are used to provide the controlling variables. Precipitation as main driver is provided by the German weather radar data set RADOLAN. Empiric variables in the equations are fitted in a optimization effort using 23 in-situ soil moisture measurement stations from the Terrestial Environmental Observatories (TERENO) and a separately conducted field campaign. The volumetric soil moisture estimation results show error values of 3.45 Vol% mean ubRMSD between RADOLAN_API and station data with a high temporal accordance especially of soil moisture upsurge. Further potential of the improved API algorithm is shown with a per-station calibration of applied empirical variables. In addition, the RADOLAN_API data set was spatially compared to the ESA CCI soil moisture product where it altogether demonstrates good agreement. The resulting data set is provided as open access data.
Please find the description of the applied algorithm in Remote Sensing: Ramsauer, T.; Weiß, T.; Löw, A.; Marzahn, P. RADOLAN_API: An Hourly Soil Moisture Data Set Based on Weather Radar, Soil Properties and Reanalysis Temperature Data. Remote Sens. 2021, 13, 1712. https://doi.org/10.3390/rs13091712 Abstract Soil moisture is a key variable in the terrestrial water and energy system. This study presents an hourly index that provides soil moisture estimates on a high spatial and temporal resolution (1 km × 1 km). The long established Antecedent Precipitation Index (API) is extended with soil characteristic and temperature dependent loss functions. The Soilgrids and ERA5 data sets are used to provide the controlling variables. Precipitation as main driver is provided by the German weather radar data set RADOLAN. Empiric variables in the equations are fitted in a optimization effort using 23 in-situ soil moisture measurement stations from the Terrestial Environmental Observatories (TERENO) and a separately conducted field campaign. The volumetric soil moisture estimation results show error values of 3.45 Vol% mean ubRMSD between RADOLAN_API and station data with a high temporal accordance especially of soil moisture upsurge. Further potential of the improved API algorithm is shown with a per-station calibration of applied empirical variables. In addition, the RADOLAN_API data set was spatially compared to the ESA CCI soil moisture product where it altogether demonstrates good agreement. The resulting data set is provided as open access data. Keywords: soil moisture; high resolution; weather radar; hourly; API; soil properties; Soilgrids; TERENO; ESA CCI SM; RADOLAN Data set info: Dimensions: 692 × 1188 × 43,824 (latitude, longitude, time) Spatial Resolution: 1 km × 1 km Spatial Coverage: Territory of Germany Temporal Coverage: 01.01.2015–31.12.2019 Data sets that contribute to RADOLAN_API: DWD's RADOLAN RW: weather radar data: ECMWF's ERA5 t2m: temperature data: Soilgrids: soil characteristics:
This study evaluates a temporally dense VV-polarized Sentinel-1 C-band backscatter time series (revisit time of 1.5 days) for wheat fields near Munich (Germany). A dense time series consisting of images from different orbits (varying acquisition) is analyzed, and Radiative Transfer (RT)-based model combinations are adapted and evaluated with the use of radar backscatter. The model shortcomings are related to scattering mechanism changes throughout the growth period with the use of polarimetric decomposition. Furthermore, changes in the RT modeled backscatter results with spatial aggregation from the pixel to field scales are quantified and related to the sensitivity of the RT models, and their soil moisture output are quantified and related to changes in backscatter. Therefore, various (sub)sets of the dense Sentinel-1 time series are analyzed to relate and quantify the impact of the abovementioned points on the modeling results. The results indicate that the incidence angle is the main driver for backscatter differences between consecutive acquisitions with various recording scenarios. The influence of changing azimuth angles was found to be negligible. Further analyses of polarimetric entropy and scattering alpha angle using a dual polarimetric eigen-based decomposition show that scattering mechanisms change over time. The patterns analyzed in the entropy-alpha space indicate that scattering mechanism changes are mainly driven by the incidence angle and not by the azimuth angle. Besides the analysis of differences within the Sentinel-1 data, we analyze the capability of RT model approaches to capture the observed Sentinel-1 backscatter changes due to various acquisition geometries. For this, the surface models “Oh92” or “IEM_B” (Baghdadi’s version of the Integral Equation Method) are coupled with the canopy model “SSRT” (Single Scattering Radiative Transfer). To resolve the shortcomings of the RT model setup in handling varying incidence angles and therefore the backscatter changes observed between consecutive time steps of a dense winter wheat time series, an empirical calibration parameter (coef) influencing the transmissivity (T) is introduced. The results show that shortcomings of simplified RT model architectures caused by handling time series consisting of images with varied incidence angles can be at least partially compensated by including a calibration coefficient to parameterize the modeled transmissivity for the varying incidence angle scenarios individually.
This study aimed to analyze existing microwave surface (Oh, Dubois, Water Cloud Model “WCM”, Integral Equation Model “IEM”) and canopy (Water Cloud Model “WCM”, Single Scattering Radiative Transfer “SSRT”) Radiative Transfer (RT) models and assess advantages and disadvantages of different model combinations in terms of VV polarized radar backscatter simulation of wheat fields. The models are driven with field measurements acquired in 2017 at a test site near Munich, Germany. As vegetation descriptor for the canopy models Leaf Area Index (LAI) was used. The effect of empirical model parameters is evaluated in two different ways: (a) empirical model parameters are set as static throughout the whole time series of one growing season and (b) empirical model parameters describing the backscatter attenuation by the canopy are treated as non-static in time. The model results are compared to a dense Sentinel-1 C-band time series with observations every 1.5 days. The utilized Sentinel-1 time series comprises images acquired with different satellite acquisition geometries (different incidence and azimuth angles), which allows us to evaluate the model performance for different acquisition geometries. Results show that total LAI as vegetation descriptor in combination with static empirical parameters fit Sentinel-1 radar backscatter of wheat fields only sufficient within the first half of the vegetation period. With the saturation of LAI and/or canopy height of the wheat fields, the observed increase in Sentinel-1 radar backscatter cannot be modeled. Probable cause are effects of changes within the grains (both structure and water content per leaf area) and their influence on the backscatter. However, model results with LAI and non-static empirical parameters fit the Sentinel-1 data well for the entire vegetation period. Limitations regarding different satellite acquisition geometries become apparent for the second half of the vegetation period. The observed overall increase in backscatter can be modeled, but a trend mismatch between modeled and observed backscatter values of adjacent time points with different acquisition geometries is observed.
Precipitation measurements provide crucial information for hydrometeorological applications. In regions where typical precipitation measurement gauges are sparse, gridded products aim to provide alternative data sources. This study examines the performance of NASA's Integrated Multi-satellitE Retrievals for the Global Precipitation Measurement Mission (IMERG, GPM) satellite precipitation dataset in capturing the spatio-temporal variability of weather events compared to the German weather radar dataset RADOLAN RW. Besides quantity, also timing of rainfall is of very high importance when modeling or monitoring the hydrologic cycle. Therefore, detection metrics are evaluated along with standard statistical measures to test both datasets. Using indices like probability of detection allows a binary evaluation showing the basic categorical accordance of the radar and satellite data. Furthermore, a pixel-by-pixel comparison is performed to assess the ability to represent the spatial variability of rainfall and precipitation quantity. All calculations are additionally carried out for seasonal subsets of the data to assess potentially different behavior due to differences in precipitation schemes. The results indicate significant differences between the datasets. Overall, GPM IMERG overestimates the quantity of precipitation compared to RADOLAN, especially in the winter season. Moreover, shortcomings in detection performance arise in this season with significant erroneously-detected, yet also missed precipitation events compared to the weather radar data. Additionally, along secondary mountain ranges and the Alps, topographically-induced precipitation is not represented in GPM data, which generally shows a lack of spatial variability in rainfall and snowfall estimates due to lower resolution.
Reconstructions of Pliocene sea-surface temperature (SST) gradients and thermocline depths suggest that the zonal temperature gradient of the tropical Pacific was distinct from the modern. However, the nature of any El Nino-Southern Oscillation (ENSO) variability superimposed on this mean state is difficult to determine. We developed monthly resolved multidecadal stable isotopic time series from an extremely well preserved central Caribbean coral dating to the Miocene-Pliocene transition, prior to closure of the Central American Seaway (CAS). Paleoceanographic modeling suggests that the flow of water associated with El Nino and La Nina events through the CAS allowed Caribbean corals to record the ENSO-related SST anomalies. Spectral analysis of coral oxygen isotope ratios reveals periodicities similar to modern ENSO signatures, suggesting that ENSO-like variability characterized the Miocene-Pliocene transition.
 Philip Marzahn合作论文数10
 Thomas Ramsauer合作论文数8
 Braddock K. Linsley合作论文数Lamont Doherty Earth Observ, Columbia Univ6
 Alexander Loew合作论文数4
 Thomas Jagdhuber合作论文数Microwaves and Radar Institute German Aerospace Center Oberpfaffenhofen, Germany4
 Feng Yin合作论文数2
 Gabriele Villarini合作论文数Department of Civil and Environmental Engineering, School of Engineering and Applied Science, Princeton University;High Meadows Environmental Institute, Princeton University2
 Arnold L. Gordon合作论文数Department of Earth and Environmental Sciences, Columbia University;Lamont-Doherty Earth Observatory, Columbia University2
 Irena Hajnsek合作论文数Institute of Environmental Engineering, Department of Civil, Environmental and Geomatic Engineering, Eidgenössische Technische Hochschule Zürich2Rhawn F. Denniston合作论文数Department of Geology, Cornell College2
 Yair Rosenthal合作论文数Department of Marine and Coastal Sciences, School of Environmental and Biological Sciences, Rutgers University2
 Alan D. Wanamaker合作论文数2Amie Corbin合作论文数1
 Philippe Peylin合作论文数1Tonio Fincke合作论文数1Jonathan E. Lambert合作论文数1
 Peter Dietrich合作论文数1Carsten Brockmann合作论文数1
 Leon T. Hauser合作论文数Dept Environm Biol, Leiden Univ1
 Jordan T Abell合作论文数Columbia Univ, Lamont Doherty Earth Observ, Palisades, NY 10964 USA1
 samantha c bova合作论文数Brown Univ, Dept Earth Environm & Planetary Sci, Providence, RI 02912 USA1Grit Kirches合作论文数1
 Anna S. Von der Heydt合作论文数1
 Philip Lewis合作论文数Department of Geography, University College London1
 Ralf Ludwig合作论文数Dept Geog, Ludwig Maximilians Univ Munchen1
 Peter van Bodegom合作论文数Department of Enviromental Biology, Institute of Environmental Sciences, Leiden University1
 Lea Hallik合作论文数Institute of Agricultural and Environmental Sciences, Estonian University of Life Sciences1Erik Borg合作论文数1
 Gisela Winckler合作论文数Geochemistry Division, Lamont-Doherty Earth Observatory, Columbia Climate School, Columbia University in the City of New York;Trace lsotope and Noble Gas Laboratory, Columbia Climate School, Columbia University in the City of New York;Department of Earth and Environmental Sciences, Columbia University in the City of New York1
 Jose Gomez-Dans合作论文数King's College London1Uwe Von Lukas合作论文数in 1994: Uwe von Lukas graduated in computer science from Darmstadt University of Technology1
 Joris Timmermans合作论文数International Institute for Geo-Information Science and Earth Observation (ITC), Enschede, The Netherlands1
 Kostas Papathanassiou合作论文数German Aerospace Center1
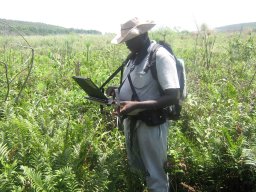 Elhadi Adam合作论文数School of Agricultural, Earth and Environmental Sciences, University of KwaZulu-Natal1




