<p>Making Earth-System-Model (ESM) Data accessible is challenging due to the large amount of data that we are facing in this realm. The upload is time-consuming, expensive, technically complex, and every institution has their own procedures.</p><p>Non-ESM experts face a lot of problems and pure data portals are hardly usable for inter- and trans-disciplinary communication of ESM data and findings, as this level of accessibility often requires specialized web or computing services.&#160;</p><p>With the Model Data Explorer, we want to simplify the generation of web services from ESM data, and we provide a framework that allows us to make the raw model data accessible to non-ESM experts.</p><p>Our decentralized framework implements the possibility for an efficient remote processing of distributed ESM data. Users interface with an intuitive map-based front-end to compute spatial or temporal aggregations, or select regions to download the data. The data generators (i.e. the scientist with access to the raw data) use a light-weight and secure python library based on the Data Analytics Software Framework (DASF, https://digital-earth.pages.geomar.de/dasf/dasf-messaging-python) to create a back-end module. This back-end module runs close to the data, e.g. on the HPC-resource where the data is stored. Upon request, the module generates and provides the required data for the users in the web front-end.</p><p>Our approach is intended for scientists and scientific usage! We aim for a framework where web-based communication of model-driven data science can be maintained by the scientific community. The Model Data Explorer ensures fair reward for the scientific work and adherence to the FAIR principles&#160;without too much overhead and loss in scientific accuracy.&#160;</p><p>The Model Data Explorer is in the progress of development at the Helmholtz-Zentrum Hereon,&#160;together with multiple scientific and data management partners in other German research centers. The full list of contributors is constantly updated and can be accessed at https://model-data-explorer.readthedocs.io.</p>
The Southern Ocean is a major sink of anthropogenic CO 2 and an important foraging area for top trophic level consumers. However, iron limitation sets an upper limit to primary productivity. Here we report on a considerably dense late summer phytoplankton bloom spanning 9000 km 2 in the open ocean of the eastern Weddell Gyre. Over its 2.5 months duration, the bloom accumulated up to 20 g C m −2 of organic matter, which is unusually high for Southern Ocean open waters. We show that, over 1997–2019, this open ocean bloom was likely driven by anomalies in easterly winds that push sea ice southwards and favor the upwelling of Warm Deep Water enriched in hydrothermal iron and, possibly, other iron sources. This recurring open ocean bloom likely facilitates enhanced carbon export and sustains high standing stocks of Antarctic krill, supporting feeding hot spots for marine birds and baleen whales.
A common challenge for projects with multiple involved research institutes is a well-defined and productive collaboration. All parties measure and analyze different aspects, depend on each other, share common methods, and exchange the latest results, findings, and data. Today this exchange is often impeded by a lack of ready access to shared computing and storage resources. In our talk, we present a new and innovative remote procedure call (RPC) framework. We focus on a distributed setup, where project partners do not necessarily work at the same institute, and do not have access to each others resources. We present the prototype of an application programming interface (API) developed in Python that enables scientists to collaboratively explore and analyze sets of distributed data. It offers the functionality to request remote data through a comfortable interface, and to share and invoke single computational methods or even entire analytical workflows and their results. The prototype enables researchers to make their methods accessible as a backend module running on their own infrastructure. Hence researchers from other institutes may apply the available methods through a lightweight python or Javascript API. This API transforms standard python calls into requests to the backend process on the remote server. In the end, the overhead for both, the backend developer and the remote user, is very low. The effort of implementing the necessary workflow and API usage equalizes the writing of code in a non-distributed setup. Besides that, data do not have to be downloaded locally, the analysis can be executed “close to the data” while using the institutional infrastructure where the eligible data set is stored. With our prototype, we demonstrate distributed data access and analysis workflows across institutional borders to enable effective scientific collaboration, thus deepening our understanding of the Earth system. This framework has been developed in a joint effort of the DataHub and Digitial Earth initiatives within the Research Centers of the Helmholtz-Gemeinschaft Deutscher Forschungszentren e.V. (Helmholtz Association of German Research Centres, HGF).
Modern digital scientific workflows - often implying Big Data challenges - require data infrastructures and innovative data science methods across disciplines and technologies. Diverse activities within and outside HGF deal with these challenges, on all levels. The series of Data Science Symposia fosters knowledge exchange and collaboration in the Earth and Environment research community. We invited contributions to the overarching topics of data management, data science and data infrastructures. The series of Data Science Symposia is a joint initiative by the three Helmholtz Centers HZG, AWI and GEOMAR Organization: Hela Mehrtens and Daniela Henkel (GEOMAR)
Artificial Intelligence for Cold Regions (AI-CORE) is a collaborative project of the DLR, the AWI, the TU Dresden, and is funded by the Helmholtz Foundation since early 2020. The project aims at developing AI methods for addressing some of the most challenging research questions in cryosphere remote sensing, rapidly changing ice sheets and thawing permafrost. We apply data analytics approaches to discover the data variable from data set simulated with an ice sheet model, observe the migration, and time Series analysis to predict and contrast this to simulated grounding line position. For the data assimilation in simulations of the Greenland ice sheet, we engage a level set method, that allows to derive a continuous function in time and space from discrete information at satellite acquisition time steps. We use an alpha-shape method to derive a seamless product of the margin at each time step to be used in the level set method driving the simulations. We develop AI algorithms and tools that allow scaling of our analyses to very large regions. Here we focus on the detection of Retrogressive Thaw Slumps (RTS), highly dynamic erosion processes caused by rapid permafrost thaw. We apply deep-learning based object detection on dense time-series of high-resolution (3m) multi-spectral PlanetScope satellite images and auxiliary datasets such as digital elevation models. RTS detection is challenging, as they are difficult to define semantically and spatially and are highly dynamic and embedded in different landscape settings. The results will help to understand, quantify and predict RTS dynamics and their landscape-scale impacts in a rapidly warming Arctic. We upgrade the base IT-infrastructure at AWI by integrating new GPU computing hardware into the on-premise IT-infrastructure to speed up the computing, data storage capabilities, and parallel processing, supporting the analytical workflows specifically.
Different phytoplankton groups dominate ocean biomes and they drive differently the marine food web and the biogeochemical cycles. However, their distribution over most parts of the global ocean remains uncertain due to limitations in the sampling resolution of currently available in situ and satellite data. Information below surface waters are especially limited because satellite sensors only provide information on the first optical depth. We present measurements obtained during Polarstern cruise PS113 (May–June 2018) across the Atlantic Ocean from South America to Europe along numerous transects. We measured the hyperspectral underwater radiation field continuously over several hours from a vertical undulating platform towed behind the ship. Equivalent measurements were also taken at specific stations. The concentrations of phytoplankton pigments were determined on discrete water samples. Via diagnostic pigment analysis we derived the phytoplankton group chlorophyll a concentration (Chla) from this pigment data set. We obtained high resolution phytoplankton group Chla data from depth resolved apparent optical properties derived from the underwater radiation data by applying an empirical orthogonal function (EOF) analysis to the spectral data set and subsequently developing regression models using the pigment based phytoplankton group Chla and selected EOF modes. To our knowledge, this is the first data set with high horizontal coverage (50–150 km) and resolution (∼1 km) that is also resolved vertically for the Chla of major taxonomic phytoplankton groups. Subsampling with 500 permutations for cross validation verified the high robustness of our estimates to enable predictions of seven different phytoplankton groups’ Chla and of total Chla (R2 and median percent differences of the cross validation are within 0.45–0.68 and 29–53%, respectively). Our depth resolved phytoplankton groups’ Chla data reflect well the different biogeochemical provinces within the Atlantic Ocean transect and follow the distributions encountered by previous point observations. This verifies the high quality of our retrievals and provides the prospect to put similar radiometers on profiling floats or gliders which would enable the large-scale collection of vertically resolved phytoplankton data at much improved horizontal coverage relative to discrete sampling.
During the MOSAiC expedition, the German research icebreaker Polarstern spends a full year drifting through the Arctic Ocean. Scientists from 20 countries participate in the largest polar expedition in history exploring the Arctic climate system. The experiment covers a large suite of in-situ and remote sensing observations of physical, ecological and biogeochemical parameters to describe the processes coupling the atmosphere, sea ice, and ocean. In addition to forefront instrumentation and observational techniques, proper data management is essential for large and complex projects and field programs. Key elements are agreements on consistent sampling strategies, the possibility to monitor the data flow, to facilitate near real-time processing, and analysis and sharing of data during and long after the expedition. Furthermore, data publication and documentation are crucial for such a collaborative effort and will build the legacy of the project and finally take climate science to the next level. We adapted our modular research data management framework O2A “Data flow from Observations to Archives” to meet the expedition requirements and ensure central data archival for generations to come. Researchers register all necessary sensor metadata beforehand. Essential metadata of scientific actions in the field are ingested immediately with the FloeNavi, a novel system enabling navigation on a drifting ice floe. O2A provides tools to automatize data ingestion, monitor the data flow and process, analyze and publish data. Integration of ship- and land-based components and a shared storage ensure seamless continuation of collaboration during and after the expedition laying the fundamentals for numerous data publications.
The Arctic Ocean plays a key role in regulating the global climate, while being highly sensitive to climate change. Temperature in the Arctic increases faster than the global average, causing a loss of multiyear sea-ice and affecting marine ecosystem structure and functioning. As a result, Arctic primary production and biogeochemical cycling are changing. Here, we investigated inter-annual changes in the concentrations of particulate and dissolved organic carbon (POC, DOC) together with biological drivers, such as phyto- and bacterioplankton abundance in the Fram Strait, the Atlantic gateway to the Central Arctic Ocean. Data have been collected in summer at the Long-Term Ecological Research observatory HAUSGARTEN during eight cruises from 2009 to 2017. Our results suggest that the dynamic physical system of the Fram Strait induces strong heterogeneity of the ecosystem that displays considerable intra-seasonal as well as inter-annual variability. Over the observational period, DOC concentrations were significantly negatively related to temperature and salinity, suggesting that outflow of Central Arctic waters carrying a high DOC load is the main control of DOC concentration in this region. POC concentration was not linked to temperature or salinity but tightly related to phytoplankton biomass as estimated from chlorophyll-a concentrations (Chl-a). For the years 2009–2017, no temporal trends in the depth-integrated (0–100 m) amounts of DOC and Chl-a were observed. In contrast, depth-integrated (0–100 m) amounts of POC, as well as the ratio [POC]:[TOC], decreased significantly over time. This suggests a higher partitioning of organic carbon into the dissolved phase. Potential causes and consequences of the observed changes in organic carbon stocks for food-web structure and CO2 sequestration are discussed.
Underwater light field characterization is of importance for understanding biogeochemical processes and heat budget of the global oceans, which are impacting and reacting to climate change. Vibrational Raman Scattering (VRS) was retrieved from backscattered radiances measured by three different hyperspectral satellite sensors, SCIAMACHY, GOME-2, and OMI, using Differential Optical Absorption Spectroscopy (DOAS). Diffuse attenuation coefficient (Kd) in the blue spectral range (390 to 426 nm) was derived from the VRS signal via a look-up-table established through ocean-atmosphere coupled radiative transfer modeling. We processed one year of data, representative of the overlapping period of optimal operation for all three sensors. Resulting data sets were evaluated by comparison with Kd at 490 nm from Ocean Colour Climate Change Initiative (OC-CCI) which was first converted to Kd at 390 to 426 nm. Good agreement with the OC-CCI Kd product was achieved for all three sensors when Kd was limited to below 0.15 m-1. Differences among the hyperspectral sensors and to OC-CCI were attributed to particular instrumental effects on the DOAS retrieval leading to temporal and spatial biases. This is in addition to the fact that the spatial and temporal resolution of the hyperspectral sensors data differ among themselves and are much lower then for the OC-CCI Kd-product. Further corrections (e.g., empirical) are necessary before these data sets can be merged in order to obtain a long-term Kd product for the blue spectral range.
An intercomparison of radiance and irradiance ocean color radiometers (the second laboratory comparison exercise—LCE-2) was organized within the frame of the European Space Agency funded project Fiducial Reference Measurements for Satellite Ocean Color (FRM4SOC) May 8–13, 2017 at Tartu Observatory, Estonia. LCE-2 consisted of three sub-tasks: (1) SI-traceable radiometric calibration of all the participating radiance and irradiance radiometers at the Tartu Observatory just before the comparisons; (2) indoor, laboratory intercomparison using stable radiance and irradiance sources in a controlled environment; (3) outdoor, field intercomparison of natural radiation sources over a natural water surface. The aim of the experiment was to provide a link in the chain of traceability from field measurements of water reflectance to the uniform SI-traceable calibration, and after calibration to verify whether different instruments measuring the same object provide results consistent within the expected uncertainty limits. This paper describes the third phase of LCE-2: The results of the field experiment. The calibration of radiometers and laboratory comparison experiment are presented in a related paper of the same journal issue. Compared to the laboratory comparison, the field intercomparison has demonstrated substantially larger variability between freshly calibrated sensors, because the targets and environmental conditions during radiometric calibration were different, both spectrally and spatially. Major differences were found for radiance sensors measuring a sunlit water target at viewing zenith angle of 139° because of the different fields of view. Major differences were found for irradiance sensors because of imperfect cosine response of diffusers. Variability between individual radiometers did depend significantly also on the type of the sensor and on the specific measurement target. Uniform SI traceable radiometric calibration ensuring fairly good consistency for indoor, laboratory measurements is insufficient for outdoor, field measurements, mainly due to the different angular variability of illumination. More stringent specifications and individual testing of radiometers for all relevant systematic effects (temperature, nonlinearity, spectral stray light, etc.) are needed to reduce biases between instruments and better quantify measurement uncertainties.
An intercomparison of radiance and irradiance ocean color radiometers (The Second Laboratory Comparison Exercise—LCE-2) was organized within the frame of the European Space Agency funded project Fiducial Reference Measurements for Satellite Ocean Color (FRM4SOC) May 8–13, 2017 at Tartu Observatory, Estonia. LCE-2 consisted of three sub-tasks: 1) SI-traceable radiometric calibration of all the participating radiance and irradiance radiometers at the Tartu Observatory just before the comparisons; 2) Indoor intercomparison using stable radiance and irradiance sources in controlled environment; and 3) Outdoor intercomparison of natural radiation sources over terrestrial water surface. The aim of the experiment was to provide one link in the chain of traceability from field measurements of water reflectance to the uniform SI-traceable calibration, and after calibration to verify whether different instruments measuring the same object provide results consistent within the expected uncertainty limits. This paper describes the activities and results of the first two phases of LCE-2: the SI-traceable radiometric calibration and indoor intercomparison, the results of outdoor experiment are presented in a related paper of the same journal issue. The indoor experiment of the LCE-2 has proven that uniform calibration just before the use of radiometers is highly effective. Distinct radiometers from different manufacturers operated by different scientists can yield quite close radiance and irradiance results (standard deviation s < 1%) under defined conditions. This holds when measuring stable lamp-based targets under stationary laboratory conditions with all the radiometers uniformly calibrated against the same standards just prior to the experiment. In addition, some unification of measurement and data processing must be settled. Uncertainty of radiance and irradiance measurement under these conditions largely consists of the sensor’s calibration uncertainty and of the spread of results obtained by individual sensors measuring the same object.
The presence of optically active water constituents is known to attenuate the light penetration in the ocean and impact the ocean heat content. Here, we investigate the influence of colored dissolved organic matter (CDOM) and total suspended matter (TSM) on the radiative heating of the Laptev Sea shelf waters. The Laptev Sea region is heavily influenced by the Lena River, one of the largest river systems in the Arctic region. We simulate the radiative heating by using a coupled atmosphere-ocean radiative transfer model (RTM) and in situ measurements from the TRANSDRIFT XVII expedition carried out in September 2010. The results indicate that CDOM and TSM have significant influence on the energy budget of the Laptev Sea shelf waters, absorbing most of the solar energy in the first 2 m of the water column. In the station with the highest CDOM absorption (a(CDOM)(443) = 1.77 m(-1))similar to 43% more energy is absorbed in the surface layer compared to the station with the lowest a(CDOM)(443) (similar to 0.2 m(-1)), which translates to an increased radiative heating of similar to 0.6 degrees C/day. The increased absorbed energy by the water constituents also implies increased sea ice melt rate and changes in the surface heat fluxes to the atmosphere. By using satellite remote sensing and RTM we quantify the spatial distribution of the radiative heating in the Laptev Sea for a typical summer day. The combined use of satellite remote sensing, RT modeling and in situ observations can be used to improve parameterization schemes in atmosphere-ocean circulation models to assess the role of the ocean in the effect of Arctic amplification.
Satellite remote sensing of chlorophyll a concentration (Chl-a) in the Arctic Ocean is spatially and temporally limited and needs to be supplemented and validated with substantial volumes of in situ observations. Here, we evaluated the capability of obtaining highly resolved in situ surface Chl-a using underway spectrophotometry operated during two summer cruises in 2015 and 2016 in the Fram Strait. Results showed that Chl-a measured using high pressure liquid chromatography (HPLC) was well related (R2 = 0.90) to the collocated particulate absorption line height at 676 nm obtained from the underway spectrophotometry system. This enabled continuous surface Chl-a estimation along the cruise tracks. When used to validate Chl-a operational products as well as to assess the Chl-a algorithms of the aqua moderate resolution imaging spectroradiometer (MODIS-A) and Sentinel-3 Ocean Land Color Imager (OLCI) Level 2 Chl-a operational products, and from OLCI Level 2 products processed with Polymer atmospheric correction algorithm (version 4.1), the underway spectrophotometry based Chl-a data sets proved to be a much more sufficient data source by generating over one order of magnitude more match-ups than those obtained from discrete water samples. Overall, the band ratio (OCI, OC4) Chl-a operational products from MODIS-A and OLCI as well as OLCI C2RCC products showed acceptable results. The OLCI Polymer standard output provided the most reliable Chl-a estimates, and nearly as good results were obtained from the OCI algorithm with Polymer atmospheric correction method. This work confirms the great advantage of the underway spectrophotometry in enlarging in situ Chl-a data sets for the Fram Strait and improving satellite Chl-a validation and Chl-a algorithm assessment over discrete water sample analysis in the laboratory.
Vertical particle fluxes are responsible for the transport of carbon and biogenic material from the surface to the deep ocean, hence understanding these fluxes is of climatic relevance. Sediment traps deployed in Fram Strait within the framework of the Arctic long-term observatory FRAM provide a time-series of vertical particle fluxes in a region of high CO2 uptake. Until now the source area (catchment area) of trapped particles is unclear; however, lateral advection of particles is supposed to play an important role. This study presents a Lagrangian method to backtrack the origin of particles for two Fram Strait moorings equipped with sediment traps in 200 and 2,300 m depth by using the time-dependent velocity field of a high-resolution, eddy-resolving ocean-sea ice model. Our study shows that the extent of the catchment area is larger the deeper the trap and the slower the settling velocity. Chlorophyll-a concentration as well as sea ice coverage of the catchment area are highest in the summer months. The high sea ice coverage in summer compared to winter can possibly be related to a weaker across-strait sea level pressure difference, which allows more sea ice to enter the then well-stratified central Fram Strait where the moorings are located. Furthermore, a backward sea ice tracking approach shows that the origin and age of sea ice drifting through Fram Strait, partly responsible for vertical particle fluxes, varies strongly from year to year, pointing to a high variability in the composition of particles trapped in the moorings.
Scientists are often interested in sampling buffered regions of data across multiple time-slices in array datacubes. For instance, in studying sea-ice distributions, a string of geographic coordinates with timestamps are requested, representing a sample or ship track line of a measurement campaign. A defined region is sampled around each of those data points using a nearestneighbour approach in time and a buffer or polygon clipping in the spatial domain. Objectively, such queries can be handled discretely across the time domain, as there is no temporal interpolation, and as a result, the tiling of extracted rasters is well-defined by the tiling of the source data. What happens when the resulting object should also be represented by a 3-D raster, such as in the case where the trackline consists of continuous buffered sampling across the timeseries? Spatio-temporal data is typically stored in chunked 3-D arrays, where multiple time-slices appear in the same "tile" or subarray. Unlike the discrete version, tracing out a polygonally-shaped buffer along a ship's path in a 3-D spatio-temporal datacube leads to shearing across the spatial tiles in the result raster, and this shearing prevents an a priori tiling of the result. Here, we present several approaches to tiling the result raster, and we provide a mathematical investigation of the impact these approaches can have on performance. To substantiate the theoretical investigation, an implementation and performance benchmarks on the different tiling approaches are provided, and the implementation is demonstrated on sea-ice data as a casestudy. In future work, we discuss different approaches towards parallelization utilizing these techniques as a basis for thread-safety, establishing the results on arbitrary R+ trees and extending these results to R* trees.
This study highlights benefits and challenges of applying coupled physical/biogeochemical modeling and the synergistic use of different satellite retrieval algorithms for investigating the phytoplankton diversity in the Great Calcite Belt. This area is of great interest for understanding biogeochemical cycling and ecosystem functioning under present climate changes observed in the Southern Ocean. Our coupled model simulations of the phenology of various Phytoplankton Functional Types (PFTs) are based on a version of the Darwin biogeochemical model (Dutkiewicz et al., 2015) coupled to the MITgcm circulation model (MITgcm Group 2012), where both - the physical and biogeochemical modules - are adapted for the Southern Ocean. As satellite-based PFT information, we consider products of the PhytoDOAS (Bracher et al. 2009, Sadeghi et al. 2012) using SCIAMACHY and OMI hyper-spectral optical satellite measurements. We also address aspects of combining this information synergistically (SynSenPFT, Losa et al. 2017) with the phytoplankton composition retrieved with OC-PFT (Hirata et al. 2011, Soppa et. al. 2014, 2016) based on multi-spectral optical satellite data (OC-CCI) and obtained by numerical modelling to allow for long time-series on the Southern Ocean phytoplankton diversity. To evaluate the satellite retrievals and model simulations we use in situ PFTs obtained a diagnostic pigment analysis (Soppa et al., 2017) as well as by scanning electron microscopy (Smith et al., 2017).
 Astrid Bracher合作论文数Institute of Environmental;Physics and Remote Sensing;University of Bremen;Institute of Environmental|Physics and Remote Sensing, University of Bremen85
 Marco Vountas合作论文数Institute of Environmental;University of Bremen;Institute of Environmental, University of Bremen48
 John P. Burrows合作论文数Institutes of Environmental Physics and Remote Sensing, University of Bremen42
 bettina taylor合作论文数39
 Ilka Peeken合作论文数Leibniz-Institut für Meereswissenschaften33
 Sadeghi, A.合作论文数School of Mechanical Engineering College, University of Tehran25
 Vladimir V. Rozanov合作论文数23
 Mariana Altenburg Soppa合作论文数Alfred-Wegener-Institut Helmholtz-Zentrum für Polar- und Meeresforschung17
 Aleksandra Wolanin合作论文数Alfred-Wegener-Institute Helmholtz Centre for Polar and Marine Research15
 Wolfgang Von Hoyningen-Huene合作论文数14
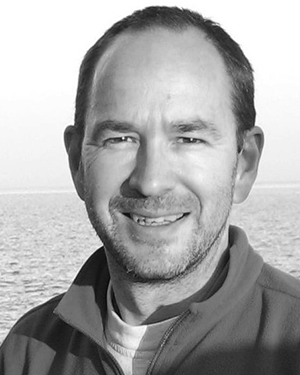 Rüdiger Röttgers合作论文数13Svetlana N. Losa合作论文数Alfred Wegener Institute for Polar and Marine Research9
 Andreas Richter合作论文数Institute of Environmental Physics, University of Bremen8r roettgers合作论文数7
 Alexander Kokhanovsky合作论文数Telespazio Belgium7Julia Oelker合作论文数6
 Ying Ye合作论文数6
 Manfred Wendisch合作论文数Leipzig Institute for Meteorology, University of Leipzig6
 B. Quack合作论文数6
 Marc H. Taylor合作论文数Center for Tropical Marine Ecology Fahrenheitstrasse 6 28359 Bremen Germany6mirjam blum合作论文数5Sebastian Hellmann合作论文数Dept Earth Sci, Swiss Fed Inst Technol5Sonja Wiegmann合作论文数5
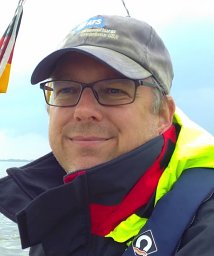 Martin Losch合作论文数Department of Earth;Planetary Sciences;Massachusetts Institute of Technology;Department of Earth, Massachusetts Institute of Technology5j oelker合作论文数4F. Steinmetz合作论文数4
 Alexander A. Kokhanovsky合作论文数4
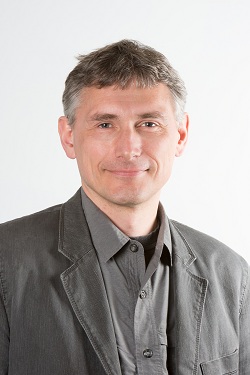 Detlef Guenther Mueller合作论文数School of Remote Sensing and Information Engineering, Wuhan University4
 G. J. Rohen合作论文数4
 Stephanie Dutkiewicz合作论文数Center for Global Change Science, Massachusetts Institute of Technology4
 B. Sierk合作论文数4
 Ralph A Kahn合作论文数NASA Goddard Space Flight Center;The University of Colorado Boulder4Eike Bierwirth合作论文数4Cheah Wee合作论文数Institute for Marine and Antarctic Studies, University of Tasmania3
 Wilken-Jon Von Appen合作论文数3
 Ian Salter合作论文数National Oceanography Centre, University of Southampton3
 Alexander Schladitz合作论文数3
 Evamaria Nothig合作论文数Alfred Wegener Institute for Polar and Marine Research3
 Birgit Heese合作论文数Leibniz Institute of Tropospheric Research, Leipzig, 04318, Germany3
 Peter Knippertz合作论文数Institute of Meteorology and Climate Research , Karlsruhe Institute of Technology3
 Annick Bricaud合作论文数Laboratoire de Physique et Chimie Marines3Bernard Gentili合作论文数3
 Kirstin Krüger合作论文数Department of Geosciences, Faculty of Mathematics and Natural Sciences, University Oslo3
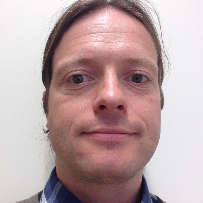 Bob Brewin合作论文数College of Life and Environmental Sciences, University of Exeter3
 Elliot Atlas合作论文数Department of Atmospheric Sciences, Rosenstiel School, University of Miami3
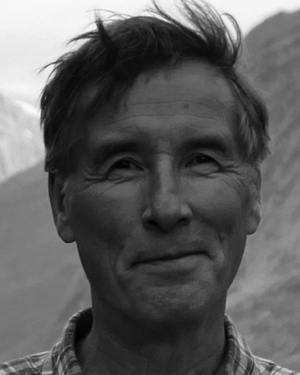 Dietrich Althausen合作论文数3
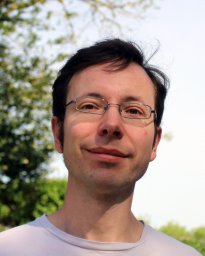 Matthias Tesche合作论文数Leipzig Institute for Meteorology, Leipzig University3
 Andreas Petzold合作论文数Fritz Lipmann Institute (FLI),, Leibniz Institute for Age Research3




