Cardiac 4D PC-MRI acquisitions gained increasing clinical interest in recent years. They allow to non-invasively obtain extensive information about patient-specific hemodynamics and thus have a great potential to improve the diagnosis of cardiovascular diseases. A dataset contains time-resolved, three-dimensional blood flow directions and strengths, facilitating comprehensive qualitative and quantitative data analysis. The quantification of measures such as stroke volumes helps to assess the cardiac function and monitor disease progression. Qualitative analysis allows to investigate abnormal flow characteristics, such as vortices, that are correlated to different pathologies. Processing the data comprises complex image processing methods as well as flow analysis and visualization. In this work, we mainly focus on the aorta. We provide an overview from data measurement and preprocessing to current visualization and quantification methods so that other researchers can quickly catch up with the topic and take on new challenges to further investigate the potential of 4D PC-MRI.
In clinical practice, hand drawn sketches are employed to express concepts and are an efficient method for the discussion of complex issues. We present computer graphic methods to improve and support the creation and annotation of complex sketches, resulting in a more clear, expressive and understandable result. For this, we consider the medical areas of teaching, treatment planning and patient education. Our applications allow students, educators, physicians and patients to sketch and annotate vascular structures, their pathologies and treatment options as well as to simulate and illustrate blood flow. The used sketching approaches take advantage of semi-immersive environments as well as interactive whiteboards to enable the creation of vessels either in their spatially complex 3D representation or as a simplified 2D illustration. We evaluate our work in interviews with physicians and user studies to assess their usability and to reveal their benefits to support the respective medical domain.
Four-dimensional phase-contrast magnetic resonance imaging (4D PC-MRI) is a method to non-invasively acquire blood flow in the aorta. This flow is commonly visualized as path lines inside of the vessels. Direct volume rendering (DVR) uses a transfer function to directly render the dataset without needing a manual segmentation. Since the transfer function can be manipulated on the fly, DVR allows fast exploration of the dataset. Using a simple intensity-based transfer function, however, either the intravascular blood flow would be hidden behind the vessel’s front side or the entire vessel has to be culled from the visualization. Therefore, we propose an automated mechanism that reveals the vessel anatomy by removing their front sides based on the viewing direction. This creates an effect similar to frontface culling on surface renderings. The visibility of focus objects inside the anatomy is guaranteed while spatial awareness is mostly maintained due to the presence of anatomical structures as context information. While we were able to confirm the effectiveness of our method in an interview with a collaborating radiologist, it still proved to be somewhat limited by the data quality and lack of a manual segmentation.
Four-dimensional phase-contrast magnetic resonance imaging (4D PC-MRI) allows the non-invasive acquisition of time-resolved, 3D blood flow information. Stroke volumes (SVs) and regurgitation fractions (RFs) are two of the main measures to assess the cardiac function and severity of valvular pathologies. The flow rates in forward and backward direction through a plane above the aortic or pulmonary valve are required for their quantification. Unfortunately, the calculations are highly sensitive towards the plane's angulation since orthogonally passing flow is considered. This often leads to physiologically implausible results. In this work, a robust quantification method is introduced to overcome this problem. Collaborating radiologists and cardiologists were carefully observed while estimating SVs and RFs in various healthy volunteer and patient 4D PC-MRI data sets with conventional quantification methods, that is, using a single plane above the valve that is freely movable along the centerline. By default it is aligned perpendicular to the vessel's centerline, but free angulation (rotation) is possible. This facilitated the automation of their approach which, in turn, allows to derive statistical information about the plane angulation sensitivity. Moreover, the experts expect a continuous decrease of the blood flow volume along the vessel course. Conventional methods are often unable to produce this behaviour. Thus, we present a procedure to fit a monotonous function that ensures such physiologically plausible results. In addition, this technique was adapted for the usage in branching vessels such as the pulmonary artery. The performed informal evaluation shows the capability of our method to support diagnosis; a parameter evaluation confirms the robustness. Vortex flow was identified as one of the main causes for quantification uncertainties.
We present a sketching interface, which enables physicians to illustrate various vascular structures, diseases, and treatment options with integrated blood flow. This sketch-based interface provides medical doctors with an effective tool to illustrate different medical scenarios and support patient education. This work integrates methods from sketch-based interfaces and GPU-supported computational fluid dynamics. The usability of the prototype was assessed qualitatively and quantitatively. Additionally, we performed a structured interview with a physician to evaluate the benefits with respect to patient education. The results of the evaluation confirmed the usability of the prototype as well as the usefulness to support physicians during the process of patient education.
In this paper, we report on our experiences that we made during our contributions in the field of the visualization of flow characteristics. Mainly, we focused on the vortex flow classification in 4D PC-MRI as current medical studies assume a strong correlation between cardiovascular diseases and blood flow patterns such as vortices. For further analysis, medical experts are asked to manually extract and classify such vortices according to specific properties. We presented and evaluated techniques that enable a fast and robust vortex classification [MLK* 16, MKP* 16] that supports medical experts. The main focus in this paper is a report that describes our conversations with the domain experts. The dialog was the fundament that gave us the direction of what the experts need. We derived several requirements that should be fulfilled by our tool. From this, we developed a prototype that supports the experts. Finally, we describe the evaluation of our framework and discuss currently limitations.
This paper presents a method for clustering aortic vortical blood flow using a reliable dissimilarity measure combined with a clustering technique. Current medical studies investigate specific properties of aberrant blood flow patterns such as vortices, since a correlation to the genesis and evolution of various cardiovascular diseases is assumed. The classification requires a precise definition of spatio-temporal vortex entities, which is performed manually. This task is time-consuming for larger studies and error-prone due to inter-observer variability. In contrast, our method allows an automatic and reliable vortex clustering that facilitates the vortex classification. We introduce an efficient calculation of a dissimilarity measure that groups spatio-temporally adjacent vortices. We combine our dissimilarity measure with the most commonly used clustering techniques. Each combination was applied to 15 4D PCMRI datasets. The clustering results were qualitatively compared to a manually generated ground truth of two domain experts.
Four-dimensional phase-contrast magnetic resonance imaging (4D PC-MRI) acquisitions facilitate the assessment of time-resolved, 3D blood flow information. Vortex flow in the aorta or pulmonary artery is of special clinical interest, since it can be an indicator for different pathologies of the cardiovascular system. Qualitative methods commonly employ animated pathlines to depict the time-varying flow. Visual clutter is reduced via vortex flow extraction. Since vortices are often not present during the full cardiac cycle, parts of the animation show an empty vessel or flow that is not of interest. To exploit the given video length more efficiently, we propose Vortex Animations with Adaptive Speed (VAAS), which depend on the time- and view-dependent feature visibility. Collaborating experts considered our technique as useful for presentations, case discussions and documentation purposes. Four diverse datasets are presented in a qualitative evaluation.
Diese Arbeit untersucht die Verwendung eines stereoskopischen Monitors sowie die Stift-basierte Eingabe zur Exploration der Halswirbelsäule und Inspektion einzelner Wirbel. Die Exploration medizinischer Strukturen erleichtert das Verstehen und Erlernen anatomischer Zusammenhänge und kann somit Ärzte in der Ausbildung unterstützen. Die Stiftinteraktion basiert auf einer Metapher, welche durch eine Fokusund Kontexttechnik unterstützt wird. Die Eignung des 3D-User Interfaces wird evaluiert sowie quantitativ und qualitativ ausgewertet.
Purpose 4D PC-MRI enables the noninvasive measurement of time-resolved, three-dimensional blood flow data that allow quantification of the hemodynamics. Stroke volumes are essential to assess the cardiac function and evolution of different cardiovascular diseases. The calculation depends on the wall position and vessel orientation, which both change during the cardiac cycle due to the heart muscle contraction and the pumped blood. However, current systems for the quantitative 4D PC-MRI data analysis neglect the dynamic character and instead employ a static 3D vessel approximation. We quantify differences between stroke volumes in the aorta obtained with and without consideration of its dynamics. Methods We describe a method that uses the approximating 3D segmentation to automatically initialize segmentation algorithms that require regions inside and outside the vessel for each temporal position. This enables the use of graph cuts to obtain 4D segmentations, extract vessel surfaces including centerlines for each temporal position and derive motion information. The stroke volume quantification is compared using measuring planes in static (3D) vessels, planes with fixed angulation inside dynamic vessels (this corresponds to the common 2D PC-MRI) and moving planes inside dynamic vessels. Results Seven datasets with different pathologies such as aneurysms and coarctations were evaluated in close collaboration with radiologists. Compared to the experts’ manual stroke volume estimations, motion-aware quantification performs, on average, 1.57 % better than calculations without motion consideration. The mean difference between stroke volumes obtained with the different methods is 7.82 %. Automatically obtained 4D segmentations overlap by 85.75 % with manually generated ones. Conclusion Incorporating motion information in the stroke volume quantification yields slight but not statistically significant improvements. The presented method is feasible for the clinical routine, since computation times are low and essential parts run fully automatically. The 4D segmentations can be used for other algorithms as well. The simultaneous visualization and quantification may support the understanding and interpretation of cardiac blood flow.
Aortic vortex flow is a strong indicator for various cardiovascular diseases. The correlation of pathologies like bicuspid aortic valves to the occurrence of such flow patterns at specific spatio-temporal positions during the cardiac cycle is of great interest to medical researchers. Dataset analysis is performed manually with common flow visualization techniques such as particle animations. For larger patient studies this is time-consuming and quickly becomes tedious. In this paper, we present a two-dimensional plot visualization of the aorta that facilitates the assessment of occurring vortex behavior at one glance. For this purpose, we explain a mapping of the 4D flow data to circular 2D plots and describe the visualization of the employed λ2-vortex criterion. A grid view allows the simultaneous investigation and comparison of multiple datasets. After a short familiarization with the plots our collaborating cardiologists and radiologists were able distinguish between patient and healthy volunteer datasets with ease.
In this paper, we present a sketch-based interface, which allows medical doctors to illustrate different vascular diseases and treatment methods as well as fluid behavior. With this sketching interface, we provide the physician with an effective tool to illustrate different medical cases, which is important in the complex field of vascular diseases with respect to patient education. We use techniques from sketch-based interfaces and GPU-based computational fluid dynamics by considering usability aspects. We provide a concept and a prototypical implementation whose usability is tested with quantitative and qualitative methods. Additionally, we interviewed a physician to assess the benefits of the tool with respect to patient education.
Four-dimensional phase-contrast magnetic resonance imaging (4D PC-MRI) is a relatively young image modality that allows the non-invasive acquisition of time-resolved, three-dimensional blood flow information. Stroke volumes and regurgitation fractions are two of the main measures to assess the cardiac function and severity of pathologies. The flow volumes in forward and backward direction through a plane inside the vessel are required for their quantification. Unfortunately, the calculations are highly sensitive towards the plane's angulation since orthogonally passing flow is considered. This often leads to physiologically implausible results. In this work, a robust quantification method is introduced to overcome this problem. Collaborating radiologists and cardiologists were carefully observed while estimating stroke volumes in various healthy volunteer and patient datasets with conventional quantification. This facilitated the automatization of their approach which, in turn, allows to derive statistical information about the plane angulation sensitivity. Moreover, the experts expect a continuous decrease of the stroke volume along the vessel course after a peak value above the aortic valve. Conventional methods are often unable to produce this behavior. Thus, we present a procedure to fit a function that ensures such physiologically plausible results. In addition, the technique was adapted for the robust quantification of regurgitation fractions. The performed qualitative evaluation shows the capability of our method to support diagnosis, a parameter evaluation confirms the robustness. Vortex flow was identified as main cause for quantification uncertainties.
AbstractObjectiveTo test the hypothesis that myocardial scars after repair of tetralogy of Fallot are related to impaired cardiac function and adverse clinical outcome.MethodsA total of 53 patients were retrospectively analysed after repair of tetralogy of Fallot. The median patient age was 20 years (range 2–48).Cardiac MRI with a 1.5 T magnet included cine sequences to obtain volumes and function, phase-sensitive inversion recovery delayed enhancement imaging to detect myocardial scars, and flow measurements to determine pulmonary regurgitation fraction. In addition, clinical parameters were obtained.ResultsAn overall 83% of patients were in NYHA class I. All patients with the exception of 2 (96%) had pulmonary insufficiency. Mean ejection fraction and end-diastolic volume index were 46% and 128 ml/m2 for the right ventricle and 54% and 82 ml/m2 for the left ventricle, respectively. Excluding enhancement of the septal insertion and prosthetic patches, delayed enhancement was seen in 11/53 cases (21%). Delayed enhancement of the right ventricle was detected in 6/53 patients (11%) and of the left ventricle in 5/53 patients (9%). The patient group with delayed enhancement was significantly older (p=0.003), had later repair (p=0.007), and higher left ventricular myocardial mass index (p=0.009) compared with the group without delayed enhancement.ConclusionsThis study reveals that scarring is common in patients after surgical repair of tetralogy of Fallot and is associated with older age and late repair. However, there was no difference in right ventricular function, NYHA class, or occurrence of clinically relevant arrhythmias between patients with and those without myocardial scars.
Aortic vortex flow is a strong indicator for various cardiovascular diseases. The correlation of pathologies like bicuspid aortic valves to the occurrence of such flow patterns at specific spatio-temporal positions during the cardiac cycle is of great interest to medical researchers. Dataset analysis is performed manually with common flow visualization techniques such as particle animations. For larger patient studies this is time-consuming and quickly becomes tedious. In this paper, we present a two-dimensional plot visualization of the aorta that facilitates the assessment of occurring vortex behavior at one glance. For this purpose, we explain a mapping of the 4D flow data to circular 2D plots and describe the visualization of the employed λ2-vortex criterion. A grid view allows the simultaneous investigation and comparison of multiple datasets. After a short familiarization with the plots our collaborating cardiologists and radiologists were able distinguish between patient and healthy volunteer datasets with ease.
Ziel unserer Studie war es, zu testen, ob myokardiale Narben nach operativ korrigierter Fallot-Tetralogie einen Einfluss auf die kardiale Funktion und klinische Parameter haben.
Classification of breast tumors solely based on dynamic contrast enhanced magnetic resonance data is a challenge in clinical research. In this paper, we analyze how the most suspect region as group of similarly perfused and spatially connected voxels of a breast tumor contributes to distinguishing between benign and malignant tumors. We use three density-based clustering algorithms to partition a tumor in regions and depict the most suspect one, as delivered by the most stable clustering algorithm. We use the properties of this region for each tumor as input to a classifier. Our preliminary results show that the classifier separates between benign and malignant tumors, and returns predictive attributes that are intuitive to the expert.
Background Two-dimensional (2D) phase contrast (PC) magnetic resonance imaging (MRI) enables non-invasive measurements of forward and backward flow, shunt volumina and peak velocity. It is an important tool in the diagnosis and follow-up of patients with congenital or acquired cardiovascular diseases. However, planning and repeated acquisition of multiple 2D measurements is timeconsuming and data analysis is restricted to those areas that were targeted during the scan. Four-dimensional (4D) PC MRI enables flow assessment through all cardiac valves and mediastinal vessels during one acquisition. The purpose of our study was to compare the 4 dimensional (4D) phase contrast (PC) technique against the established 2 dimensional (2D) technique and test the feasibility of the 4D technique. Methods We included 3 volunteers and 10 patients. 2D PC measurements were performed either at a 1.5T or a 3.0T and 4D flow measurements at a 3.0T MR device. Statistical analysis included the Wilcoxon test, Pearson correlation coefficient, linear regression analyses and Bland-Altman plots.
In clinical research on diagnosis and evaluation of brain tumors, longitudinal perfusion MRI studies are acquired for tumor grading as well as to monitor and assess treatment response and patient prognosis. Within this work, we demonstrate how visual analysis techniques can be adapted to multidimensional datasets from such studies within a framework to support the computer-aided diagnosis of brain tumors. Our solution builds on two innovations: First, we introduce a pipeline yielding comparative, co-registered quantitative perfusion parameter maps over all time steps of the longitudinal study. Second, based on these time-dependent parameter maps, visual analysis methods were developed and adapted to reveal valuable insight into tumor progression, especially regarding the clinical research area of low grade glioma transformation into high grade gliomas. Our examination of four longitudinal brain studies demonstrates the suitability of the presented visual analysis methods and comprises new possibilities for the clinical researcher to characterize the development of low grade gliomas.
 Bernhard Preim合作论文数Department of Simulation and Graphics, University of Magdeburg, Germany31
 Benjamin Köhler合作论文数10
 Matthias Friedrich合作论文数Departments of Medicine and Diagnostic Radiology, Division of Experimental Medicine, Faculty of Medicine and Health Sciences, McGill University;Montreal Heart Institute, Université de Montréal;Max-Delbrück-Centrum für Molekulare Medizin8Sylvia Glaßer合作论文数7Fischbach Katharina合作论文数6
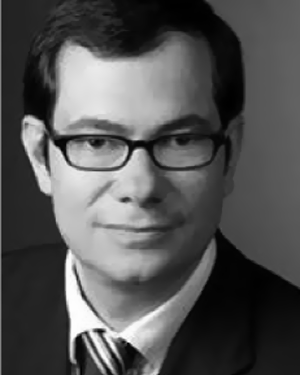 Matthias Gutberlet合作论文数6Lukas Lehmkuhl合作论文数Radiology, Heart Center Leipzig5
 Kai Lawonn合作论文数Faculty of Mathematics and Computer Science, Leipzig University5
 Patrick Saalfeld合作论文数4
 Monique Meuschke合作论文数Otto-von-Guericke University Magdeburg4
 Janine Hoffmann合作论文数4J. Dornheim合作论文数3Jana Kehrmann合作论文数3Strauss G合作论文数3
 Alexandra Baer合作论文数3Jeanette Cordes合作论文数3Matthias Grothoff合作论文数Leipzig Heart Center3Ingo Daehnert合作论文数3I. Hertel合作论文数2
 Dietz Andreas合作论文数2
 Philipp Sommer合作论文数2Thomas F Schulz合作论文数2Jürgen Meixensberger合作论文数2
 Klaus D. Tönnies合作论文数Dept Comput Sci, Otto von Guericke Univ Magdeburg2Dirk Winkler合作论文数2
 Oliver Burgert合作论文数Innovation Center Computer Assisted Surgery, Semmelweisstraße 14, 04103 Leipzig, Germany2Jana Dornheim合作论文数2Heiko Seim合作论文数2
 Steven Birr合作论文数2Andreas Greiser合作论文数2Jeanette Mönch合作论文数2B Köhler合作论文数1W. Mohnike合作论文数1Silvia Born合作论文数1Karl-Jürgen Oldhafer合作论文数1Franziska Riese合作论文数1
 Benjamin Behrendt合作论文数1
 Sylvia Saalfeld合作论文数STIMULATE Research Campus1
 Atle Bjørnerud合作论文数1
 Steffen Oeltze-Jafra合作论文数Innovat Ctr Comp Assisted Surg, Univ Leipzig1
 Holger Theisel合作论文数Department of Simulation and Graphics, Faculty of Computer Science, University of Magdeburg1
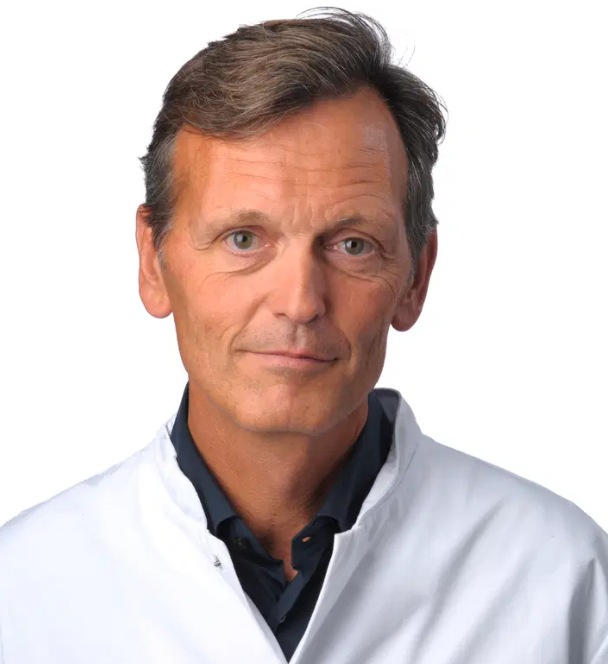 Jens Ricke合作论文数Klinik Und Poliklinik Für Radiologie, LMU Klinikum;Medizinischen Fakultät Der LMU München1
 Helwig Hauser合作论文数Department of Informatics, Faculty of Mathematics and Natural Sciences, University of Bergen1
 Myra Spiliopoulou合作论文数Knowledge Management and Discovery Lab, Otto-von-Guericke-University Magdeburg;Faculty of Computer Science, Otto-von-Guericke-University Magdeburg1F Hause合作论文数1
 Steffen Oeltze合作论文数Department of Simulation and Graphics
Faculty of Computer Science
University of Magdeburg1
Steffen Oeltze合作论文数Department of Simulation and Graphics
Faculty of Computer Science
University of Magdeburg1 Anja Hennemuth合作论文数Fraunhofer MEVIS1F. Füchtner合作论文数1




