In agricultural production, precision fertilization is affected by fertilizer drift and over fertilization causing low fertilizer use and extreme environmental pollution. Conventional fertilization systems cannot identify the location of crops in real time and precisely control the application of fertilizers. The proposed paper is a drift and over-fertilization prevention model, which is founded on the principle of visual recognition and variable operation. To begin with, a better YOLOv5 algorithm is applied to identify and position crops in real-time in the field, whereby the feature extraction networks and attention mechanisms are enhanced to increase the accuracy of the detection. Second, fertilizer drift prediction model is determined to compute fertilization offset by using wind speed, nozzle height and crop location, which dynamically changes spraying angle and position. Third, the variable fertilization control system is built to modify the rate of fertilizer application in real-time according to the prescription map (PM) and crop growth condition with an accurate fertilization by opening the solenoid valve by pulse width modulation (PWM). Lastly, there is a PID (Proportional-Integral-Derivative) controller, which aims at optimizing the speed of response. Field trials showed that the model achieved an average crop identification accuracy of 93.9%, reduced the average fertilization drift rate to 9.0%, and reduced both over-fertilization and under-fertilization to less than 5.5%.
In landslide susceptibility evaluation, scientific sampling minimizes potential societal losses and enhances the efficiency of disaster prevention and mitigation. However, traditional sampling methods, such as selecting landslide and non-landslide samples based on equal proportions or area proportions, overlook the different societal losses resulting from landslide omission and misreporting, and the potential societal losses faced by their evaluation results are often not minimized. Therefore, this study proposes a sampling method that takes potential societal losses into account and uses the Landslide Misjudgment Potential Societal Loss Evaluation Index (LMPSLEI) to quantify the total potential social losses in the area due to landslide omission and misreporting. The LMPSLEI is minimized by optimizing the sample ratio, thus minimizing the potential societal losses faced by the evaluation results and enhancing the scientific basis of disaster prevention and mitigation efforts. This study takes the Wenchuan earthquake area as the research region, selects 13 conditional factors and employs two models—Random Forest (RF) and Convolutional Neural Network (CNN)—to conduct case studies. We derive the recommended sample ratio based on the formula, hypothesizing that the LMPSLEI will be minimized under this ratio. The results show that the sample ratio for LMPSLEI minimization in the RF model is similar to the recommended sample ratio, while the sample ratio for LMPSLEI minimization in the CNN model is slightly higher than the recommended sample ratio. The recommended sample ratio can achieve the minimum of LMPSLEI or reach a lower value under different societal losses weights of landslide omission/misreporting, and thus it can be used as a preliminary choice of sampling for landslide susceptibility evaluation considering the potential societal losses.
Accurately characterizing sustainable development progresses of cities is crucial for identifying weak links and facilitating targeted policymaking. This study developed the hybrid weighted comprehensive evaluation model (HWCEM) that integrated multiple weighting calculation and indicator integration methods, thereby substantially reducing the sensitivity of results to methodological choices. The HWCEM model was used to a localized sustainable development indicator system constructed in this study, enabling the capture of spatiotemporal heterogeneity in SDG Index for 286 Chinese cities over 2010-2021. Geographically and temporally weighted regression and grey prediction model were applied to identify key driving factors and project future development trends. Results indicated an overall upward trend in SDG Index, with all cities surpassing a score of 55 by 2021. The shift in key driving factors of SDG Index occurred in 2014, transitioning from SDG 10.1.1 (Reduce income inequalities) to SDG 11.6.1 (Reduce the environmental impact of cities). A strong positive spatial correlation in SDG Index was observed, with "High-High" and "Low-Low" agglomeration areas expanding or shrinking in response to changes in the categories, driving forces, and marginal effects of key factors. By 2030, 82.17 % and 12.59 % of cities are projected to achieve SDG Index in the ranges of 60-70 and 70-80, highlighting the urgency of aligning future decisions with the identified drivers to accelerate sustainable development. This study provides a quantitative foundation and operational methodology for enhancing the reliability of sustainability assessments, thereby offering local governments robust scientific support for evidence-based policymaking toward sustainable development.
IntroductionCoffee, a vital beverage and cultural symbol, significantly influences global economic and cultural development. Due to the characteristics of agricultural production activities, such as areas, significant differences, and relatively low economic benefits per unit area, Traditional ground surveys often fail to accurately capture coffee crop distribution due to the large-scale, regionally varied, and economically modest nature of agricultural production. Remote sensing offers a promising alternative but faces challenges in distinguishing coffee from vegetation with similar spectral characteristics, especially in areas with complex land cover and dense canopies.MethodsThis study focuses on Pu’er City in Yunnan Province, China, renowned as the ‘golden belt’ of global coffee cultivation. Using Sentinel-2 remote sensing imagery, we analyzed key phenological features through time-series curves of the Normalized Difference Vegetation Index (NDVI), Ratio Vegetation Index (RVI), and Difference Vegetation Index (DVI). To ensure a balanced and representative dataset, interpretation keys were established from 1,617 field-measured sampling points, yielding a total of 4,000 coffee and non-coffee samples. Employing the Random Forest (RF) algorithm, we constructed a refined coffee crop extraction model incorporating spectral, texture, terrain, and regional pattern features.ResultsThe findings indicate: (1) Incorporating administrative division features and using a larger texture window size (5 × 5) enhances model accuracy, achieving an overall accuracy (OA) of 93.92% and a Kappa coefficient of 0.8783. (2) The four-period segmentation approach significantly improved accuracy, with the highest OA reaching 94.80%, identifying October to December (coffee fruiting season) as the most critical period for classification. (3) Administrative Division Features (ID), Topographical features (SLOPE) and vegetation indices (NDVI and DVI) were the most crucial for coffee classification, while texture features, except for Sum Average (SAVG), generally had lower importance.DiscussionThis study validates the effectiveness of remote sensing in monitoring and mapping coffee cultivation. The proposed feature input strategy shows strong potential for application in other regions with similar agro-ecological conditions, supporting precision agricultural management and promoting sustainable coffee farming practices.
PM2.5 is the primary source of urban atmospheric pollution, as it not only damages the ecological environment but also poses a threat to human health. Taking the Yangtze River Economic Belt as the research object, this study analyzes the spatiotemporal variation characteristics of PM2.5 concentrations in the region from 2005 to 2020. Furthermore, by combining the Geodetector model with Geographically and Temporally Weighted Regression (GTWR) model, the spatiotemporal heterogeneity of its influencing factors is revealed at three scales: municipal, watershed, and grid. The results show that, from 2005 to 2020, the annual average PM2.5 concentration in the Yangtze River Economic Belt exhibited an inverted U-shaped trend with 2013 as the inflection point, showing distinct spatial clustering characteristics. Overall, the spatiotemporal variation in annual average PM2.5 concentration demonstrated a significant downward trend during this period, with slower decline rates in the western region and faster rates in the central and eastern regions. Spatial differentiation of annual average PM2.5 concentrations within the region was primarily influenced by three factors: PFA, PISA, and PD. NDVI and PWA exerted their effects mainly at large scales, while MAT and SDE primarily acted at small scales. Within the region, NDVI and CVO predominantly suppressed PM2.5 concentrations, whereas MAT, PFA, PD, and SDE primarily promoted PM2.5 pollution. The spatial distribution of effects for factors within the same category is broadly consistent across the three scales, though details vary. This study overcomes previous limitations of administrative-scale research, yielding more refined results. It provides new methodologies and insights for future research while offering more precise scientific support for regional PM2.5 governance.
Very high-resolution (VHR) satellite imagery has emerged as a powerful tool for monitoring marine animals on a large scale. However, existing deep learning-based whale detection methods usually require manually created, high-quality bounding box annotations, which are labor-intensive to produce. Moreover, existing studies often exclude "uncertain whales", individuals that have ambiguous appearances in satellite imagery, limiting the applicability of these models in real-world scenarios. To address these limitations, this study introduces an automated pipeline for detecting beluga whales and harp seals in VHR satellite imagery. The pipeline leverages point annotations and the Segment Anything Model (SAM) to generate precise bounding box annotations, which are used to train YOLOv8 for multiclass detection of certain whales, uncertain whales, and harp seals. Experimental results demonstrated that SAM-generated annotations significantly improved detection performance, achieving higher F1-scores compared to traditional buffer-based annotations. YOLOv8 trained on SAM-labeled boxes achieved an overall F1-score of 72.2% for whales overall and 70.3% for harp seals, with superior performance in dense scenes. The proposed approach not only reduces the manual effort required for annotation but also enhances the detection of uncertain whales, offering a more comprehensive solution for marine animal monitoring. This method holds great potential for extending to other species, habitats, and remote sensing platforms, as well as for estimating whale biometrics, thereby advancing ecological monitoring and conservation efforts. The codes for our label and detection pipeline are publicly available at http://github.com/voyagerxvoyagerx/beluga-seeker.
The types of ecosystem services are complex and diverse. This study estimated four ecosystem services, their trade-offs, and their synergistic outcomes in 2010, 2015, and 2020 using the InVEST model. Globally, results showed that waterfront ecosystem services are high (low) in the north (south), and that high-value areas are mainly in Sweden and Finland in Europe; the Congo in Africa; Russia, Southwest China, and Indonesia in Asia; the Northwestern United States and Canada in North America, and northeastern Peru and northwestern Brazil in South America. Overall, ecosystem services changed little during 2010–2020. Additionally, a notable trade-off was found between water yield and habitat quality, and strong synergies were found between water yield and carbon storage and sequestration, water yield and sediment delivery ratio, carbon storage and sequestration and sediment delivery ratio, and carbon storage and habitat quality. The results of this study could help promote sustainable development of waterfronts globally.
Pixian Douban (PXDB) meju is a crucial intermediate product in the PXDB production. In this study, a machine vision system was employed to monitor and evaluate the meju quality quickly to replace the time-consuming chemical methods. The results of correlation analysis indicated that the physicochemical indicators were highly related to the color changes. The algorithmic results showed that the support vector machine was the most effective qualitative analysis method with 100% classification accuracy in the training set and 96.97% in the test set. The partial least square regression (PLSR) model showed high accuracy for the quantitative prediction of the meju, especially for the residual prediction deviation values of amino acid nitrogen and total titratable acid with 4.94 and 5.13, respectively. The distributions of physicochemical indicator contents at different fermentation stages were visualized by the PLSR model. This study provided a basis for monitoring the PXDB production in real time.
The main aim of this paper is to explore economic inequality in 'the Belt and Road' region where the investigation of the economic status is important but remains underdeveloped. The application of night-time satellite imagery in 2015 can effectively make up for the shortcomings of insufficient data at various scales, especially for developing countries. We explored inequality at a multi-scale level using the Theil decomposition method. As a result, (1) night-time light data can present economic development and assess inequality in 'the Belt and Road' region. (2) The between-sub-region inequality contributed most to disparity, while the between-country inequality was the least. Night-time light data in West Asia and Central and Eastern Europe was higher than that in other sub-regions. Countries within Central, Southeast and West Asia exhibited high inequalities, indicating an obvious sub-regional pattern. (3) Both positive and negative impacts of economic growth on inequality are observed, indicating that 'the Belt and Road' countries are in different stages of economic development. Nightlight satellite imagery can effectively monitor social-economic development and will play an important role in the implementation of 'the Belt and Road' initiative and achieving the sustainable development goals.
Rapid urbanization has resulted in various challenges, including a decline in environmental quality, traffic congestion, housing tensions, and employment difficulties. To address these issues, the United Nations introduced the “2030 Agenda for Sustainable Development”. One of the specific targets, 11.2.1, aims to tackle transportation problems. This study focuses on Guilin City, which is designated as an innovation demonstration zone for the national sustainable development agenda. The research conducted in this study examines the state of public transportation in six urban areas of Guilin City from 2015 to 2021, utilizing the United Nations Sustainable Development Goals (SDGs) indicator system, evaluation method, geospatial analysis, and entropy value method. The findings reveal that the coverage area of public transportation in the six urban areas of Guilin City expanded from 147.98 km2 in 2015 to 259.18 km2 in 2021. The percentage of the population with access to public transportation increased from 69.06% in 2015 to 71.63% in 2018 and further to 75.60% in 2021. While the accessibility of public transportation in the other four districts exceeds 90%, Lingui District and Yanshan District have lower accessibility, but it is gradually improving. The center of gravity for public transportation is also shifting towards the southwest, with Lingui District and Yanshan District experiencing gradual development. The evaluation score for sustainable development increased from 64.30 to 74.48, indicating a transition from a low sustainable development level to medium sustainable development level. Significant progress has been made in the indicators of the share of new energy buses, the rate of bus sharing, the coverage rate of bus stops, and the number of public transportation vehicles per 10,000 people. However, the indicators for the average distance between bus stops, the average speed of public transportation, and the density of public transportation routes are growing at a slower pace. The development of urban public transportation continues to improve, and the overall trend is positive. The sustainable development evaluation framework and positioning method proposed in this study serve as a reference for the sustainable development of Guilin City. Additionally, it provides insights for evaluating the sustainable development goals of public transportation in tourist cities like Guilin in China and worldwide.
This study investigated the spatiotemporal characteristics and influencing factors of PM2.5 concentrations at the provincial scale in China. The findings indicate significant spatial autocorrelation, with notable high–high agglomerations in East and North China and mixed patterns in the northwest. The spatial Durbin model (SDM) with fixed effects, validated through comprehensive tests, was utilized to analyze data on 31 provincial scale regions from 2000 to 2020, addressing spatial autocorrelation and ensuring model reliability. The research delved into the effects of 21 variables on PM2.5 concentrations, identifying synergistic and trade-off effects among environmental and socioeconomic indicators. Environmental measures like vegetation protection and sulfur dioxide emission reduction correlate with lower PM2.5 levels, whereas economic growth and transport volume often align with increased pollution. The analysis reveals regional variances in these effects, suggesting the need for region-specific policies. The study underscores the intricate relationship between environmental policies, economic development, and air quality, advocating for an integrated approach to air quality improvement. It highlights the necessity of balancing industrial growth with environmental sustainability and suggests targeted, region-specific strategies to combat PM2.5 pollution effectively. This study offers crucial insights for policymakers, emphasizing that enhancing air quality requires comprehensive strategies that encompass environmental, economic, and technological dimensions to foster sustainable development.
A high-resolution population distribution map is crucial for numerous applications such as urban planning, disaster management, public health, and resource allocation, and it plays a pivotal role in evaluating and making decisions to achieve the UN Sustainable Development Goals (SDGs). Although there are many population products derived from remote sensing nighttime light (NTL) and other auxiliary data, they are limited by the coarse spatial resolution of NTL data. As a result, the outcomes’ spatial resolution is restricted, and it cannot meet the requirements of some applications. To address this limitation, this study employs the nighttime light data provided by the SDGSAT-1 satellite, which has a spatial resolution of 10 m, and land use data as auxiliary data to disaggregate the population distribution data from WorldPop data (100 m resolution) to a high resolution of 10 m. The case study conducted in Guilin, China, using the multi-class weighted dasymetric mapping method shows that the total error during the disaggregation is 0.63%, and the accuracy of 146 towns in the study area is represented by an R2 of 0.99. In comparison to the WorldPop data, the result’s information entropy and spatial frequency increases by 345% and 1142%, respectively, which demonstrates the effectiveness of this approach in studying population distributions with high spatial resolution.
Knowledge about the spatial-temporal pattern of cropland abandonment is the premise for the management of abandoned croplands. Traditional mapping approaches of abandoned croplands usually utilize a multi-date classification-based land cover change trajectory. It requires quality training samples for land cover classification at each epoch, which is challenging in regions of smallholder agriculture in the absence of high-resolution imagery. Facing these challenges, a theoretical model is proposed to recognize abandoned croplands based on post-abandonment secondary succession. It applies the continuous change detection and classification (CCDC) temporal segmentation algorithm to Landsat time series (1986~2021) to obtain disjoint segments, representing croplands’ status. The post-abandonment secondary succession showing a greening trend is recognized using NDVI-based harmonic analysis, so as to capture its preceding abandonment. This algorithm is applied to a mountainous area in southwest China, where cropland abandonments are widespread. Validation based on stratified random samples referenced by a vegetation index time series and satellite images shows that the detected abandoned croplands have user accuracy, producer accuracy and an F1 score ranging from 43% to 71%, with variation among abandonment year. The study area has a potential cropland extent of 22,294 km2, within which 9252 km2 of the cropland was abandoned. The three peak years of abandonment were 1994, 2000, and 2011. The algorithm is suitable to be applied to large-scale mapping due to its automatic manner.
With the development of hyperspectral imaging technology, the potential for utilizing hyperspectral images to accurately estimate heavy metal concentrations in regional soil has emerged. Currently, soil heavy metal inversion based on laboratory hyperspectral data has demonstrated a commendable level of accuracy. However, satellite images are susceptible to environmental factors such as atmospheric and soil background, presenting a significant challenge in the accurate estimation of soil heavy metal concentrations. In this study, typical chromium (Cr)-contaminated agricultural land in Shaoguan City, Guangdong Province, China, was taken as the study area. Soil sample collection, Cr content determination, laboratory spectral measurements, and hyperspectral satellite image collection were carried out simultaneously. The Zhuhai-1 hyperspectral satellite image spectra were corrected to match laboratory spectra using the direct standardization (DS) algorithm. Then, the corrected spectra were integrated into an optimal model based on laboratory spectral data and sample Cr content data for regional inversion of soil heavy metal Cr content in agricultural land. The results indicated that the combination of standard normal variate (SNV)+ uninformative variable elimination (UVE)+ support vector regression (SVR) model performed best with laboratory spectral data, achieving a high accuracy with an R2 of 0.97, RMSE of 5.87, MAE of 4.72, and RPD of 4.04. The DS algorithm effectively transformed satellite hyperspectral image data into spectra resembling laboratory measurements, mitigating the impact of environmental factors. Therefore, it can be applied for regional inversion of soil heavy metal content. Overall, the study area exhibited a low-risk level of Cr content in the soil, with the majority of Cr content values falling within the range of 36.21–76.23 mg/kg. Higher concentrations were primarily observed in the southeastern part of the study area. This study can provide useful exploration for the promotion and application of Zhuhai-1 image data in the regional inversion of soil heavy metals.
Simulating the performance of the Sustainable Development Goals (SDGs) provides guidance to policymakers for faster achievement of the 2030 Agenda. However, current modeling and forecasting methods are not well thought out in terms of interactions between the SDGs. This study developed an iteration forecasting model considering the interactions of SDGs and simulated the SDGs’ progress from 2021 to 2030 for 41 cities in the Yangtze River Delta under various sustainable development paths. The results indicated that the cities with the highest levels of sustainable development in the Yangtze River Delta would only achieve half of the goals by 2030 if they continued on their past paths. Learning from other cities resulted in a more significant improvement in the achievement of SDGs. Furthermore, the higher the development cost, the better the achievement of the goals. Compared to the other goals, SDG11 and SDG13 required higher development costs to be achieved. We optimized the development paths by taking development costs and goal attainment into account. The results showed that cities with high levels of economic development are more likely than cities with low levels of economic development to achieve SDG8 and SDG9 by 2030, while the opposite is true for SDG15.
Landslides are one of the extremely high-incidence and serious-loss geological disasters in the world, and the early monitoring and warning of landslides are of great importance. The Cheyiping landslide, located in western Yunnan Province, China, added many cracks and dislocations to the surface of the slope due to the severe seasonal rainfall and rise of the water level, which seriously threaten the safety of residents and roads located on the body and foot of the slope. To investigate the movement of the landslide, this paper used Sentinel-1A SAR data processed by time-series interferometric synthetic aperture radar (InSAR) technology to monitor the long-time surface deformation. The landslide boundary was defined, then the spatial distribution of landslide surface deformation from 5 January 2018 to 27 December 2021 was obtained. According to the monthly rainfall data and the temporal deformation results, the movement of the landslide was highly correlated with seasonal rainfall, and the Cheyiping landslide underwent seasonal sectional accelerated deformation. Moreover, the water level change of the Lancang River caused by the water storage of the hydropower station and seasonal rainfall accelerates the deformation of the landslide. This case study contributes to the interpretation of the slow deformation mechanism of the Cheyiping landslide and early hazard warning.
An interpretable model based on the efficient combination of ensemble learning and permutation importance (PI), partial dependence plots (PDP), and the local interpretable model-agnostic explanations (LIME) algorithm was proposed in this work to facilitate the global and local interpretation of tunnel geothermal disaster susceptibility evaluations. The main goal was to provide more scientific theoretical support for the accurate evaluation of tunnel geothermal disaster susceptible areas. By considering the Ya'an–Changdu section of the Sichuan–Tibet traffic corridor as the research area – based on Landsat-8 images and other collected spatial data around the causes and distribution of the geothermal disasters in the tunnel – eight different evaluation factors were selected. Random forest (RF) and light gradient boosting machine (LightGBM) algorithms were used as the primary learning unit. In addition, a support vector machine (SVM) was used as the secondary learning unit. Through the implementation of the stacking algorithm, the susceptibility of tunnel geothermal disasters was evaluated. Then, the precision was verified by six evaluation indexes, and the interpretability of the ensemble learning model was studied by using three interpretation algorithms: PI, PDP, and LIME. From the extracted outcomes, it was demonstrated that the stacking algorithm for ensemble learning had the best performance and the highest prediction precision. The number of geothermal sample points in the high-susceptibility tunnel geothermal disaster area and the extremely highly susceptible area accounts for 85.57% of the total geothermal sample points, whereas the area accounts for 7.21% of the total area of the region. According to the model interpretation, land surface temperature (LST), fault density, and earthquake peak acceleration are regarded as the most important factors in the tunnel geothermal disaster susceptibility evaluation. The tunnel geothermal disaster susceptibility evaluation model based on interpretable ensemble learning has high precision, and is of great importance for the practical significance of the project route selection, construction, and operation of the Ya'an–Changdu section of the Sichuan–Tibet traffic corridor.
The specific building is of great significance in smart city planning, management practices, or even military use. However, traditional classification or target identification methods are difficult to distinguish different type of buildings from remote sensing images, because the characteristics of the environmental landscape around the buildings (like the pixels of the road and parking area) are complex, and it is difficult to define them with simple rules. Convolution neural networks (CNNs) have a strong capacity to mine information from the spatial context and have been used in many tasks of image processing. Here, we developed a novel CNN model named YOLO-S-CIOU, which was improved based on YOLOv3 for specific building detection in two aspects: (1) module Darknet53 in YOLOv3 was replaced with SRXnet (constructed by superimposing multiple SE-ResNeXt) to significantly improve the feature learning ability of YOLO-S-CIOU while maintaining the similar complexity as YOLOv3; (2) Complete-IoU Loss (CIoU Loss) was used to obtain a better regression for the bounding box. We took the gas station as an example. The experimental results on the self-made gas station dataset (GS dataset) showed YOLO-S-CIOU achieved an average precision (AP) of 97.62%, an F1 score of 97.50%, and had 59,065,366 parameters. Compared with YOLOv3, YOLO-S-CIOU reduced the parameters’ number by 2,510,977 (about 4%) and improved the AP by 2.23% and the F1 score by 0.5%. Moreover, in gas stations detection in Tumshuk City and Yanti City, the recall (R) and precision (P) of YOLO-S-CIOU were 50% and 40% higher than those of YOLOv3, respectively. It showed that our proposed network had stronger robustness and higher detection ability in remote sensing image detection of different regions.
The particle size distribution (PSD) slope (ξ) can indicate the predominant particle size, material composition, and inherent optical properties (IOPs) of inland waters. However, few semi-analytical methods have been proposed for deriving ξ from the surface remote sensing reflectance due to the variable optical state of inland waters. A semi-analytical algorithm was developed for inland waters having a wide range of turbidity and ξ in this study. Application of the proposed model to Ocean and Land Color Instrument (OLCI) imagery of the water body resulted in several important observations: (1) the proposed algorithm (754 nm and 779 nm combination) was capable of retrieving ξ with R2 being 0.72 (p < 0.01, n = 60), and MAPE and RMSE being 4.37% and 0.22 (n = 30) respectively; (2) the ξ in HZL was lower in summer than other seasons during the period considered, this variation was driven by the phenological cycle of algae and the runoff caused by rainfall; (3) the band optimization proposed in this study is important for calculating the particle backscattering slope (η) and deriving ξ because it is feasible for both algae dominant and sediment governed turbid inland lakes. These observations help improve our understanding of the relationship between IOPs and ξ, which are affected by different bio-optic processes and algal phenology in the lake environment.
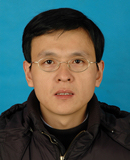 Qinjun Wang (王钦军)合作论文数中国科学院遥感与数字地球研究所11
 Yongming Wei (魏永明)合作论文数University of Chinese Academy of Sciences;Aerospace Information Research Institute, Chinese Academy of Sciences9
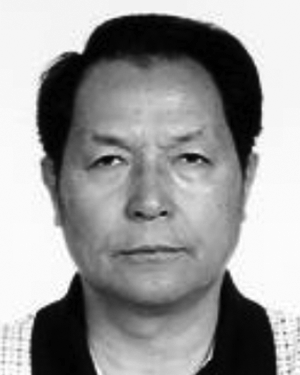 QiZhong Lin (蔺启忠)合作论文数7
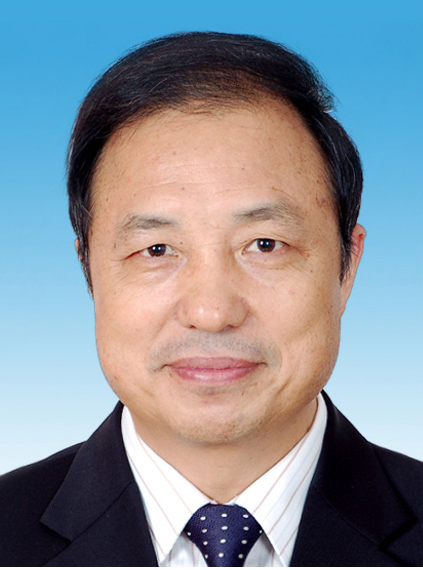 Huadong Guo (郭华东)合作论文数International Research Center of Big Data for Sustainable Development Goals;Aerospace Information Research Institute, Chinese Academy of Sciences;University of Chinese Academy of Sciences5
 Lin Li合作论文数Department of Earth Sciences, School of Science, IUPUI3
 Qingjie Liu (刘庆杰)合作论文数School of Computer Science and Engineering, Beihang University3
 Fang Chen (陈方)合作论文数Innovation Academy for Precision Measurement Science and Technology, Chinese Academy of Sciences;University of Chinese Academy of Sciences3
 Zhongchang Sun合作论文数Center for Earth Observation and Digital Earth, Chinese Academy of Sciences3
 Xianfeng Cheng合作论文数2chunyan lu合作论文数2Jingjing Xie合作论文数2
 Lei Shaohua合作论文数Department of Geography, Nanjing Normal University, Nanjing, China2
 Jiage Chen合作论文数2Haifeng Ding (丁海峰)合作论文数2
 Peng Liu (刘鹏)合作论文数南京林业大学土木工程学院2
 Yunwei Tang合作论文数Institute of Remote Sensing and Digital Earth, Chinese Academy of Sciences;c;Institute of Remote Sensing and Digital Earth, Chinese Academy of Sciences2Hui Li合作论文数2
 Linhai Jing (荆林海)合作论文数Institute of Remote Sensing and Digital Earth, Chinese Academy of Sciences2
 Yaomin Zheng (郑姚闽)合作论文数School of International Economics and Management, Beijing Technology and Business University2
 Huicong Jia合作论文数2
 Qi Zhu合作论文数2Yiting Gou合作论文数1Nicole C H Lai合作论文数1Ronnie M N Lo合作论文数1Yuying Bai合作论文数1
 Suchen Xu合作论文数1
 Fushan Yao合作论文数1
 YU Zheng-bo (余正波)合作论文数1Jinxiang Shen合作论文数1Qingwen Jin合作论文数1
 Jiannan Li合作论文数1Estella P. S. Tonga合作论文数1
 Lijiao Chang (常丽姣)合作论文数1Quanping Zhang合作论文数1Ziqiong He合作论文数1
 Ge Liu (刘阁)合作论文数University of Chinese Academy of Sciences;Northeast Institute of Geography and Agroecology, Chinese Academy of Sciences1Heng Zhou合作论文数1
 Linlin Lu (鹿琳琳)合作论文数1
 Rui Song合作论文数1
 Lu Zhang合作论文数1Liu Guang合作论文数1
 Yolanda Yuen Tung Li合作论文数1
 Yuanbing Jiang合作论文数Molecular Neuroscience Center, The Hong Kong University of Science and Technology1Qianrui Huang合作论文数1Ruichun Chang合作论文数1
 Zhe Chen合作论文数State Key Lab Geohazard Prevent & Geoenvironm Prot, Chengdu Univ Technol1Yuefeng Yao合作论文数1Xuting Liu合作论文数Southwest Univ, Coll Pharmaceut Sci, Minist Educ, Key Lab Luminescence Anal & Mol Sensing, Chongqing 400715, Peoples R China1Hongying Zhou合作论文数1




