Understanding the interaction between oceanic plates and the underlying asthenosphere and its impact on plate thickness is essential for explaining plate motions and mantle convection patterns. While sub-lithospheric small-scale convection provides an explanation for why oceanic plates do not continue to thicken after a certain age, many open questions still surround this process. Here, we link dynamic models of mantle flow, grain-scale processes, seismic imaging, and surface observations to gain new insights into the mechanisms of asthenospheric small-scale convection and its surface expressions. We have performed a series of high-resolution 3D numerical models of the evolution of oceanic plates and the development of thermal instabilities at their base using the open-source geomodeling software ASPECT. These simulations use an Earth-like rheology that includes coupled diffusion and dislocation creep as well as their interplay with an evolving olivine grain size. Our models quantify how the effective asthenospheric viscosity and the balance between diffusion and dislocation creep affect the morphology and temporal stability of small-scale sub-lithospheric convection, including the age of its onset, the average depth and wavelength of the small-scale convection rolls, and the amplitude of the temperature and grain size anomalies within the rolls. All of these quantities predicted by the dynamic models can be directly related to both geophysical observables and to surface manifestations such as dynamic topography and heat flux. To accurately compare our model outputs to geophysical data, we convert them to seismic velocity and attenuation using laboratory-derived constitutive relations and taking into account variations in temperature, pressure, grain size, water content and calculated stable melt fraction. We then create synthetic seismic tomography models of different dynamic scenarios and analyze their fit to observations from the Pacific OBS Research into Convecting Asthenosphere (ORCA) experiment. Comparison with both seismic imaging and surface expressions allows us to determine the parameter range in which geodynamic models fit these observations, providing new constraints on the convection patterns and the rheology of the oceanic asthenosphere beneath the Pacific Plate.
The interaction between aging oceanic plates and their underlying mantle is a crucial component of the plate tectonic cycle. Sub-lithospheric small-scale convection (SSC) explains why plates appear not to thicken after a certain age. Here, we link grain-scale processes, dynamic models of asthenospheric flow, and seismic observations to gain new insights into the mechanisms of SSC. We present high-resolution 3D geodynamic models of oceanic plate evolution with an Earth-like rheology including coupled diffusion/dislocation creep and their interplay with evolving olivine grain size. Our models quantify how rheology affects the morphology and temporal stability of SSC, and we directly relate these quantities to geophysical observations from the Pacific OBS Research into Convecting Asthenosphere (ORCA) experiment. We convert variations in temperature, pressure, grain size, water content and stable melt fraction to seismic velocity and attenuation, seeking to match the wavelength and pattern of observed longitudinal convective rolls, the young SSC onset age, the large seismic velocity heterogeneity, low absolute seismic velocities, and high seismic attenuation. This requires low ( Pa s) asthenospheric viscosity, the contribution of both diffusion and dislocation creep to deformation, and the presence of volatiles and melt. Although SSC occurs at plate ages 60 Ma in our best-fit model, the plate thermal structure approximately matches global observations of heat flux and bathymetry, indicating an important role of vigorous SSC in Earth's plate dynamics. However, reconciling all seismological observations is challenging, and additional mechanisms are required to explain the strong velocity heterogeneities suggested by body wave tomography.
Abstract Eastern North America was constructed over several Wilson cycles, culminating in the breakup of Pangea. Previous seismological imaging lacked the resolution to depict precisely how ancient tectonic boundaries manifest throughout the lithosphere, how continental breakup modified the plate, or how ongoing mantle dynamics shapes the continental margin. We present a high‐resolution, plate‐scale seismic tomography model of the eastern US by combining an unprecedented suite of complementary data sets in a Bayesian framework. These data provide detailed resolution from crust to asthenosphere, identifying the base of the lithosphere and mid‐lithospheric discontinuities. The plate thins in steps that align with ancient orogens. The lithospheric step at the Appalachian front is associated with cells of mantle upwellings, likely edge‐driven convection, that erode the base of the plate and shape modern Appalachian topography. Low‐velocity structures in the lithospheric‐mantle align with the Grenville front and may be remnants of Rodinia assembly.
The Southwestern United States experiences active deformation, seismicity, and magmatism, remarkable in an intraplate setting. The Basin and Range and Colorado Plateau (CP) are inferred to differ in lithospheric thickness, but modeling geophysical properties of the lithosphere, in particular the depth of the Lithosphere-Asthenosphere Boundary (LAB), across the entirety of the region, has proved challenging. Here, we introduce a new model of 1-D depth profiles in shear wavespeed, determined through a probabilistic joint inversion of information from Sp receiver functions and Rayleigh wave phase velocity. From these profiles we quantify the locations and Vs contrast of wavespeed gradients that represent boundaries such as the Moho, the LAB, and intralithospheric discontinuities. We infer a lithosphere that is thinner and lower in Vs in the Basin and Range. In the CP and farther north, the LAB is more gradual, deeper, and intermittently observed. We also observe Mid-Lithospheric Discontinuities (MLDs) near the boundaries between the CP, Wyoming Craton, and Northern Basin and Range, as well as within the Craton. When both an MLD and LAB are observed, the Vs gradient associated with the LAB is narrower than expected. Finally, we image Positive Velocity Gradients beneath areas of thinner lithosphere, which are consistent with recent global observations that have been attributed to the base of a partially molten zone below the lithosphere. Overall, the picture of the lithosphere-asthenosphere system that emerges is one of considerable structural complexity with a strong dependency on tectonic regime and geological history. We examine the properties of, and processes that shape, the lithosphere-the rigid outermost layer of the Earth, which participates in plate tectonics. Our focus is the southwestern United States where in fact the lithosphere does not behave like a simple, homogeneous, plate. Instead, in the Basin and Range Province, widespread deformation, frequent earthquakes, and recent volcanic activity are observed, all of which are rare for a location removed from plate boundaries. In the neighboring Colorado Plateau and the regions north and west of it, the lithosphere behaves more rigidly but volcanism is also observed. To understand how the lithosphere and mantle below vary, we produce a model of seismic wavespeed using data from surface waves, which travel along the Earth's surface, and converted body waves, which interact with interior boundaries such as the bottom of the lithosphere. This model enables us to find the depths of major boundaries and understand how the speed of seismic waves changes across them. We consistently observe decreases in seismic wavespeed that we associate with the bottom of the lithosphere or structures within the lithosphere. We also note wavespeed increases below the lithosphere that might indicate partial melting of rocks deep within the Earth. We perform a joint inversion for Vs in the upper mantle of the Southwestern U.S., using data from body wave scattering and surface waves The lithosphere varies regionally: it is flat and thin in the Basin and Range, thicker in the Colorado Plateau, and complex in cratonic regions Mid-Lithospheric Discontinuities are observed in cratonic regions, associated with sharp Vs gradients at the base of the lithosphere
Receiver functions can be used to estimate the Moho depth (H) and ratio of P to S wavespeed (α/β or κ) in the crust. This is commonly done by grid search, forward modeling travel times to produce so-called “H-κ” stacks of receiver function amplitude. However, radial anisotropy in the crust, which can be significant, is almost never considered in this process. Here, we show that radial anisotropy changes the H-κ stack, biasing interpretations of crustal structure by introducing errors up to ∼3% in H and ∼1% in κ for commonly observed anisotropy magnitudes. We propose a simple method to correct H-κ stacks by incorporating radial anisotropy in the forward calculation. Synthetic tests show that this approach almost completely removes error caused by radial anisotropy. We show examples of this procedure with stations in the eastern United States. We provide readers with code to construct radially anisotropic H-κ stacks.
The eastern North American margin has experienced a wide array of plate-scale tectonic deformational events, including the breakup of Pangaea. The margin may also host complex patterns of active asthenospheric mantle dynamics. Several studies have observed a strong change in anisotropy across the margin that have been interpreted variously as active asthenospheric flow or past lithospheric deformation. Separating these candidate processes has proven difficult. To constrain the likely source of the change in anisotropy across the margin, we examine scattered quasi-Love waves over three frequency ranges with peak sensitivities in the lithosphere (similar to 75 km), the uppermost mantle (similar to 150 km), and the asthenosphere (similar to 250 km). We observe strong quasi-Love wave scattering along the margin in the lowest two frequency bands but far fewer scatterers in the lithosphere- dominated highest frequency band. The clear frequency dependence suggests a change in anisotropy across the margin is likely located in the asthenosphere and related to active mantle dynamics.
ABSTRACT Linear scattering of ocean wave energy at the ocean–continent transition structure causes the primary microseism at a period of 14 s. Subsequent nonlinear wave–wave interactions produce the secondary microseism signal at half the primary microseism period (Longuet-Higgins, 1950; Haubrich et al., 1963). We use three years (2018–2022) of seismic data from an ongoing microarray deployment in the UC Santa Barbara Sedgwick Reserve, situated in the Santa Ynez Valley, to constrain seasonal and long-term microseismic noise characteristics for this portion of California’s central coast. Ancillary buoy data (spectral data, wave height, wind speed and direction) from the National Oceanic and Atmospheric Administration are used to explore the causal relationship between ocean swell and the generation of microseisms. This region is found to exhibit strong seasonality in the primary and secondary microseism bands (0.05–0.1 and 0.1–0.3 Hz, respectively), with much higher noise levels in the winter compared with the summer, especially for the secondary microseism (15.4 dB). We also observe a systematic shift in the peak frequency of the secondary microseism between the winter (∼0.14 Hz) and summer (∼0.20 Hz) months, which may reflect a difference in sources of secondary microseisms between the two seasons. Local buoy wave height and spectral data are well correlated with seismic power spectra during times of incoming storm swell in winter, indicating locally generated microseisms along the central coast during this season.
The proliferation of broadband ocean bottom seismometer (BBOBS) deployments over the last two decades has generated key datasets from diverse marine environments, improving our understanding of tectonics and earthquake processes. In turn, the community of scientists using this data has expanded. This growth in BBOBS data collection is likely to persist with the arrival of new seismic seafloor technologies, and continued scientific interest in marine and amphibious targets. However, the noise inherent in OBS data poses a challenge that is markedly different from that of terrestrial data. As a step towards improved understanding of the sources of variability in this noise, we present a new compilation and analysis of BBOBS noise properties from 15 years of US-led seismic deployments. We find evidence for similarity of noise properties when grouped across a variety of parameters, with groupings by seismometer type and deployment water depth yielding the most significant and interpretable results. Instrument design, that is the entire deployed package, also plays an important role, although it strongly covaries with seismometer and water depth. We find that the presence of tilt noise is primarily dependent on the type of seismometer used (covariant with a particular subset of instrument design), that compliance noise follows anticipated relationships with water depth, and that shallow, oceanic shelf environments have systematically different microseism noise properties (which are, in turn, different from instruments deployed in shallow lake environments). We discuss implications for the viability of commonly used seismic analysis techniques, and future directions for improvements in the efficiency of analysis of BBOBS data.
We present a new compilation and analysis of broadband ocean bottom seismometer noise properties from 15 years of seismic deployments. We compile a comprehensive dataset of representative four-component (seismometer and pressure gauge) noise spectra and cross-spectral properties (coherence, phase, and admittance) for 551 unique stations spanning 18 US-led experiments. This is matched with a comprehensive compilation of metadata parameters related to instrumentation and environmental properties for each station. We systematically investigate the similarity of noise spectra by grouping them according to these metadata parameters to determine which factors are the most important in determining noise characteristics. We find evidence for improvements in similarity of noise properties when grouped across parameters, with groupings by seismometer type and deployment water depth yielding the most significant and interpretable results. Instrument design, that is the entire deployed package, also plays an important role, although it strongly covaries with seismometer and water depth. We assess the presence of traditional sources of tilt, compliance, and microseismic noise to characterize their relative role across a variety of commonly used seismic frequency bands. We find that the presence of tilt noise is primarily dependent on the type of seismometer used (covariant with a particular subset of instrument design), that compliance noise follows anticipated relationships with water depth, and that shallow, oceanic shelf environments have systematically different microseism noise properties (which are, in turn, different from instruments deployed in shallow lake environments). These observations have important implications for the viability of commonly used seismic analysis techniques. Finally, we compare spectra and coherences before and after vertical channel tilt and compliance noise removal to evaluate the efficacy and limitations of these now standard processing techniques. These findings may assist in future experiment planning and instrument development, and our newly compiled noise dataset serves as a building block for more targeted future investigations by the marine seismology community.
The East African Rift System provides a rare location in which to observe a wide scope of rifting states. Well‐defined active narrow rifting in the Main Ethiopian Rift (MER) transitions to incipient extension and eventually pre‐rifted lithosphere through the northwestern flank of the Ethiopian Plateau (EP). Although the MER is well studied, the off‐axis region has received less attention. We develop Rayleigh wave phase velocity maps, Ps receiver functions, and H‐κ stack surfaces, and jointly invert these data using a trans‐dimensional, hierarchical Bayesian inversion algorithm to create shear velocity profiles across the MER and EP. All shear velocities observed are slower than the PREM global average, a reflection of the elevated temperatures that persist from plume impingement. In the EP, we find a shallow mantle slow shear velocity lineament parallel to the MER axis, amidst otherwise faster shear velocities. The crust is shallow in the MER, and also in the northwestern‐most EP flank. Thicker crust found elsewhere throughout the plateau is caused by crustal underplating and flood basalt emplacement. Shear velocities more reduced than the already low regional average, in concert with surficial volcanic features, geodetic observations, and slow P‐ and S‐wave anomalies, support off‐axis extension in the Ethiopian plateau, requiring reevaluation of the localization of continental breakup in the narrow MER.
Abstract Small‐scale convection beneath the oceanic plates has been invoked to explain off‐axis nonplume volcanism, departure from simple seafloor depth‐age relationships, and intraplate gravity lineations. We deployed 30 broadband ocean bottom seismometer stations on ∼40 Ma Pacific seafloor in a region notable for gravity anomalies, measured by satellite altimetry, elongated parallel to plate motion. P‐wave teleseismic tomography reveals alternating upper mantle velocity anomalies on the order of ±2%, aligned with the gravity lineations. These features, which correspond to ∼300°–500°K lateral temperature contrast, and possible hydrous or carbonatitic partial melt, are—surprisingly—strongest between 150 and 260 km depth, indicating rapid vertical motions through a low‐viscosity asthenospheric channel. Coherence and admittance analysis of gravity and topography using new multibeam bathymetry soundings substantiates the presence of mantle density variations, and forward modeling predicts gravity anomalies that qualitatively match observed lineations. This study provides observational support for small‐scale convective rolls beneath the oceanic plates.
1. Department of Earth Sciences, University of Hawaiʻi at Mānoa, Honolulu, HI 2. Dept. of Earth Science, University of California, Santa Barbara, CA 3. Dept. of Earth, Environmental and Planetary Sciences, Brown University, Providence, RI 4. School of Earth & Sustainability, Northern Arizona University, Flagstaff, AZ 5. Department of Earth and Environmental Sciences, University of Ottawa, Ottawa, Canada 6. Lamont-Doherty Earth Observatory of Columbia University, Palisades, NY
While variations in crustal structure beneath the Denali fault in Alaska are well‐documented, the existence of fault‐correlated structures throughout the entire thickness of the continental lithosphere is not. A new model of shear‐wave velocity structure obtained through joint inversion of surface wave and converted body wave data shows a northward increase in lithospheric thickness and velocity occurring across the Denali fault system. In northern Alaska, a dramatic increase in lithospheric thickness at the southern margin of the Arctic‐Alaska terrane lies in the vicinity of the Kobuk fault system. These correlations support the view that transpressive deformation tends to localize at the margins of thicker, higher‐strength lithosphere.
The Pacific ocean-bottom seismometer (OBS) Research into Convecting Asthenosphere (ORCA) experiment deployed two 30-station seismic arrays between 2018 and 2020-a US contribution to the international PacificArray project. The "Young ORCA" array deployed on -40 Ma central Pacific seafloor had a -68% data recovery rate, whereas the "Old ORCA" array deployed on -120 Ma southwest Pacific seafloor had a -80% recovery rate. We detail here the seismic data quality, spectral characteristics, and engineering challenges of this experiment. We provide information to assist users of this dataset, including OBS orientations and tables of daily data quality for all channels. Preliminary analysis illustrates the utility of these data for surface- and body-wave seismic imaging.
Seismic deployments in the Alaska subduction zone provide dense sampling of the seismic wavefield that constrains thermal structure and subduction geometry. We measure P and S attenuation from pairwise amplitude and phase spectral ratios for teleseismic body waves at 206 stations from regional and short‐term arrays. Parallel teleseismic travel‐time measurements provide information on seismic velocities at the same scale. These data show consistently low attenuation over the forearc of subduction systems and high attenuation over the arc and backarc, similar to local‐earthquake attenuation studies but at 10× lower frequencies. The pattern is seen both across the area of normal Pacific subduction in Cook Inlet, and across the Wrangell Volcanic Field where subduction has been debated. These observations confirm subduction‐dominated thermal regime beneath the latter. Travel times show evidence for subducting lithosphere much deeper than seismicity, while attenuation measurements appear mostly reflective of mantle temperature less than 150 km deep, depths where the mantle is closest to its solidus and where subduction‐related melting may take place. Travel times show strong delays over thick sedimentary basins. Attenuation signals show no evidence of absorption by basins, although some basins show signals anomalously rich in high‐frequency energy, with consequent negative apparent attenuation. Outside of basins, these data are consistent with mantle attenuation in the upper 220 km that is quantitatively similar to observations from surface waves and local‐earthquake body waves. Differences between P and S attenuation suggest primarily shear‐modulus relaxation. Overall the attenuation measurements show consistent, coherent subduction‐related structure, complementary to travel times.
A decade-long research collaboration has revealed that the split between Africa and North America roughly 200 million years ago was more drawn out than previously thought.
Abstract Little has been seismically imaged through the lithosphere and mantle at rifted margins across the continent‐ocean transition. A 2014–2015 community seismic experiment deployed broadband seismic instruments across the shoreline of the eastern North American rifted margin. Previous shear‐wave splitting along the margin shows several perplexing patterns of anisotropy, and by proxy, mantle flow. Neither margin parallel offshore fast azimuths nor null splitting on the continental coast obviously accord with absolute plate motion, paleo‐spreading, or rift‐induced anisotropy. Splitting measurements, however, offer no depth constraints on anisotropy. Additionally, mantle structure has not yet been imaged in detail across the continent‐ocean transition. We used teleseismic S, SKS, SKKS, and PKS splitting and differential travel times recorded on ocean‐bottom seismometers, regional seismic networks, and EarthScope Transportable Array stations to conduct joint isotropic/anisotropic tomography across the margin. The velocity model reveals a transition from fast, thick, continental keel to low velocity, thinned lithosphere eastward. Imaged short wavelength velocity anomalies can be largely explained by edge‐driven convection or shear‐driven upwelling. We also find that layered anisotropy is prevalent across the margin. The anisotropic fast polarization is parallel to the margin within the asthenosphere. This suggests margin parallel flow beneath the plate. The lower oceanic lithosphere preserves paleo‐spreading‐parallel anisotropy, while the continental lithosphere has complex anisotropy reflecting several Wilson cycles. These results demonstrate the complex and active nature of a margin which is traditionally considered tectonically inactive.
SUMMARY Measurements of various physical properties of oceanic sediment and crustal structures provide insight into a number of geological and geophysical processes. In particular, knowledge of the shear wave velocity (VS) structure of marine sediments and oceanic crust has wide ranging implications from geotechnical engineering projects to seismic mantle tomography studies. In this study, we propose a novel approach to nonlinearly invert compliance signals recorded by colocated ocean-bottom seismometers and high-sample-rate pressure gauges for shallow oceanic shear wave velocity structure. The inversion method is based on a type of machine learning neural network known as a mixture density neural network (MDN). We demonstrate the effectiveness of the MDN method on synthetic models with a fixed deployment depth of 2015 m and show that among 30 000 test models, the inverted shear wave velocity profiles achieve an average error of 0.025 km s−1. We then apply the method to observed data recorded by a broad-band ocean-bottom station in the Lau basin, for which a VS profile was estimated using Monte Carlo sampling methods. Using the mixture density network approach, we validate the method by showing that our VS profile is in excellent agreement with the previous result. Finally, we argue that the mixture density network approach to compliance inversion is advantageous over other compliance inversion methods because it is faster and allows for standardized measurements.
The present-day lithospheric structure of Alaska is the result of a unique tectonic history of subduction and terrane accretion that controls upper plate thickness and rheology. To provide new constraints on the structure of the crust and upper mantle beneath Alaska, we jointly inverted Sp receiver functions and Rayleigh wave phase velocities to calculate shear-wave velocity profiles. Robust Sp receiver functions were obtained using a broad range of frequencies (2-100 s), time-domain deconvolution, and K-means cluster analysis. Tests of the Bayesian joint inversion with synthetic data illustrate that Sp receiver functions enhance the resolution of the velocity gradients at the Moho and the lithosphere-asthenosphere boundary, while Rayleigh surface waves provide information about absolute velocities. Our results show that in central Alaska, above the shallow slab, the continental lithosphere is thinnest (similar to 60 km) and the asthenosphere has its lowest velocities. This zone coincides with the Denali Volcanic Gap. The continental lithosphere thickens to the north beneath the Brooks Range and the northern Arctic Alaska terrane, reaching values of 110 to 130 km, with high lithospheric velocities that are comparable to Archean cratons. This pattern is consistent with a northward decrease in upper plate modification by melt and volatiles derived from the slab, in addition to intrinsic mantle velocity and viscosity differences between inherited lithospheric terranes. Lithospheric and asthenospheric velocities are not significantly different inside and outside of the Denali Volcanic Gap, but at the boundaries of this region lithospheric thickness increases rapidly to the north and gradually to the south. In the south, the subducting Yakutat plate is thicker (similar to 100-120 km) than the subducting Pacific plate (similar to 80-90 km), likely due to its thicker crust. (C) 2021 Elsevier B.V. All rights reserved.
 James B. Gaherty合作论文数Lamont-Doherty Earth Observatory;Columbia University;Lamont-Doherty Earth Observatory, Columbia University20
 Geoffrey Abers合作论文数Department of Earth and Atmospheric Sciences, Cornell University;Lamont-Doherty Earth Observatory, Columbia University14
 Joshua B Russell合作论文数Dept Earth Environm & Planetary Sci, Brown Univ9
 Colleen A Dalton合作论文数Department of Earth, Environmental and Planetary Sciences, Brown University9Ge Jin (金戈)合作论文数7Brennan R. Brunsvik合作论文数Dept Earth Sci, Univ Calif Santa Barbara7
 Hannah E. Krueger合作论文数Dept Earth Environm & Planetary Sci, Brown Univ6
 Lynner Colton合作论文数6
 Donald W Forsyth合作论文数Department of Earth, Environmental, and Planetary Sciences, Brown University6I. Gama合作论文数5
 Stephen Mosher合作论文数Department of Earth and Environmental Sciences, University of Ottawa;stephenmosher@protonmail.com;Department of Earth and Environmental Sciences, University of Ottawa5
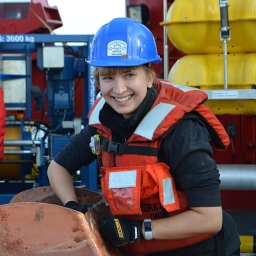 Helen A. Janiszewski合作论文数Dept Earth Sci, Univ Hawaii Manoa5
 Juliane Dannberg合作论文数Helmholtz Centre Potsdam, GFZ German Research Centre for Geosciences4
 Karen M. Fischer合作论文数Department of Earth, Environmental and Planetary Sciences, Brown University4
 René Gassmöller合作论文数Institute for Geosciences, Friedrich Schiller University4Lucy M. Flesch合作论文数Dept Earth Atmospher & Planetary Sci, Purdue Univ4
 Young-Hee Kim合作论文数School of Humanities and Social Sciences, College of Liberal Arts and Convergence Science, Korea Advanced Institute of Science and Technology3d h christensen合作论文数2Roque A. Soto Castaneda合作论文数2Lun Zhang合作论文数2
 Isabella Gama合作论文数Department of Earth Environmental and Planetary Sciences, Brown University2
 Sloan Coats合作论文数Univ Hawaii Manoa, Dept Earth Sci, Honolulu, HI 96822 USA2
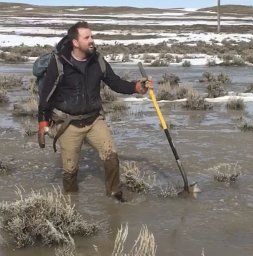 Joseph Stephen Byrnes合作论文数Sch Earth & Sustainabil, No Arizona Univ2Obrebski Mathias合作论文数2
 Roger Buck合作论文数Lamont-Doherty Earth Observatory, Columbia University in New York City2
 Toshiro Tanimoto合作论文数Department of Earth Science, College of Letters and Science, University of California, Santa Barbara2
 Anne Becel合作论文数UMR 7154, Institut de Physique du Globe de Paris2Robert Myhill合作论文数2Pascal Audet合作论文数2W B Hawley合作论文数1J. Petruska合作论文数1
 Eva M. Golos合作论文数Department of Geoscience, University of Wisconsin - Madison1
 Caitlin Dieck Locke合作论文数Lamont‐Doherty Earth Observatory, Columbia University1
 Junlin Hua (花君临)合作论文数School of Earth and Space Sciences, University of Science and Technology of China1
 Pritwiraj Moulik合作论文数1
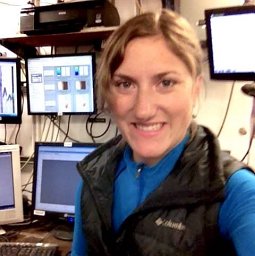 Kasey Aderhold合作论文数Inc Res Inst Seismol1
 Robert W. Porritt合作论文数Sandia National Laboratories1
 Brandon Shuck合作论文数Dept Geol Sci, Univ Texas Austin1
 Haiying Gao合作论文数Univ Massachusetts, Dept Geosci, Amherst, MA 01003 USA1GuoDong Jin (靳国栋)合作论文数1
 Maureen Long合作论文数Department of Earth & Planetary Sciences, Yale University1
 Göran Ekström合作论文数Department of Earth and Environmental Sciences, Columbia University;Lamont-Doherty Earth Observatory, Columbia University1
 William Menke合作论文数Lamont-Doherty Earth Observatory, The Earth Institute, Columbia University1
 George Zandt合作论文数Department of Geosciences, College of Science, The University of Arizona1
 Chen Ji合作论文数1
 Harm Van Avendonk合作论文数Institute for Geophysics, Jackson School of Geosciences, The University of Texas at Austin1
 Donna J. Shillington合作论文数National Oceanography Centre, Southampton, UK1
 Goran Ekstrom合作论文数Department of Earth and Environmental Sciences, Columbia University1




