Rapid urbanization and intensified urban heat island effects have increased the need for effective, equitable cooling strategies. Urban green spaces (UGS), as nature-based solutions, provide critical cooling benefits that support thermal comfort and enhance urban resilience. However, disparities in cooling needs and access persist across gender and age, with vulnerable populations often facing unequal access to UGS resources. Despite growing attention to UGS equity, methods for quantifying demographic-specific mismatches between cooling supply and population demand remain underdeveloped. To address this gap, we developed a supply-demand evaluation framework to examine spatial equity and age- and gender-related environmental injustices in UGS cooling benefits in Fuzhou, China. The results show: 1) UGS cooling benefits supply and demand exhibit broadly similar spatial patterns across demographic groups but divergent patterns between the urban center and periphery. 2) Fuzhou's main urban area faces pronounced supply-demand mismatches, with elderly and female populations more affected by uneven resource distribution. 3) Significant disparities (p < 0.001) exist across age and gender groups, with children and middle-aged adults experiencing greater mismatches, while men face more severe supply deficits. Although UGS spatially favors vulnerable groups, substantial inequities in cooling access remain. Notably, targeted planning and management strategies were proposed for urban and green space systems, tailored to different population groups and types of supply-demand mismatch. This study highlights the urgent need for age- and gender-responsive UGS planning and offers a transferable approach to reduce cooling inequalities, supporting more equitable and climate-resilient urban environments.
Guided by the carbon peaking and carbon neutrality goals, clarifying the transmission mechanisms of carbon sequestration service flow (CSSF) in river basins is crucial for promoting sustainable development. To enhance the coordination between carbon sequestration service supply and demand in the Minjiang River Basin, this study quantified the current supply and demand status and proposed a comprehensive evaluation framework for carbon sequestration service flow. The framework incorporated the breakpoint formula, field strength model, and topographic distribution index to explore the spatial transmission characteristics of carbon sequestration service in both horizontal and vertical dimensions, ultimately proposing differentiated strategies for optimizing carbon sequestration service flow. The results are as follows: ① The supply of carbon sequestration service in the Minjiang River Basin exhibits a spatial distribution pattern of "low along the riverbanks and high in the mountainous areas," while the demand shows a pattern of "high in coastal regions and low in inland areas." ② Overall, the basin is in a state of surplus supply, whereas urban development areas show a deficit. Notably, 45.4% of the regions in the basin show a mismatch between supply and demand, with areas of deficit exhibiting spatial aggregation. ③ Among the input areas in the Minjiang River Basin, 72.7% can receive effective carbon sequestration service supply from other counties, whereas Jinan District, Mawei District, and Changle District in the southeast are unaffected by carbon sequestration service flow. ④ From the high-terrain mountainous area to the low-terrain flat area, the V-level potential CSSF gradually loses its dominant position, with 86.5% of the CSSF in the Minjiang River Basin provided from higher-grade topographic counties to lower-grade topographic counties. The research findings provide scientific references for ecological protection, restoration, and compensation mechanisms in the Minjiang River Basin.
Amidst the intensifying global climate change, coastal cities face multiple marine disaster threats due to sea level rise and frequent extreme weather events. Storm surge-induced flood disasters and their secondary effects (e.g., urban waterlogging) pose systemic risks to the lives of the residents, properties, and coastal system infrastructure. Compared with traditional disaster prevention models, the synergistic mechanism between resilience theory and community risk management not only provides a theoretical framework for urban complex risk prevention, but also demonstrates dynamic adaptive advantages in pre-disaster prevention, disaster response, and post-disaster recovery. Accordingly, this study integrated the resilience community theory with the sponge city concept, selecting 25 storm surge-prone bay communities in the Xiamen Wuyuan Bay Area as samples to establish a community resilience evaluation framework encompassing exposure, vulnerability, adaptability, and spatial connectivity. By integrating 16 subjective and objective indicators, including the rescue facility coverage rate and residents' disaster preparedness literacy, we employed the AHP-CRITIC combined weighting method to determine indicator weights and quantify community resilience levels using TOPSIS analysis. The key findings are categorized as follows: (1) an overview of the marine disaster context, the theoretical evolution of resilient communities, and existing research gaps. The literature review indicated that marine disaster threats to coastal urban safety showed significant upward trends, where communities, as direct disaster-bearing entities, needed urgent refined resilience assessments considering their spatial heterogeneity and component vulnerability. International practice comparisons revealed three critical deficiencies in China's resilient community development: overreliance on infrastructure hardware while neglecting the landscape spatial resilience layout, insufficient innovation in social organizational resilience and collaborative mechanisms, and superficial resident participation lacking substantive interactive mechanisms. (2) Development of multidimensional resilience evaluation system Through meta-analysis and expert consultation, we established a dual-dimensional ("vulnerability-adaptability") evaluation system comprising 7 primary and 16 secondary indicators. The AHP-CRITIC combined weighting results indicated that hazard level (0.221), disaster prevention capacity (0.169), and emergency response capacity (0.168) constituted the highest-weighted primary indicators. Secondary indicators, including coastal length, shoreline protection intensity, and volunteer rescue station accessibility, demonstrated significant spatial exposure and emergency response weights, suggesting for their prioritization in coastal community retrofitting. (3) Implementation of a resilience assessment system for coastal community in Wuyuan Bay Field surveys and questionnaire data enabled quantitative resilience analysis of 25 communities. TOPSIS results revealed geographical location and residents' disaster preparedness as core drivers of resilience differentiation. Inner bay communities (e.g., D25) achieved maximum resilience (0.872) through wetland regulation, natural terrain barriers, and emergency facility clusters, whereas outer bay communities (e.g., D1) showed minimal resilience (0.312), owing to high-risk exposure and medical resource scarcity. Wetland ecosystems notably reduced drainage system loads through hydrological regulation and flood detention mechanisms. (4) Optimization strategies for coastal community resilience. This study systematically identified the core elements for developing community resilience during flood-related disasters through the establishment of a coastal community resilience assessment system and empirical research. Through a comparative analysis of typical domestic and international scenarios, we proposed an actionable resilience enhancement strategy system. For public space optimization, dual-purpose strategies for both normal and emergency conditions were emphasized for road networks and green systems, integrating traffic management with ecological protection. For ecological water system development, the water conservation mechanisms of coastal wetland ecological barriers were systematically elucidated, and a synergistic optimization pathway for wetland protection and community water systems based on nature-based solutions was proposed. Regarding emergency shelter spatial planning, an innovative comprehensive evaluation framework was established, incorporating location accessibility, per capita shelter area thresholds, disaster prevention facility standards, and emergency transportation systems. For social governance, resident participation mechanisms and smart management platforms were suggested to amplify community resilience through flexible interaction and resource integration.
Climate change has intensified urban heat risks through extreme heat and heat island effects. Using Fuzhou as a case study, we conducted assessments of heat risk and cool island quality to identify core heat risk sources (CHRSs) and core cold sources (CCSs). Based on the degree of resistance to surface heat transfer, we constructed a comprehensive resistance surface. This was followed by the construction of a composite cooling network using the minimal cumulative resistance and circuit theory models, along with the identification of key nodes to enhance the protection of cool island resources and ensure network stability. Our findings revealed that the central urban area had the highest heat risk, followed by the eastern coastal areas, showing a trend of further expansion towards the southeastern coast. Relatively high-quality cool island resources were distributed in the western mountainous area. We identified 21 CHRSs and 32 CCSs. The composite cooling network included 94 heat transport corridors and 96 cool island synergy corridors, with 148 cooling nodes and 78 barrier nodes. The average land surface temperature of transport and synergy corridors was 27.89°C and 25.34°C, respectively, significantly lower than the high-risk areas (31.14°C). Transport corridors enable heat transfer from CHRSs to CCSs, while synergy corridors can achieve further cooling by enhancing the synergy among cool islands.
The health of city inhabitants is considerably impacted by the urban park green spaces (UPGS). Existing studies lack an assessment of the UPGS equity from different perspectives and are limited to poor accuracy. This study reviews the definition and determination methods of UPGS, as well as UPGS accessibility and spatial equity related studies. Then, a spatial equity evaluation system is established from the dimensions of equity in providing UPGS services and equity in supply and demand matching. This study extrapolates from micro to macro analysis using network big data and census data to pinpoint the population down to the building level in the main urban area of Fuzhou City, China. The network analysis method, improved Gaussian floating catchment area method, Gini coefficient, and Lorenz curve measurement help to evaluate UPGS service euquity, explore the similarities and differences of UPGS fairness under different travel modes. It also helps to understand the service relationship between UPGS service and population demand under objective space, and to pinpoint the weak supply area using the locational entropy method. The results show that: (1) The overall accessibility and per capita accessibility show similar spatial distribution patterns under different travel modes, which are "high around and low in the middle" and "centered on the Minjiang River and dispersed to the north and south, respectively" in study area. (2) The supply of UPGS services in Fuzhou is relatively adequate and at a relatively equity level, while varies in the allocation of UPGS services among sub-districts. The spatial equity of different traveling modes varies widely. (3) The sub-districts on the periphery of the study area should be subject to increased UPGS and improvements to the road network and public infrastructure. Sub-district with high population density and old neighborhoods should implement micro-renewal and build community parks. Our study presents a new idea for spatial equity research.
The process of urbanization leads to the rapid expansion of construction land and brings a series of ecological and environmental problems. The ecological network, as a linear landscape element, is of great significance to improve the quality of the regional ecological environment. In this study, the Morphological Spatial Pattern Analysis (MSPA) and the model of Minimum Cumulative Resistance (MCR) were used to construct the ecological corridors in the central city of Fuzhou, and the land use pattern under the constraints of the ecological network was simulated and quantified by the patch-level land use simulation (PLUS) tool with the results of the identification of ecological corridors. Meanwhile, with the help of InVEST habitat quality model, the regional habitat quality under different development scenarios was compared. The results show that (1) 19 ecological sources and 35 ecological corridors were identified; (2) under the constraints of ecological corridors, the area of forested land in the study area in 2027 was increased by 1.57% and the area of built-up land was reduced by 0.55% compared with that in 2022; (3) and under the constraints of ecological corridors, the mean value of habitat quality in Fuzhou City improved by 0.0055 and 0.0254 compared with 2022 and 2027 natural evolution scenarios, respectively. The study provides decision-making assistance for the construction of ecological corridors from the perspective of land use planning.
城市公园绿地空间在提供生态效益和社会效益方面发挥着重要作用.城市化进程的迅速推进,导致社会阶层分化现象日益加剧,社会群体无法公平享有公共绿地资源,尤其是老年人群体.以北京市主城区133个街道的340个公园绿地为研究对象,改进公园绿地供给模型,基于供需关系等评价城市公园绿地供给公平性,提出公园绿地优化布局方案.结果表明:(1)改进后的公园绿地供给模型充分考虑了不同公园类型及公园质量.(2)研究区域内46.6%的公园绿地总供给无法满足老年群体需求,区域主要聚集在北京市二环至五环;相比游园、区域公园和市域公园,老年群体享有社区公园绿地供给的机会更多.(3)老年人享有的公园绿地供给未能达到社会正义的底线要求.在海淀街道、上地街道、大屯街道等区域新增公园绿地,提升望京公园、地坛公园等的公园质量是促进绿地公平性的有效手段.研究结果可为优化城市公园绿地空间的决策提供支持,为城市精细化管理提供参考.
In order to explore which ecological strategies the remnant vegetation is taken to adapt to urbanization, we investigated three kinds of typical remnant vegetation (grassland, plantation, and secondary forest) in 16 sample sites along the urban–rural gradient in the city of Guangzhou. In this study, we examined plant species composition, and plant diversity, and analyzed the seed of the dominant tree species Schima superba (S. superba) in the secondary forest sites. Those indicators are strongly related with ecological strategies. Eighteen landscape pattern characteristics were determined to reveal the extent of landscape fragmentation. Geographic Information System (GIS), linear regression, and Canonical Correspondence Analysis (CCA) were conducted to analyze the influence of landscape pattern characteristics on plant communities. Results showed that (1) Fragmentation of landscape patterns caused by urbanization has a negative impact on the diversity of herb-layer plants, the dominant species of grassland in the city center are mainly weeds, such as Bidens pilosa and Neyraudia reynaudiana. (2) In order to adapt to the pressure of landscape fragmentation, seeds of S. superba have developed into a larger size, with a competitive advantage over smaller ones. (3) Two different ecological strategies of plant communities adapting to urbanization: The pioneer weeds in grasslands, with high reproductive and dispersal ability, have adopted a r-selection strategy and the dominant tree species with higher survival rates, larger individuals, and longer life spans, have adopted a K-selection strategy to resist disturbance, as well as with a larger seed size to increase viability and settlement ability.
揭示生境质量的时空演变特征和影响因素可为区域可持续发展提供参考依据.基于 2000 年、2010 年和 2020 年的土地利用数据,运用InVEST模型、土地利用转移矩阵和参数最优地理探测器等方法,综合分析福州市生境质量时空演变及其驱动因素.结果表明:福州市 2000 年、2010 年和 2020 年生境质量指数分别为 0.812、0.806 和 0.793,生境质量改善的面积小于生境质量退化的面积,福州主城区和东南沿海区域的生境状况亟须改善.3 km网格为本研究的最佳空间尺度,最佳数据离散化分类数为 6,自然间断点法更能解释驱动因素的驱动程度.高程、坡度和夜间灯光是福州市生境质量空间分异的主要影响因素,坡度和夜间灯光的交互作用对生境质量变化的解释力最强.
The spatial distribution of urban green spaces (UGS) is closely related to the health of residents and the ecological pattern of cities. Exploring the equity of UGSs plays an important role in urban planning and also provides guidance for urban development. Taking the main urban area of Fuzhou City as an example, this study uses network big data and census data to pinpoint the population demand, evaluates the accessibility and equity of UGS within the basic living circle, neighborhood living circle and daily living circle of residents at the scale of residential and sub-districts. Based on the G2SFCA model, we also quantify the actual effective UGS’s service capacity. Then, using the scale and travel range as the entry point, we further discuss the similarities and differences under different scales and different travel ranges. Finally, optimization strategies are proposed for the construction status. The results show that: (1) The spatial allocation of urban green space resources varies significantly, and there is a serious inequity in the spatial distribution of urban green space under pedestrian conditions; (2) The results of UGS accessibility, equity, and service capacity in Fuzhou at both residential and sub-district scales are consistent; (3) Urban construction should be multi-level overall planning, combined with local economic and social development factors in accordance with local conditions to take measures. The results of the study can provide a scientific reference for the optimization of the spatial distribution of UGS.
叶片气孔不仅是植物平衡光合-蒸腾关系的重要门户,也是影响大气碳循环与水循环的关键结构。分析热岛效应下福州市乔木、灌木、草本3种生活型和常绿、落叶2种叶习性植物的气孔性状间的差异及其与其他叶功能性状间的权衡关系有助于探究不同类型植物在热环境下的适应策略。以福州市区的自然和半自然植被为研究对象,测定441个植物样本的气孔特征、化学计量特征和形态特征,结果表明:(1)3种生活型、2种叶习性植物的气孔长度(SL)、气孔密度(SD)差异显著(P<0.05),潜在气孔导度指数(PCI)不存在显著差异(P>0.05)。草本的SL高于灌木和乔木,乔木的SD最高,灌木次之,草本最低;落叶植物的SL高于常绿植物,SD低于常绿植物。(2)SL与SD间的权衡关系稳定存在于3种生活型和2种叶习性植物中,且随着不同生活型和落叶习性植物的生态策略而呈现各异的权衡特征,即当SL一定时,乔木的SD最大,灌木的SD最小,常绿植物的SD大于落叶植物。(3)气孔性状和叶片形态、化学计量特征紧密联系,SL与比叶面积(SLA)正相关(P<0.01),与叶面积(LA)负相关(P<0.01);SD与叶氮含量(LNC)、叶磷含量(LPC)、SLA负相关(P<0.01),与LA正相关(P<0.01);PCI与LNC、SLA负相关(P<0.01),与叶厚度(LT)正相关(P<0.05)。(4)复杂的环境是气孔性状变异的重要驱动因素,SL、PCI均与年均温(MAT)负相关(P<0.05)。
Urban park green space (UPGS) plays an important role in providing ecological and social benefits. However, in many large cities with rapid economic development, the supply of UPGS is unfairly distributed, and there is a severe mismatch between its supply and residents' demand. Taking the Beijing central city as an example, this study aims to develop a fairness assessment model to quantify the fairness of UPGS distribution and the matching relationships between supply and demand for UPGS. To achieve the aims of the study, we improved the supply model of UPGS by integrating three factors: the number of UPGS, the service capacity of UPGS, and the quality of UPGS in the Beijing central city. Subsequently, we evaluated the spatial fairness and social fairness of the supply of UPGS using the Gini coefficient. Then, we used the number of residents in the sub-district to characterize the intensity of residents' needs and quantitatively analyzed the spatial matching relationship between the supply of UPGS and residents' demand. The results show that: (a) The improved supply model of UPGS can measure the supply of UPGS of different types in a more detailed way. (b) The per capita supply of UPGS is unevenly distributed among the six urban districts of Beijing, which may lead to a sense of unfairness among residents. While residents in Haidian District (Gini = 0.649) may have the highest sense of unfairness, followed by those in Fengtai (Gini = 0.505), Dongcheng (Gini = 0.410), Xicheng (Gini = 0.392), and Chaoyang District (Gini = 0.225). (c) The matching relationship between the supply of UPGS and the needs of different social groups is not ideal, especially the spatial matching relationship between the needs of the elderly and the supply of UPGS. This study can be used as a reference for supporting decision making in optimizing UPGS and providing a reference for fine urban management.
Rapid urbanization has gradually increased the contradiction between the demand and supply of urban resources. The quantitative optimization and adjustment of the infrastructure of the 15-min living circle is conducive to the scientific formulation of living circle planning guidelines, and also allows the evaluation of the effectiveness and practicality of policies. We investigate the spatial allocation pattern of infrastructure construction, the actual service capacity of facilities, and the spatial matching of facility service supply and residents' demand from the spatial dimension. Taking Fuzhou City as an example, this study uses multi-source network big data to accurately quantify the supply and demand, and constructs a 15-min living circle facility service supply evaluation system based on the kernel density analysis method, the network analysis method, and the supply and demand matching model. We propose infrastructure enhancement strategies in conjunction with the current status of Fuzhou's urban development. This study also further explores the factors influencing the spatial distribution of basic service facilities and the construction status of community living circles in China. The results show that (a) The distribution of infrastructure presents a different spatial distribution pattern from the actual service supply within the living circle. (b) The infrastructure service in the main area of Fuzhou can basically cope with the demand of residents, but there is still a mismatch between supply and demand. The areas with insufficient supply are mainly distributed in the periphery of the study area. (c) In order to further improve the construction of community living circle, we should first focus on the sub-districts with low service supply level and insufficient supply. According to the specific distribution of facilities, the number of public service facilities should be increased or decreased based on the demand of residents. This paper enriches the practical application of multi-source network big data in urban infrastructure construction, provides a guideline for the spatial layout and resource allocation of infrastructure in 15-min living circles in other cities.
Minjiang River Basin is a pilot project area in Fujian Province for ecological protection and restoration of mountain-river-forest-farmland-lake-grass, with outstanding ecological service capacity. Based on the landuse data, climate data and socio-economic data of Minjiang River Basin from 1990 to 2015, this study explored the spatial and temporal characteristics of land use and its drivers in Minjiang River Basin by using spatial analysis and principal component analysis.The results showed that(1) from 1990 to 2015, based on the analysis of land use change types, the area of low-coverage grassland decreased significantly, while the area of urban land, other construction land, forested land, and other forested land increased significantly. From 1990 to 2015, based on the spatial pattern of land use change, the decrease of grassland mainly occurred in the north-central, east-central, and west-central parts of the Minjiang River Basin, and the direction of change was mainly interchangeable with forested land; the small decrease of cultivated land was mainly distributed in the north-central part of the basin.(2) From 1990 to 2015, the land use changes were most obvious in the middle reaches of the Minjiang River basin, followed by the lower reaches, and least in the upper reaches, analyzed by the drastic degree of land use changes.(3) In terms of the time analysis of land use change, 1990-1995 was the most obvious period of land use change in the Minjiang River basin. Rapid socio-economic development, accelerated urbanization, and rising consumption levels of residents were the main drivers of land use change in the region. This article aims to provide a basis for further research on the sustainable use of land resources and the construction of ecological security patterns in the Minjiang River basin, and to provide a reference for the formulation and implementation of land resources management, ecological protection and high-quality development planning in the Minjiang River basin.
The Tingjiang Watershed is a typical mountainous area with red soil in the south of China. Due to the high rainfall intensity, significant cultivated land expansion, and accelerated urbanization, ecological problems such as soil erosion are prominent in the study area. Based on the land use, precipitation, digital elevation model (DEM), normalized difference vegetation Index (NDVI), and soil types in 2000, 2010, and 2020, the landscape pattern and soil conservation in the Tingjiang Watershed were assessed at the sub-watershed scale. The spatial correlation between soil conservation and landscape pattern was analyzed using GeoDA software. The results show the following: (1) From 2000 to 2020, the total amount of soil conservation decreased by 4.15 × 10⁸ t. In terms of spatial analysis, the amount of soil conservation in the Tingjiang Watershed showed an upward and then downward trend in the north and a downward trend in the south, with the most obvious downward trend in the southeast and the northeast. (2) Fragmentation of the overall landscape pattern in the Tingjiang Watershed has increased. The discrete degree and homogeneity of patches decreased in Changting County, while landscape heterogeneity and homogeneity increased in Shanghang, Liancheng, and Yongding Counties. (3) Soil conservation was significantly correlated with the landscape indices patch density (PD), landscape shape index (LSI), mean patch area (AREA_MN), patch cohesion index (COHESION), splitting index (SPLIT), and Shannon evenness index (SHEI). Sub-watersheds with low soil conservation had landscape splitting index, landscape dispersion, patch type richness, and boundary complexity. These areas were mainly distributed in the southern part of the watershed. Sub-watersheds with higher soil conservation were characterized by low patch fragmentation and strong connectivity of dominant patches, which were mainly located in the northern part of the watershed. (4) The spatial error model (SEM) fit better in 2000, 2010, and 2020 compared with the spatial lag model (SLM) and ordinary least squares regression (OLS). The diagnostic results of the SEM model show that among the six landscape indices, PD, SHEI, and AREA_MN are the main influencing factors affecting soil conservation in the watershed to different degrees. The purpose of this study was to investigate the response state of soil conservation capacity as landscape patterns evolve in the Tingjiang Watershed, with the goal of providing a reference for landscape planning and management as well as soil erosion management in the watershed.
由耕地、林地、草地、湿地及水域共同构成的绿色空间有利于提升城市生态环境,维护生物多样性和社会经济的可持续发展,理清福建省绿色空间的景观结构组成以及空间配置演变情况对构建生态屏障、打造全国生态示范省具有重要意义.以福建省绿色空间为对象,分析其景观格局在2000-2020年的演变,并采用地理加权回归(geographically weighted regression,GWR)构建回归模型,分析福建省绿色空间景观格局演变的影响因素及其空间差异性.结果表明:1)2000-2020年,整体绿色空间景观格局的时空变化特征较明显.福建省整体绿色空间破碎化程度上升,总体连通性降低和多样性降低.空间分布上,整体绿色格局破碎化、连通性和多样性变化随着空间位置不同而变化.2)GWR模型在空间位置层面对不同时期的绿色空间格局演变影响因素的解释优于普通最小二乘法(ordinary least squares,OLS)模型.GWR模型结果表明,社会经济影响因素对绿色空间景观格局破碎化、连通性、多样性的影响以负相关为主,且具有较显著的空间差异.自然因素中,地形、温度、降水对绿色空间景观格局的影响也具空间差异.分析揭示了福建省绿色空间景观格局的时空演变特征,并在空间层面上量化影响因素对绿色空间景观格局的影响特征,有助于进一步优化福建省绿色空间格局并构建福建省生态安全格局.
景观格局时空演变是土地利用变化最直观的表现形式,剖析流域景观格局变化及其驱动力,对流域土地利用的管理与调控具有重要意义.利用土地利用转移矩阵、移动窗口法分析了汀江流域2000—2020年景观格局的时空变化特征,并利用地理探测器探究其演变的驱动机制.结果表明:1)2000—2020年,汀江流域内的自然景观不断转向人造景观,具体表现为人造地表(+120.95 km2)、耕地(+59.87 km2)、水体(+31.04 km2)大幅转入,草地(-135.83 km2)、林地(-66.8 km2)、灌木地(-8.8 km2)、湿地(-0.05 km2)大幅转出.2)从类型水平上看,流域景观离散程度不断增大,斑块边缘规则化;从景观水平上看,整体破碎度、割裂度加剧.林地景观具有很强的优势性,以其为代表的自然景观斑块呈现破碎状态,且斑块的割裂程度大,离散程度高;以人造地表为代表的人造景观斑块呈现片状分布,边界规则化,且斑块面积呈现增大趋势.3)人口密度(X6)、年降水量(X7)、年平均温度(X8)是驱动研究区域景观格局变化的主要驱动力.研究结果可为探究流域景观格局变化的趋势和影响机制提供思路,对汀江流域的生态环境治理、生态系统保护和土地利用规划制定具有重要借鉴意义.
城市的肆意蔓延以及不断建造更新的灰色基础设施使城市景观格局呈现破碎化的状态.以新乡市为研究区,基于景观生态学和形态学空间格局分析(MSPA)来识别生态廊道,以ArcGIS为技术支撑,采用最小累积阻力模型(MCR)提取新乡市生态源地间潜在的生态廊道,结合重力模型对生态网络内斑块重要性进行分级,构建新乡市的生态网络空间,结合新乡市的发展需求,提出优化方案.结果表明:新乡市的生态源地总体规模较大,面积84819.06 hm2,占研究区景观要素面积的90.11%,分布不均匀,主要集中在北部以及南部,中部很少,且源地较为破碎化.构建出新乡市的潜在生态廊道共130条,重要廊道16条,一般廊道114条,需要增加生态源地以提高生境斑块间的连通性.新乡市的重要生态廊道主要是由北部生态源地向南扩散,增加了南北间景观的连通性,在进行规划时要重点保护此廊道及周边生态,保护研究区的生态环境.
In highly fragmented urban areas, plant diversity of remnant vegetation may depend not only on community structure and topographical factors, but also on landscape heterogeneity. Different buffer radius settings can affect the relative importance of these factors to plant diversity. The aim of this study was to examine the relative importance of landscape heterogeneity, community structure, and topographical factors on plant diversity under different buffer radii in biodiversity hotspots. We established 48 plots of remnant vegetation in Guangzhou city, one of the biodiversity hotspots. A buffer radius of 500 m, 1000 m, and 2000 m was established around the center of each sample plot, and 17 landscape heterogeneity indices in each buffer were calculated by FRAGSTATS 4.2 software. Combined with the community structure and topographical factors, the impact factors of plant diversity under different buffer radii were analyzed by multiple regression analysis. We found the following: (1) The combined explanatory power of the three factors accounted for 43% of the species diversity indices and 62% of the richness index at its peak. The three impact factors rarely act independently and usually create comprehensive cumulative effects. (2) Scale does matter in urban landscape studies. At a 500 m buffer radius, community structure combined with road disturbance indices was strongly related to diversity indices in herb and shrub layers. The stand age was negatively correlated with the tree-layer richness index. As the scale increased, the diversity indices and richness index in the three layers decreased or increased under the influence of comprehensive factors. (3) The richness index in the herb layer was more responsive to impact factors than other biodiversity indices. Except for the herb layer, the interpretation of landscape heterogeneity for each plant diversity index was more stable than that for the other two factors. Road disturbance indices, combined with the other six landscape pattern metrics, can well indicate species diversity and richness. We suggest that the vegetation area of remnant patches within a radius of 500–2000 m should be appropriately increased to protect plant diversity, and the negative effects of road disturbance should also be considered.
Urban expansion has resulted in the fragmentation of green spaces. Based on the concept of a living community that integrates mountains, rivers, forests, farmlands, lakes, and grasslands, the extraction of key elements in green spaces of regional ecosystems provides core scientific support for the ecological restoration of territorial spaces. According to the ecological service function importance and ecological sensitivity, the ecological sources were identified in this study. Furthermore, we distinguished the ecological corridors using the minimum cumulative resistance (MCR) model and identified the key areas of green spaces using the circuit theory model. The result showed that (1) 62 ecological sources were present with a total area of 4696 km(2), of which green space accounted for 98.19%; meanwhile, 151 ecological corridors (optimal path) were densely distributed in the southwest region around the Daimao and Bopingling mountains. (2) The key areas of ecological restoration in the study area included 17 key ecological sources and 19 key ecological corridors. The area covered by ecological pinch points was 1327 km(2), among which 77.54% of green space comprised forest area. The area of ecological barriers was 9647 km(2), and the forest area still accounted for the highest proportion (63.92%). (3) Based on a comprehensive analysis of the spatial distribution of key areas of ecological restoration and green spaces, we formulated classified ecological restoration measures. The study findings are expected to provide a reference for planning the ecological restoration of territorial spaces.
 LiuJing Huang (黄柳菁)合作论文数18Xinke Wang合作论文数14WANG zhenfeng (王圳峰)合作论文数11ZengKe Zhang (张增可)合作论文数10
 Xie Huili合作论文数9Xiangqun Xie合作论文数9Hong Lin合作论文数8LI qian (李倩)合作论文数7LIN Sainan (林赛男)合作论文数5xinxin lian (连欣欣)合作论文数5Yahua WU (吴雅华)合作论文数5LIU Yan (刘燕)合作论文数5YanTing Xu (许燕婷)合作论文数5YanHai Zhou (周沿海)合作论文数5yuexin chen (陈玥忻)合作论文数4Xiaoting Hu合作论文数4Zhiyong Shi (施智勇)合作论文数4ManHong Xiao (萧满红)合作论文数4
 Weifeng Zheng (郑玮锋)合作论文数福建农林大学艺术学院园林学院(合署)4YANG Gui-mei (杨桂梅)合作论文数3Yanhui Chen (陈燕惠)合作论文数3LongBo Jiang (蒋龙波)合作论文数3
 Qi Wang合作论文数3LI Jia-xin (李佳芯)合作论文数2Qijian Lin (林其健)合作论文数2Ying Lin (林颖)合作论文数2Linlin Zhang (张琳琳)合作论文数2Qingmin Que合作论文数2Min HUANG (黄旻)合作论文数2JiaLing Zhang (张嘉灵)合作论文数2
 Jianwen Dong (董建文)合作论文数福建农林大学艺术学院园林学院2
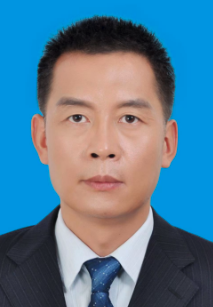 Rongbo Xiao (肖荣波)合作论文数School of Geography & Environmental Economics, Guangdong University of Finance and Economics2
 Qingyan Meng (孟庆岩)合作论文数Institute of Remote Sensing and Digital Earth, Chinese Academy of Sciences2
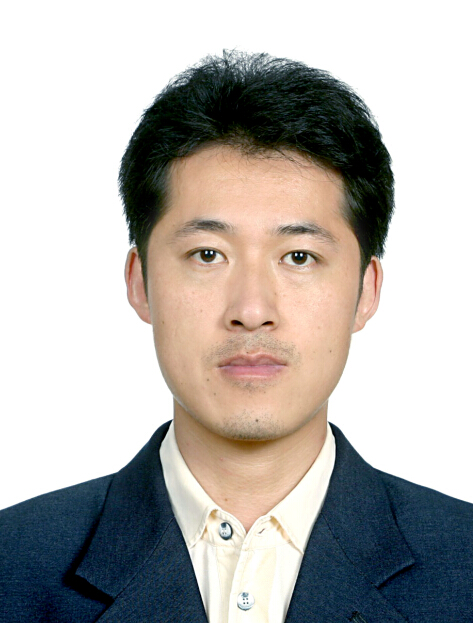 Xinli Hu (胡新礼)合作论文数Institute of Remote Sensing and Digital Earth, Chinese Academy of Sciences2
 Chuanyuan Deng (邓传远)合作论文数福建农林大学艺术学院园林学院2
 Yaxin Bi合作论文数School of Computing and Mathematics, Ulster University;Computer Science Research Institute, Ulster University2
 Tamas Jancso合作论文数Faculty of Geoinformatics, University of West Hungary2Sheng-lan LI (李圣岚)合作论文数1
 Meizi You合作论文数1CHEN Rong-rong (陈榕榕)合作论文数1WANG Wei-yao (王伟耀)合作论文数1GUAN Shi-min (管诗敏)合作论文数1WENG Feifan (翁飞帆)合作论文数1Jiao Zhang合作论文数1LI Xufang (李旭芳)合作论文数1yanling huang (黄燕玲)合作论文数1
 Geng Jianwei合作论文数1Yirong Deng合作论文数1




