Increasing atmospheric CO2 seasonal cycle amplitudes in boreal regions have been attributed to climate-driven changes in land ecosystems, but terrestrial biosphere models (TBMs) are unable to replicate observations, leading to large uncertainties in future predictions of carbon cycle changes. Accurately partitioning net ecosystem exchange into its component fluxes-gross primary production (GPP) and respiration-is essential for understanding impacts of changing climate on the Arctic and boreal carbon balance, yet these component fluxes cannot be measured directly. Carbonyl sulfide (OCS) has been used to infer GPP at site to global scales, because its one-way uptake by plants is an analog for photosynthesis. However, expanding site-level process understanding to regional scales remains challenging. Here, we use atmospheric OCS mole fraction observations representative of Alaskan boreal forests to evaluate simulations of OCS fluxes in a state-of-the-science TBM. We use TBM-estimated OCS fluxes and surface influence functions on the order of 100-1000 km to simulate OCS mole fractions at the NOAA Global Monitoring Laboratory's CRV tower site in central Alaska. By comparing with atmospheric observations, we can evaluate the TBM over much larger scales than is possible using eddy covariance data while still providing valuable information about underlying mechanisms. Comparisons reveal a missing ecosystem sink corresponding to a concentration difference of 22.3 +/- 9.1 ppt OCS for July-November relative to observed concentrations of 433 +/- 26 ppt at CRV. Solely improving the temperature sensitivity of apparent mesophyll conductance reduces the July-November mismatch between modeled and observed OCS concentration data by similar to 5.3 +/- 2.7 ppt. Consideration of alternate land cover maps provides an additional similar to 5.3 +/- 3.0 ppt towards the mismatch. These results demonstrate a strong decoupling of OCS and GPP, especially after the end of the growing season. Our analyzes demonstrate the limitations of using OCS as a proxy for GPP and highlight potential missing processes that need to be incorporated into future OCS modeling efforts to maximize its potential as a photosynthetic tracer.
Over the past three decades, assessments of the contemporary global carbon budget consistently report a strong net land carbon sink. Here, we review evidence supporting this paradigm and quantify the differences in global and Northern Hemisphere estimates of the net land sink derived from atmospheric inversion and satellite-derived vegetation biomass time series. Our analysis, combined with additional synthesis, supports a hypothesis that the net land sink is substantially weaker than commonly reported. At a global scale, our estimate of the net land carbon sink is 0.8 ± 0.7 petagrams of carbon per year from 2000 through 2019, nearly a factor of two lower than the Global Carbon Project estimate. With concurrent adjustments to ocean (+8%) and fossil fuel (-6%) fluxes, we develop a budget that partially reconciles key constraints provided by vegetation carbon, the north-south CO2 gradient, and O2 trends. We further outline potential modifications to models to improve agreement with a weaker land sink and describe several approaches for testing the hypothesis.
Abstract Representing subgrid variabilities of land surface processes and their upscaled effects is crucial for global climate modeling. Here, we implement a multiple atmosphere multiple land (MAML) framework in the superparamaterized version of E3SM (SP‐E3SM) to explicitly simulate the subgrid variabilities of land states and fluxes at cloud‐resolving scale and their interactions with atmosphere. Comparing to the standard SP‐E3SM in which all the atmospheric columns of the cloud resolving model embedded within the global atmospheric model grid interact with the same land surface (i.e., multiple atmosphere single land (MASL)), the impact of MAML on the strength of land‐atmosphere coupling is limited, partly because the current implementation mainly facilitates one‐way coupling between the cloud‐resolving model and the land surface model. Despite such limitation, MAML increases the surface latent heat flux at the expense of sensible heat flux, and increases precipitation in India, Amazon, and Central Africa, reducing the model dry bias compared to the standard SP‐E3SM. By employing a normalized gross moist stability (NGMS) diagnostic framework, we find that the increase in precipitation minus evaporation (P‐E) is primarily driven by the change in large‐scale moisture convergence, particularly by the increase of water vapor in the lower atmosphere, while the local effect of total surface energy flux plays a minor role in the P‐E change. More specifically, MAML changes the surface energy partitioning (evaporative fraction), increases the atmosphere water vapor, and further increases P‐E by decreasing the NGMS. Finally, future development in the MAML framework is discussed.
The Amazon forest carbon sink is declining, mainly as a result of land-use and climate change 1 – 4 . Here we investigate how changes in law enforcement of environmental protection policies may have affected the Amazonian carbon balance between 2010 and 2018 compared with 2019 and 2020, based on atmospheric CO 2 vertical profiles 5 , 6 , deforestation 7 and fire data 8 , as well as infraction notices related to illegal deforestation 9 . We estimate that Amazonia carbon emissions increased from a mean of 0.24 ± 0.08 PgC year −1 in 2010–2018 to 0.44 ± 0.10 PgC year −1 in 2019 and 0.52 ± 0.10 PgC year −1 in 2020 (± uncertainty). The observed increases in deforestation were 82% and 77% (94% accuracy) and burned area were 14% and 42% in 2019 and 2020 compared with the 2010–2018 mean, respectively. We find that the numbers of notifications of infractions against flora decreased by 30% and 54% and fines paid by 74% and 89% in 2019 and 2020, respectively. Carbon losses during 2019–2020 were comparable with those of the record warm El Niño (2015–2016) without an extreme drought event. Statistical tests show that the observed differences between the 2010–2018 mean and 2019–2020 are unlikely to have arisen by chance. The changes in the carbon budget of Amazonia during 2019–2020 were mainly because of western Amazonia becoming a carbon source. Our results indicate that a decline in law enforcement led to increases in deforestation, biomass burning and forest degradation, which increased carbon emissions and enhanced drying and warming of the Amazon forests.
Carbon is among the most abundant substances in the universe; although severely depleted on Earth, it is the primary structural element in biochemistry. Complex interactions between carbon and climate have stabilized the Earth system over geologic time. Since the modern instrumental CO 2 record began in the 1950s, about half of fossil fuel emissions have been sequestered in the oceans and land ecosystems. Ocean uptake of fossil CO 2 is governed by chemistry and circulation. Net land uptake is surprising because it implies a persistent worldwide excess of growth over decay. Land carbon sinks include ( a) CO 2 fertilization, ( b) nitrogen fertilization, ( c) forest regrowth following agricultural abandonment, and ( d) boreal warming. Carbon sinks in both land and oceans are threatened by warming and are likely to weaken or even reverse as emissions fall with the potential for amplification of climate change due to the release of previously stored carbon. Fossil CO 2 will persist for centuries and perhaps many millennia after emissions cease. ▪ About half the carbon from fossil fuel combustion is removed from the atmosphere by sink processes in the land and oceans, slowing the increase of CO 2 and global warming. These sinks may weaken or even reverse as climate warms and emissions fall. ▪ The net land sink for CO 2 requires that plants have been growing faster than they decay for many decades, causing carbon to build up in the biosphere over and above the carbon lost to deforestation, fire, and other disturbances. ▪ CO 2 uptake by the oceans is slow because only the surface water is in chemical contact with the air. Cold water at depth is physically isolated by its density. Deep water mixes with the surface in about 1,000 years. The deep water does not know we are here yet! ▪ After fossil fuel emissions cease, much of the extra CO 2 will remain in the atmosphere for many centuries or even millennia. The lifetime of excess CO 2 depends on total historical emissions; 10% to 40% could last until the year 40,000 AD.
Abstract The Amazon Forest is a major locus for carbon and water cycling in the climate system whose function has been degraded in recent decades by land use and climate change. Most studies of Amazonia’s carbon balance have been limited by sparse sampling. We measured 742 atmospheric vertical profiles of CO2 and CO over four regions of Amazonia from 2010 through 2020. We estimate that Amazon carbon emissions increased from 0.24±0.19 PgC y-1 in 2010-18 to 0.44±0.22 in 2019 and 0.52±0.22 PgC y-1 in 2020. During these years, increases were also observed in deforestation (79% and 74%) and forest burned area (14% and 42%). Field notifications for illegal deforestation and related crimes dropped by 42%, while fines paid for judgments held fell by 89%. Carbon losses during 2019 and 2020 were comparable to losses in the record warm El Nino event of 2015-16, but this time with usual to moderate Oceanic Ninõ Index. 2020 showed 12% decrease in precipitation indicating also a climate impact in carbon emissions. The changes during 2019 and 2020 were mainly due to the western Amazonia becoming also a carbon source. We hypothesize that the consequences of the collapse in enforcement led to increase in deforestation, biomass burning and degradation producing net carbon losses and enhancing drying and warming of forest regions.
• Two case studies of the effects of heterogeneous soil moisture and surface energy budgets on organization and propagation of convective precipitation during MC3E • Development and evaluation of a new approach for simulating the effect of heterogeneous soil moisture at ARM-SGP using an innovative modeling approach • Investigation of the effects of spatial coupling scale using multidecade global simulations in CESM with the multiscale modeling framework • Exploration of changes to future precipitation intensity resulting from two different climate change scenarios using the multiscale model • Provision of the new cloud-scale coupled multiscale Earth System Model to the larger community through the CESM process.
mospheric measurements show that deforestation and rapid local warming have reduced or eliminated the capacity of the eastern Amazonian forest to absorb carbon dioxide — with worrying implications for future global warming.
In the Arctic and Boreal region (ABR) where warming is especially pronounced, the increase of gross primary production (GPP) has been suggested as an important driver for the increase of the atmospheric CO2 seasonal cycle amplitude (SCA). However, the role of GPP relative to changes in ecosystem respiration (ER) remains unclear, largely due to our inability to quantify these gross fluxes on regional scales. Here, we use atmospheric carbonyl sulfide (COS) measurements to provide observation-based estimates of GPP over the North American ABR. Our annual GPP estimate is 3.6 (2.4 to 5.5) PgC · y-1 between 2009 and 2013, the uncertainty of which is smaller than the range of GPP estimated from terrestrial ecosystem models (1.5 to 9.8 PgC · y-1). Our COS-derived monthly GPP shows significant correlations in space and time with satellite-based GPP proxies, solar-induced chlorophyll fluorescence, and near-infrared reflectance of vegetation. Furthermore, the derived monthly GPP displays two different linear relationships with soil temperature in spring versus autumn, whereas the relationship between monthly ER and soil temperature is best described by a single quadratic relationship throughout the year. In spring to midsummer, when GPP is most strongly correlated with soil temperature, our results suggest the warming-induced increases of GPP likely exceeded the increases of ER over the past four decades. In autumn, however, increases of ER were likely greater than GPP due to light limitations on GPP, thereby enhancing autumn net carbon emissions. Both effects have likely contributed to the atmospheric CO2 SCA amplification observed in the ABR.
The Atmospheric Carbon and Transport (ACT)-America NASA Earth Venture Suborbital Mission set out to improve regional atmospheric greenhouse gas (GHG) inversions by exploring the intersection of the strong GHG fluxes and vigorous atmospheric transport that occurs within the midlatitudes. Two research aircraft instrumented with remote and in situ sensors to measure GHG mole fractions, associated trace gases, and atmospheric state variables collected 1,140.7 flight hours of research data, distributed across 305 individual aircraft sorties, coordinated within 121 research flight days, and spanning five 6-week seasonal flight campaigns in the central and eastern United States. Flights sampled 31 synoptic sequences, including fair-weather and frontal conditions, at altitudes ranging from the atmospheric boundary layer to the upper free troposphere. The observations were complemented with global and regional GHG flux and transport model ensembles. We found that midlatitude weather systems contain large spatial gradients in GHG mole fractions, in patterns that were consistent as a function of season and altitude. We attribute these patterns to a combination of regional terrestrial fluxes and inflow from the continental boundaries. These observations, when segregated according to altitude and air mass, provide a variety of quantitative insights into the realism of regional CO 2 and CH 4 fluxes and atmospheric GHG transport realizations. The ACT-America dataset and ensemble modeling methods provide benchmarks for the development of atmospheric inversion systems. As global and regional atmospheric inversions incorporate ACT-America's findings and methods, we anticipate these systems will produce increasingly accurate and precise subcontinental GHG flux estimates.
Estimates of Amazon rainforest gross primary productivity (GPP) differ by a factor of 2 across a suite of three statistical and 18 process models. This wide spread contributes uncertainty to predictions of future climate. We compare the mean and variance of GPP from these models to that of GPP at six eddy covariance (EC) towers. Only one model's mean GPP across all sites falls within a 99% confidence interval for EC GPP, and only one model matches EC variance. The strength of model response to climate drivers is related to model ability to match the seasonal pattern of the EC GPP. Models with stronger seasonal swings in GPP have stronger responses to rain, light, and temperature than does EC GPP. The model to data comparison illustrates a trade-off inherent to deterministic models between accurate simulation of a mean (average) and accurate responsiveness to drivers. The trade-off exists because all deterministic models simplify processes and lack at least some consequential driver or interaction. If a model's sensitivities to included drivers and their interactions are accurate, then deterministically predicted outcomes have less variability than is realistic. If a GPP model has stronger responses to climate drivers than found in data, model predictions may match the observed variance and seasonal pattern but are likely to overpredict GPP response to climate change. High or realistic variability of model estimates relative to reference data indicate that the model is hypersensitive to one or more drivers.
A leading source of uncertainty in the magnitude of future climate change arises from feedback between the physical climate system and the carbon cycle. Output from 15 Earth System Models (ESMs) in the Coupled Model Intercomparison Project (CMIP5) shows that when forced by identical emissions, predicted atmospheric CO2 concentrations in 2100 ranged from 780 ppm to 1120 ppm due to variations in carbon cycle feedback among the models. The resulting difference in radiative forcing of climate is almost 2 W m-2, comparable to the total uncertainty in the physical climate system for the representative concentration pathway (RCP) 8.5 scenario in 2100. Scaling future carbon sources and sinks to match contemporary atmospheric CO2 reduced this uncertainty by a factor of five, suggesting that contemporary observations might dramatically constrain future predictions, but their scaling had no mechanistic basis, so it provides little insight on carbon cycle processes.
With nearly 1 million observations of column-mean carbon dioxide concentration (X-CO2) per day, the Orbiting Carbon Observatory 2 (OCO-2) presents exciting possibilities for monitoring the global carbon cycle, including the detection of subcontinental column CO2 variations. While the OCO-2 data set has been shown to achieve target precision and accuracy on a single-sounding level, the validation of X-CO2 spatial gradients on subcontinental scales remains challenging. In this work, we investigate the use of an integrated path differential absorption (IPDA) lidar for evaluation of OCO-2 observations via NASA's Atmospheric Carbon and Transport (ACT)-America project. The project has completed eight clear-sky underflights of OCO-2 with the Multifunctional Fiber Laser Lidar (MFLL)-along with a suite of in situ instruments-giving a precisely colocated, high-resolution validation data set spanning nearly 3,800 km across four seasons. We explore the challenges and opportunities involved in comparing the MFLL and OCO-2 X-CO2 data sets and evaluate their agreement on synoptic and local scales. We find that OCO-2 synoptic-scale gradients generally agree with those derived from the lidar, typically to +/- 0.1 ppm per degree latitude for gradients ranging in strength from 0 to 1 ppm per degree latitude. CO2 reanalysis products also typically agree to +/- 0.25 ppm per degree when compared with an in situ-informed CO2 "curtain." Real X-CO2 features at local scales, however, remain challenging to observe and validate from space, with correlation coefficients typically below 0.35 between OCO-2 and the MFLL. Even so, ACT-America data have helped investigate interesting local X-CO2 patterns and identify systematic spurious cloud-related features in the OCO-2 data set.
 Kenneth Davis合作论文数Institute of Energy and the Environment, Pennsylvania State University;College of Earth and Mineral Sciences, Pennsylvania State University52
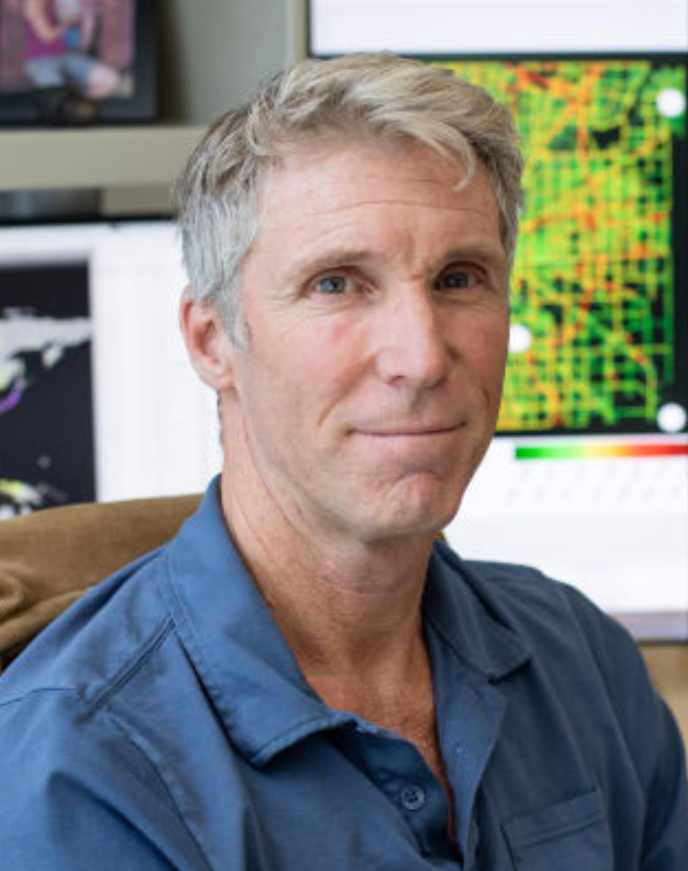 Kevin Gurney合作论文数School of Informatics, Computing and Cyber Systems, Northern Arizona University;Crosswalk Labs40
 Andrew Schuh合作论文数38
 Katherine D. Corbin合作论文数31
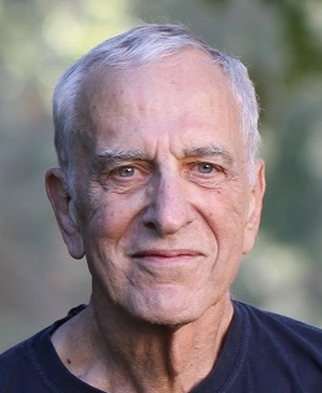 Joseph A. Berry合作论文数Department of Global Ecology, Carnegie Institution of Washington;Department of Biology, School of Humanities and Sciences, Stanford University30
 Peter Rayner合作论文数Division of Science, School of Geography, Earth and Atmospheric Sciences, The University of Melbourne29
 David A. Randall合作论文数Department of Atmospheric Science, Walter Scott, Jr. College of Engineering, Colorado State University28S. R. Kawa合作论文数28Lara Prihodko合作论文数27
 Kevin Schaefer合作论文数Cooperative Institute for Research in Environmental Sciences, University of Colorado Boulder25
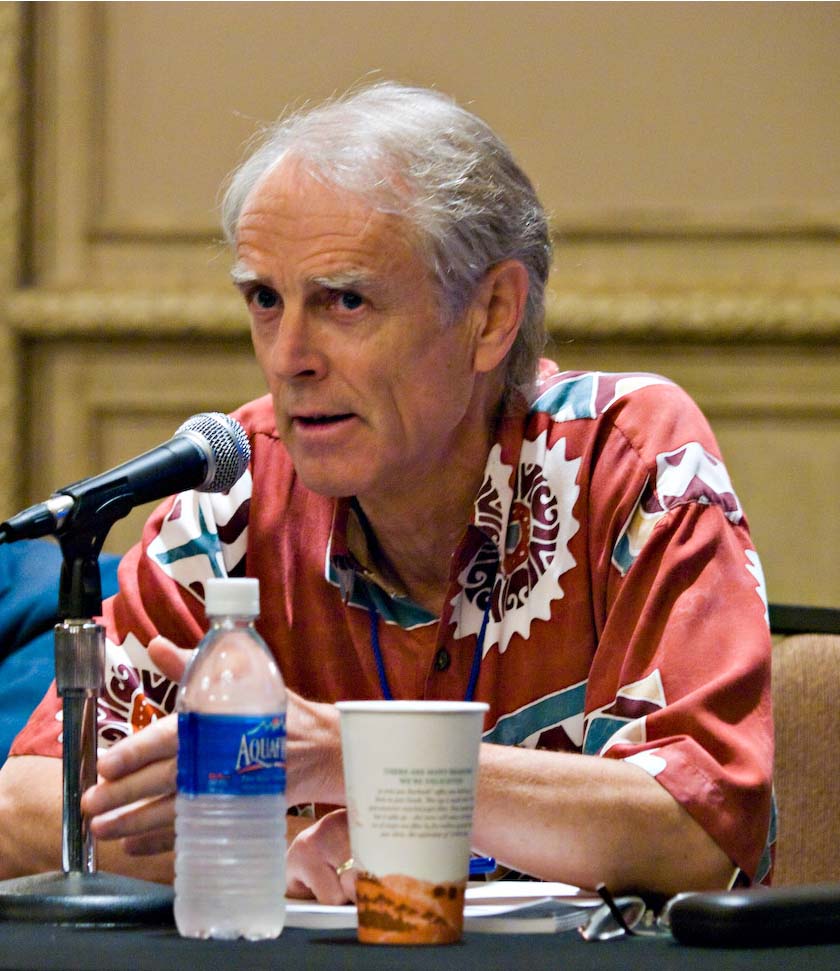 Pieter Tans合作论文数Global Monitoring Laboratory, National Oceanic & Atmospheric Administration;Institute of Arctic and Alpine Research, University of Colorado Boulder23
 Philippe Ciais合作论文数Laboratoire des Sciences du Climat et de l'Environnement19
 Martin Heimann合作论文数Department Biogeochemical Signals, Max Planck Institute for Biogeochemistry;Institute for Atmospheric and Earth System Research, University of Helsinki19Marek Uliasz合作论文数18G. J. Collatz合作论文数18Rachel Law合作论文数18Dusanka Zupanski合作论文数Cooperative Institute for Research in the Atmosphere;Colorado State University17
 Arlyn Andrews合作论文数Global Monitoring Laboratory, National Oceanic and Atmospheric Administration17
 James T Randerson合作论文数Department of Earth System Science, School of Physical Sciences, University of California, Irvine16Peter S Bakwin合作论文数16
 Philippe Peylin合作论文数15N Parazoo合作论文数15Ravindra S. Lokupitiya合作论文数Department of Atmospheric Science;Colorado State University;Department of Atmospheric Science, Colorado State University15
 Thomas Lauvaux合作论文数Laboratoire des Sciences|du Climat et de l'Environnement15
 Philippe Bousquet合作论文数Laboratoire des Sciences du Climat et de l'Environnement, Commissariat a l'Energie Atomique15
 Piers Sellers合作论文数NASA Goddard's Sciences and Exploration Directorate14L. Bruhwiler合作论文数14
 John B. Miller合作论文数Cooperative Institute for Research in Environmental Science, University of Colorado Boulder;Global Monitoring Laboratory, National Oceanic & Atmospheric Administration12
 Scott Doney合作论文数Scott Doney Computational Biogeochemistry Lab, Department of Environmental Sciences, University of Virginia12
 Steven Pawson合作论文数Goddard Space Flight Center, National Aeronautics and Space Administration12
 Shamil Maksyutov合作论文数Center for Global Environmental Research, National Institute for Environmental Studies12Mark Branson合作论文数11
 Scott J. Richardson合作论文数Department of Meteorology and Atmospheric Science, College of Earth and Mineral Sciences, Penn State University11Takashi Maki合作论文数Observations Department, Japan Meteorological Agency11N. Suits合作论文数11
 Shoichi Taguchi合作论文数11Reto Stockli合作论文数11
 Nicholas C. Parazoo合作论文数Department of Atmospheric Science, Colorado State University11N. Miles合作论文数10
 Andrew Jacobson合作论文数Department of Earth and Planetary Sciences, Weinberg College of Arts and Sciences, Northwestern University10
 Inez Fung合作论文数Department of Environmental Science, Policy, and Management, College of Natural Resources, University of California, Berkeley10
 Bruce Harper合作论文数Systems Engineering;Australia Pty Ltd10David F. Baker合作论文数10Katherine Haynes合作论文数9
 Michael J. Prather合作论文数Department of Earth System Science, University of California, Irvine9
 Ian Baker合作论文数Thayer School of Engineering, Dartmouth College9
 Chris O'Dell合作论文数Cooperative Institute for Research in the Atmosphere, Colorado State University9
 Steven Wofsy合作论文数Department of Earth and Planetary Sciences, Harvard John A. Paulson School Of Engineering And Applied Sciences, Harvard University9




