This report is about an intercomparison experiment that was performed to compare the methane plume detection and quantification based on EMIT remote sensing measurements. The experiment consisted of eight teams analyzing four measurement scenes from EMIT and reporting back results such as plume origins, plume outlines, estimated emission rates, and uncertainties. Comparisons of results across the team are reported, as well as the aggregate statistics, such as box and whisker plots of the emission rates, scatter of the plume origins, and coefficient of variance (COV) for the results. The small size of the datasets limits the generalizability of the results. One key outcome of this work was the development of methods for comparison of results, including application of rotation to plume origins to evaluate in the context of the wind field. We also tested the impact of holding variables constants, such as the wind speed. In this report, we show that the emission rate estimates have COVs of 30% to 50% in the majority of cases, and using the same wind speed across all teams did not drastically change this. The plume origin analysis showed that the cross wind spread of plume origin results was 50 m to 110 m in all but one case, and across wind was 60 m to 120 m in 13 of the 15 cases. The EMIT footprint is 60m, so the variations were roughly 1 to 2 pixels. In future work, we will build on the methods developed here and include measurements over controlled releases where the bias of the emission estimates can be assessed.
Accurate and measurement-based methane data is urgently needed by countries to support science-based policy for the achievement of their methane reduction ambitions. The United Nations Environment Program (UNEP)’s International Methane Emissions Observatory (IMEO) is responding to this need by collecting and integrating diverse methane emissions data streams, one of which is data from Methane Science Studies funded by IMEO. IMEO’s Methane Science Studies (MSS) are making a difference through funding methane measurement studies and collaborating with scientists worldwide. The overarching aim of the MSS is to close the knowledge gaps and improve the understanding of the locations and magnitude of methane emissions across sectors, especially in regions where there is limited or no publicly available data. The studies have initially focused on the oil and gas sector but are now branching out into other anthropogenic sectors. By Jan 2024, IMEO has launched 35 studies around the world with 32 academic/research institutions and 22 peer-reviewed papers published so far. In Europe alone, IMEO has initiated 8 studies in countries including Romania, Poland, Germany, France, Netherlands, Norway, and the UK. In this presentation, we will provide an overview of i) the current scope of IMEO Methane Science Studies ii) key study achievements and findings of the completed studies, and iii) potential opportunities and resources for interested research institutes.
Venezuela has long been identified as an area with large methane emissions and intensive oil exploitation, especially in the Lake Maracaibo region, but production has strongly decreased in recent years. The area is notoriously difficult to observe from space due to its complex topography and persistent cloud cover. We use the unprecedented coverage of the TROPOspheric Monitoring Instrument (TROPOMI) methane observations in analytical inversions with the Integrated Methane Inversion (IMI) framework at the national scale and at the local scale with the Weather Research and Forecasting model with chemistry (WRF-Chem). In the IMI analysis, we find Venezuelan emissions of 7.5 (5.7–9.3) Tg a−1 in 2019, where about half of emissions can be informed by TROPOMI observations, and emissions from oil exploitation are a factor of ∼ 1.6 higher than in bottom-up inventories. Using WRF, we find emissions of 1.2 (1.0–1.5) Tg a−1 from the Lake Maracaibo area in 2019, close to bottom-up estimates. Our WRF estimate is ∼ 40 % lower than the result over the same region from the IMI due to differences in the meteorology used by the two models. We find only a small, non-significant trend in emissions between 2018 and 2020 around the lake, implying the area's methane emission intensity expressed against oil and gas production has doubled over the time period, to ∼ 20 %. This value is much higher than what has previously been found for other oil and gas production regions and indicates that there could be large emissions from abandoned infrastructure.
Two years of satellite observations were used to quantify methane emission from coal mines in Queensland, the largest coal-producing state in Australia. The six analyzed surface and underground coal mines are estimated to emit 570+/-98 Gg a-1 in 2018-2019. Together, they account for 7% of the national coal production, while emitting 55+/-10% of the reported methane emission from coal mining in Australia. Our results indicate that for two of the three locations our satellite-based estimates are significantly higher than reported to the Australian government. Most remarkably, 40% of the quantified emission came from a single surface mine (Hail Creek) located in a methane-rich coal basin. Our findings call for increased monitoring and investment in methane recovery technologies for both surface and underground mines.
We quantify 2019 annual mean methane emissions in the contiguous US (CONUS) at 0.25° × 0.3125° resolution by inverse analysis of atmospheric methane columns measured by the Tropospheric Monitoring Instrument (TROPOMI). A gridded version of the US Environmental Protection Agency (EPA) Greenhouse Gas Emissions Inventory (GHGI) serves as the basis for the prior estimate for the inversion. We optimize emissions and quantify observing system information content for an eight-member inversion ensemble through analytical minimization of a Bayesian cost function. We achieve high resolution with a reduced-rank characterization of the observing system that optimally preserves information content. Our optimal (posterior) estimate of anthropogenic emissions in CONUS is 30.9 (30.0–31.8) Tg a−1, where the values in parentheses give the spread of the ensemble. This is a 13 % increase from the 2023 GHGI estimate for CONUS in 2019. We find emissions for livestock of 10.4 (10.0–10.7) Tg a−1, for oil and gas of 10.4 (10.1–10.7) Tg a−1, for coal of 1.5 (1.2–1.9) Tg a−1, for landfills of 6.9 (6.4–7.5) Tg a−1, for wastewater of 0.6 (0.5–0.7), and for other anthropogenic sources of 1.1 (1.0–1.2) Tg a−1. The largest increase relative to the GHGI occurs for landfills (51 %), with smaller increases for oil and gas (12 %) and livestock (11 %). These three sectors are responsible for 89 % of posterior anthropogenic emissions in CONUS. The largest decrease (28 %) is for coal. We exploit the high resolution of our inversion to quantify emissions from 70 individual landfills, where we find emissions are on median 77 % larger than the values reported to the EPA's Greenhouse Gas Reporting Program (GHGRP), a key data source for the GHGI. We attribute this underestimate to overestimated recovery efficiencies at landfill gas facilities and to under-accounting of site-specific operational changes and leaks. We also quantify emissions for the 48 individual states in CONUS, which we compare to the GHGI's new state-level inventories and to independent state-produced inventories. Our posterior emissions are on average 27 % larger than the GHGI in the largest 10 methane-producing states, with the biggest upward adjustments in states with large oil and gas emissions, including Texas, New Mexico, Louisiana, and Oklahoma. We also calculate emissions for 95 geographically diverse urban areas in CONUS. Emissions for these urban areas total 6.0 (5.4–6.7) Tg a−1 and are on average 39 (27–52) % larger than a gridded version of the 2023 GHGI, which we attribute to underestimated landfill and gas distribution emissions.
ADVERTISEMENT RETURN TO ARTICLES ASAPPREVCorrespondence/Rebut...Correspondence/RebuttalNEXTORIGINAL ARTICLEThis notice is a correctionRebuttal to Correspondence on "Methane Emissions from Superemitting Coal Mines in Australia Quantified Using TROPOMI Satellite Observations"Pankaj Sadavarte*Pankaj Sadavarte*[email protected]More by Pankaj Sadavarte, Sudhanshu PandeySudhanshu PandeyMore by Sudhanshu Pandey, Joannes D. MaasakkersJoannes D. MaasakkersMore by Joannes D. Maasakkers, Alba LorenteAlba LorenteMore by Alba Lorente, Tobias BorsdorffTobias BorsdorffMore by Tobias Borsdorff, Hugo Denier van der GonHugo Denier van der GonMore by Hugo Denier van der Gon, Sander HouwelingSander HouwelingMore by Sander Houweling, and Ilse AbenIlse AbenMore by Ilse AbenCite this: Environ. Sci. Technol. 2024, XXXX, XXX, XXX-XXXPublication Date (Web):March 8, 2024Publication History Received9 February 2024Accepted26 February 2024Revised23 February 2024Published online8 March 2024https://doi.org/10.1021/acs.est.4c01510© 2024 American Chemical Society. This publication is available under these Terms of Use. Request reuse permissions This publication is free to access through this site. Learn MoreArticle Views-Altmetric-Citations-LEARN ABOUT THESE METRICSArticle Views are the COUNTER-compliant sum of full text article downloads since November 2008 (both PDF and HTML) across all institutions and individuals. These metrics are regularly updated to reflect usage leading up to the last few days.Citations are the number of other articles citing this article, calculated by Crossref and updated daily. Find more information about Crossref citation counts.The Altmetric Attention Score is a quantitative measure of the attention that a research article has received online. Clicking on the donut icon will load a page at altmetric.com with additional details about the score and the social media presence for the given article. Find more information on the Altmetric Attention Score and how the score is calculated. Share Add toView InAdd Full Text with ReferenceAdd Description ExportRISCitationCitation and abstractCitation and referencesMore Options Share onFacebookTwitterWechatLinked InRedditEmail PDF (591 KB) Get e-AlertscloseSUBJECTS:Cluster chemistry,Coal,Hydrocarbons,Inorganic carbon compounds,Mathematical methods Get e-Alerts
The Arctic and boreal regions are experiencing a rapid increase in temperature, resulting in a changing cryosphere, increasing human activity, and potentially increasing high-latitude methane emissions. Satellite observations from Sentinel-5P TROPOMI provide an unprecedented coverage of a column-averaged dry-air mole fraction of methane (XCH4) in the Arctic, compared to previous missions or in situ measurements. The purpose of this study is to support and enhance the data used for high-latitude research through presenting a systematic evaluation of TROPOMI methane products derived from two different processing algorithms: the operational product (OPER) and the scientific product (WFMD), including the comparison of recent version changes of the products (OPER, OPER rpro, WFMD v1.2, and WFMD v1.8). One finding is that OPER rpro yields lower XCH4 than WFMD v1.8, the difference increasing towards the highest latitudes. TROPOMI product differences were evaluated with respect to ground-based high-latitude references, including four Fourier Transform Spectrometer in the Total Carbon Column Observing Network (TCCON) and five EM27/SUN instruments in the Collaborative Carbon Column Observing Network (COCCON). The mean TROPOMI–TCCON GGG2020 daily median XCH4 difference was site-dependent and varied for OPER rpro from −0.47 ppb to 22.4 ppb, and for WFMD v1.8 from 1.2 ppb to 19.4 ppb with standard deviations between 13.0 and 20.4 ppb and 12.5–15.0 ppb, respectively. The TROPOMI–COCCON daily median XCH4 difference varied from −26.5 ppb to 5.6 ppb for OPER rpro, with a standard deviation of 14.0–28.7 ppb, and from −5.0 ppb to 17.2 ppb for WFMD v1.8, with a standard deviation of 11.5–13.0 ppb. Although the accuracy and precision of both TROPOMI products are, on average, good compared to the TCCON and COCCON, a persistent seasonal bias in TROPOMI XCH4 (high values in spring; low values in autumn) is found for OPER rpro and is reflected in the higher standard deviation values. A systematic decrease of about 7 ppb was found between TCCON GGG2014 and GGG2020 product update highlighting the importance of also ensuring the reliability of ground-based retrievals. Comparisons to atmospheric profile measurements with AirCore carried out in Sodankylä, Northern Finland, resulted in XCH4 differences comparable to or smaller than those from ground-based remote sensing.
Methane emissions from oil and gas production provide an important contribution to global warming. We investigate 2020 emissions from the largest gas field in Algeria, Hassi R'Mel, and the oil-production-dominated area Hassi Messaoud. We use methane data from the high-resolution (20 m) Sentinel-2 instruments to identify and estimate emission time series for 11 superemitters (including 10 unlit flares). We integrate this information in a transport model inversion that uses methane data from the coarser (7 km × 5.5 km) but higher-precision TROPOMI instrument to estimate emissions from both the 11 superemitters (>1 t/h individually) and the remaining diffuse area source (not detected as point sources with Sentinel-2). Compared to a bottom-up inventory for 2019 that is aligned with UNFCCC-reported emissions, we find that 2020 emissions in Hassi R'Mel (0.16 [0.11–0.22] Tg/yr) are lower by 53 [24–73]%, and emissions in Hassi Messaoud (0.22 [0.13–0.28] Tg/yr) are higher by 79 [4–188]%. Our analysis indicates that a larger fraction of Algeria's methane emissions (∼75%) come from oil production than national reporting suggests (5%). Although in both regions the diffuse area source constitutes the majority of emissions, relatively few satellite-detected superemitters provide a significant contribution (24 [12–40]% in Hassi R'Mel; 49 [27–71]% in Hassi Messaoud), indicating that mitigation efforts should address both. Our synergistic use of Sentinel-2 and TROPOMI can produce a unique and detailed emission characterization of oil and gas production areas.
A reduction in anthropogenic methane emissions is vital to limit near-term global warming. A small number of so-called super-emitters is responsible for a disproportionally large fraction of total methane emissions. Since late 2017, the TROPOspheric Monitoring Instrument (TROPOMI) has been in orbit, providing daily global coverage of methane mixing ratios at a resolution of up to 7×5.5 km2, enabling the detection of these super-emitters. However, TROPOMI produces millions of observations each day, which together with the complexity of the methane data, makes manual inspection infeasible. We have therefore designed a two-step machine learning approach using a convolutional neural network to detect plume-like structures in the methane data and subsequently apply a support vector classifier to distinguish the emission plumes from retrieval artifacts. The models are trained on pre-2021 data and subsequently applied to all 2021 observations. We detect 2974 plumes in 2021, with a mean estimated source rate of 44 t h−1 and 5–95th percentile range of 8–122 t h−1. These emissions originate from 94 persistent emission clusters and hundreds of transient sources. Based on bottom-up emission inventories, we find that most detected plumes are related to urban areas and/or landfills (35 %), followed by plumes from gas infrastructure (24 %), oil infrastructure (21 %), and coal mines (20 %). For 12 (clusters of) TROPOMI detections, we tip and cue the targeted observations and analysis of high-resolution satellite instruments to identify the exact sources responsible for these plumes. Using high-resolution observations from GHGSat, PRISMA, and Sentinel-2, we detect and analyze both persistent and transient facility-level emissions underlying the TROPOMI detections. We find emissions from landfills and fossil fuel exploitation facilities, and for the latter, we find up to 10 facilities contributing to one TROPOMI detection. Our automated TROPOMI-based monitoring system in combination with high-resolution satellite data allows for the detection, precise identification, and monitoring of these methane super-emitters, which is essential for mitigating their emissions.
Carbon monoxide, XCO, and methane, XCH4, column-averaged dry-air mole fractions (DMFs), observed by the TROPOspheric Monitoring Instrument (TROPOMI) on board Sentinel-5P (S-5P), are validated against those obtained from a Bruker ground-based low-resolution Fourier transform spectrometer, EM27/SUN, operating in the framework and according to requirements of the Collaborative Carbon Column Observing Network (COCCON), in Thessaloniki, Greece, on a mid-latitude urban site. The current operational S5P/TROPOMI observations show very good agreement with the respective FTIR measurements and capture both their seasonal variability and pollution episodes. XCO reported the highest concentrations during the fire episodes in summer 2021, when its daily mean value reached a maximum of 0.134 ± 0.015 ppm. XCH4 shows a slight annual increase of 0.02 ppm, with the highest concentrations during early 2022 (approximately 1.92 ppm). The satellite CH4 and CO products have been recently reprocessed with updated CH4, CO and H2O cross-sections, among other improvements, bringing noticeable changes in the pre-existing biases of S5P products against the FTIR ground-based data. We report that, for this mid-latitude station, mean biases and standard deviations fall well within mission requirements for XCH4 and XCO (−0.01 ± 0.6% and 0.62 ± 4.2% for XCH4 and XCO, respectively), underlying the significance of satellite measurements as a valuable supplement to ground-based data for the purpose of greenhouse gas monitoring. The results presented in this work for the Thessaloniki FTIR instrument are in strong agreement with FTIR locations in the middle latitudes.
Satellite observations of dry-column methane mixing ratios (XCH4) from shortwave infrared (SWIR) solar backscatter radiation provide a powerful resource to quantify methane emissions in service of climate action. The TROPOspheric Monitoring Instrument (TROPOMI), launched in October 2017, provides global daily coverage at a 5.5 X 7 km(2) (nadir) pixel resolution, but its methane retrievals can suffer from biases associated with SWIR surface albedo, scattering from aerosols and cirrus clouds, and across-track variability (striping). The Greenhouse gases Observing SATellite (GOSAT) instrument, launched in 2009, has better spectral characteristics and its methane retrieval is much less subject to biases, but its data density is 250 times sparser than TROPOMI. Here, we present a blended TROPOMI CGOSAT methane product obtained by training a machine learning (ML) model to predict the difference between TROPOMI and GOSAT co-located measurements, using only predictor variables included in the TROPOMI retrieval, and then applying the correction to the complete TROPOMI record from April 2018 to present. We find that the largest corrections are associated with coarse aerosol particles, high SWIR surface albedo, and across-track pixel index. Our blended product corrects a systematic difference between TROPOMI and GOSAT over water, and it features corrections exceeding 10 ppb over arid land, persistently cloudy regions, and high northern latitudes. It reduces the TROPOMI spatially variable bias over land (referenced to GOSAT data) from 14.3 to 10.4 ppb at a 0.25 degrees X 0.3125 degrees resolution. Validation with Total Carbon Column Observing Network (TCCON) ground-based column measurements shows reductions in variable bias compared with the original TROPOMI data from 4.7 to 4.4 ppb and in single-retrieval precision from 14.5 to 11.9 ppb. TCCON data are all in locations with a SWIR surface albedo below 0.4 (where TROPOMI biases tend to be relatively low), but they confirm the dependence of TROPOMI biases on SWIR surface albedo and coarse aerosol particles, as well as the reduction of these biases in the blended product. Fine-scale inspection of the Arabian Peninsula shows that a number of hotspots in the original TROPOMI data are removed as artifacts in the blended product. The blended product also corrects striping and aerosol/cloud biases in single-orbit TROPOMI data, enabling better detection and quantification of ultra-emitters. Residual coastal biases can be removed by applying additional filters. The ML method presented here can be applied more generally to validate and correct data from any new satellite instrument by reference to a more established instrument.
We use 2019 TROPOMI satellite observations of atmospheric methane in an analytical inversion to quantify methane emissions from the Middle East and North Africa at up to similar to 25 km x 25 km resolution, using spatially allocated national United Nations Framework Convention on Climate Change (UNFCCC) reports as prior estimates for the fuel sector. Our resulting best estimate of anthropogenic emissions for the region is 35% higher than the prior bottom-up inventories (+103% for gas, +53% for waste, +49% for livestock, -14% for oil) with large variability across countries. Oil and gas account for 38% of total anthropogenic emissions in the region. TROPOMI observations can effectively optimize and separate national emissions by sector for most of the 23 countries in the region, with 6 countries accounting for most of total anthropogenic emissions including Iran (5.3 (5.0-5.5) Tg a(-1); best estimate and uncertainty range), Turkmenistan (4.4 (2.8-5.1) Tg a(-1)), Saudi Arabia (4.3 (2.4-6.0) Tg a(-1)), Algeria (3.5 (2.4-4.4) Tg a(-1)), Egypt (3.4 (2.5-4.0) Tg a(-1)), and Turkey (3.0 (2.0-4.1) Tg a(-1)). Most oil-gas emissions are from the production (upstream) subsector, but Iran, Turkmenistan, and Saudi Arabia have large gas emissions from transmission and distribution subsectors. We identify a high number of annual oil-gas emission hotspots in Turkmenistan, Algeria, and Oman and offshore in the Persian Gulf. We show that oil-gas methane emissions for individual countries are not related to production, invalidating a basic premise in the construction of activity-based bottom-up inventories. Instead, local infrastructure and management practices appear to be key drivers of oil-gas emissions, emphasizing the need for including top-down information from atmospheric observations in the construction of oil-gas emission inventories. We examined the methane intensity, defined as the upstream oil-gas emission per unit of methane gas produced, as a measure of the potential for decreasing emissions from the oil-gas sector and using as reference the 0.2% target set by the industry. We find that the methane intensity in most countries is considerably higher than this target, reflecting leaky infrastructure combined with deliberate venting or incomplete flaring of gas. However, we also find that Kuwait, Saudi Arabia, and Qatar meet the industry target and thus show that the target is achievable through the capture of associated gas, modern infrastructure, and the concentration of operations. Decreasing methane intensities across the Middle East and North Africa to 0.2% would achieve a 90% decrease in oil-gas upstream emissions and a 26% decrease in total anthropogenic methane emissions in the region, making a significant contribution toward the Global Methane Pledge.
Satellite remote sensing of methane (CH4) using the TROPOspheric Monitoring Instrument (TROPOMI) aboard the Copernicus Sentinel-5 Precursor (S5-P) satellite is key to monitor and quantify emissions globally. Overall, the S5-P methane data are of satisfying quality, demonstrated by the product validation with ground-based measurements from the Total Carbon Column Observing Network (TCCON). However, analysis of TROPOMI dry-air column mixing ratio (XCH4) data has pointed to a few false methane anomalies up to 20-40 ppb that can potentially be misinterpreted as enhancements due to strong emission sources. These artefacts are caused by spectral features of the underlying surfaces of specific materials (e.g. carbonate rocks), which are not well represented in the forward model of the retrieval algorithm. In this study we show that the observed anomalies are due to the surface model which describes the spectral dependence of the Lambertian albedo by a second-order polynomial in wavelength. By analysing the ECOSTRESS library that contains laboratory spectra for different types of surfaces, we find that a quadratic function might not be the most optimal representation of the surface reflectance spectral dependencies in the short-wave infrared (SWIR) range. Already the use of a third-order polynomial improves the methane data such that the anomalies disappear at several locations (e.g. Siberia, Australia and Algeria) without affecting the data quality elsewhere, and the quality of the fit significantly improves. We also found that the known bias in retrieved methane for low-albedo scenes slightly improves, but still, a posterior correction needs to be applied, leaving open the question about the root cause of the albedo bias. After applying the adjusted surface model globally, we perform the routine validation with TCCON and Greenhouse gases Observing SATellite (GOSAT) data. GOSAT comparison does not significantly improve, while TCCON validation results show a small improvement in some stations of 2-4 ppb, up to a factor of 10 smaller than the artificial XCH4 enhancements. This reflects that TCCON stations are not close to any of the corrected artefacts, hinting at a limitation of the current validation approach of the S5-P XCH4 data product.
Methane emissions from oil and gas production provide an important and partly mitigable contribution to anthropogenic global warming. Here, we investigate 2020 emissions from the largest gas field in Algeria, Hassi R'Mel, and the oil production dominated area of Hassi Messaoud. We first use methane data from the high-resolution (20 m) Sentinel-2 instrument to identify eleven point source super-emitters (1 in Hassi R'Mel and 10 in Hassi Messaoud), ten of which correspond to unlit flares likely related to oil production. For each point source we construct emission timeseries based on methane enhancements as observed with Sentinel-2. We integrate this information in a transport model inversion that uses methane data from the coarser (7.5 x 5km2) but higher-precision TROPOMI instrument to estimate emissions from both diffuse area sources and the 11 super-emitting point sources (> 1 t/hr individually). Compared to the bottom-up inventory of Scarpelli et al. (2022) for 2019 that is aligned with UNFCCC-reported emissions, we find that 2020 emissions in Hassi R'Mel (0.16 [0.11-0.22] Tg/yr) are lower by 53 [24-73]%, and emissions in Hassi Messaoud (0.22 [0.13-0.28] Tg/yr) are higher by 79 [4-188]%. Both the Sentinel-2 analysis and the TROPOMI-based emissions indicate that a much larger fraction of Algeria's methane emissions come from oil production than national reporting suggests. Additionally, we find that although in both regions diffuse area sources constitute the majority of emissions, relatively few space-detected super-emitters also provide a large contribution to the total area emissions (24 [12-40]% in Hassi R'Mel; 49 [27-71]% in Hassi Messaoud). The importance of both super-emitters and diffuse area sources indicates that mitigation efforts should address both the largest super-emitters, as well as include a wider portfolio of mitigation measures to improve oil and gas infrastructure in general. Our analysis shows that synergistic use of Sentinel-2 and TROPOMI, both with frequent global coverage, can produce a unique and detailed emission characterization of oil and gas production areas. Producing comparable emission characterizations for other areas is an important next step, as the contribution from super-emitters to total area emissions will differ between regions.
We quantify weekly methane emissions at 0.25∘ × 0.3125∘ (≈25 × 25 km2) resolution from the Permian Basin, the largest oil production basin in the US, by inverse analysis of satellite observations from the TROPOspheric Monitoring Instrument (TROPOMI) from May 2018 to October 2020. The mean oil and gas emission from the region (± standard deviation of weekly estimates) was 3.7 ± 0.9 Tg a−1, higher than previous TROPOMI inversion estimates that may have used biased prior emissions or background assumptions. We find strong week-to-week variability in emissions superimposed on longer-term trends, and these are consistent with independent inferences of temporal emission variability from tower, aircraft, and multispectral satellite data. New well development and natural gas spot price were significant drivers of variability in emissions over our study period but the concurrent 50 % increase in oil and gas production was not. The methane intensity (methane emitted per unit of methane gas produced) averaged 4.6 % ± 1.3 % and steadily decreased from 5 %–6 % in 2018 to 3 %–4 % in 2020. While the decreasing trend suggests improvement in operator practices during the study period, methane emissions from the Permian Basin remained high, with methane intensity an order of magnitude above the industry target of <0.2 %. Our success in using TROPOMI satellite observations for weekly estimates of emissions from a major oil production basin shows promise for application to near-real-time monitoring in support of climate change mitigation efforts.
Reducing methane emissions from fossil fuel exploitation (oil, gas, coal) is an important target for climate policy, but current national emission inventories submitted to the United Nations Framework Convention on Climate Change (UNFCCC) are highly uncertain. Here we use 22 months (May 2018-Feb 2020) of satellite observations from the TROPOMI instrument to better quantify national emissions worldwide by inverse analysis at up to 50 km resolution. We find global emissions of 62.7 ± 11.5 (2σ) Tg a-1 for oil-gas and 32.7 ± 5.2 Tg a-1 for coal. Oil-gas emissions are 30% higher than the global total from UNFCCC reports, mainly due to under-reporting by the four largest emitters including the US, Russia, Venezuela, and Turkmenistan. Eight countries have methane emission intensities from the oil-gas sector exceeding 5% of their gas production (20% for Venezuela, Iraq, and Angola), and lowering these intensities to the global average level of 2.4% would reduce global oil-gas emissions by 11 Tg a-1 or 18%.
We apply atmospheric methane column retrievals from two different satellite instruments (Greenhouse gases Observing SATellite – GOSAT; TROPOspheric Monitoring Instrument – TROPOMI) to a regional inversion framework to quantify East Asian methane emissions for 2019 at 0.5∘ × 0.625∘ horizontal resolution. The goal is to assess if GOSAT (relatively mature but sparse) and TROPOMI (new and dense) observations inform consistent methane emissions from East Asia with identically configured inversions. Comparison of the results from the two inversions shows similar correction patterns to the prior inventory in central northern China, central southern China, northeastern China, and Bangladesh, with less than 2.6 Tg a−1 differences in regional posterior emissions. The two inversions, however, disagree over some important regions, particularly in northern India and eastern China. The methane emissions inferred from GOSAT observations are 7.7 Tg a−1 higher than those from TROPOMI observations over northern India but 6.4 Tg a−1 lower over eastern China. The discrepancies between the two inversions are robust against varied inversion configurations (i.e., assimilation window and error specifications). We find that the lower methane emissions from eastern China inferred by the GOSAT inversion are more consistent with independent ground-based in situ and total column (TCCON) observations, indicating that the TROPOMI retrievals may have high XCH4 biases in this region. We also evaluate inversion results against tropospheric aircraft observations over India during 2012–2014 by using a consistent GOSAT inversion of earlier years as an intercomparison platform. This indirect evaluation favors lower methane emissions from northern India inferred by the TROPOMI inversion. We find that in this case the discrepancy in emission inference is contributed by differences in data coverage (almost no observations by GOSAT vs. good spatial coverage by TROPOMI) over the Indo-Gangetic Plain. The two inversions also differ substantially in their posterior estimates for northwestern China and neighboring Kazakhstan, which is mainly due to seasonally varying biases between GOSAT and TROPOMI XCH4 data that correlate with changes in surface albedo.
Even though methane concentrations have contributed an estimated 23% of climate forcing, part of the recent increases in the global methane background concentrations remain unexplained. Satellite remote sensing has been used extensively to constrain emission inventories, for example with the TROPOspheric Monitoring Instrument which has been measuring methane since November 2017. We have identified enhancements of methane over 61 urban areas around the world and estimate their emissions using a two-dimensional Gaussian model. We show that methane emissions from urban areas may be underestimated by a factor of 3–4 in the Emissions Database for Global Atmospheric Research (EDGAR) greenhouse gas emission inventory. Scaling our results to the 385 urban areas with more than 2 million inhabitants suggests that they could account for up to 22% of global methane emissions. The emission estimates of the 61 urban areas do not correlate with the total or sectoral EDGAR emission inventory. They do however correlate with estimated rates of untreated wastewater, varying from 33 kg person ^−1 year ^−1 for cities with zero untreated wastewater to 138 kg person ^−1 year ^−1 for the cities with the most untreated wastewater. If this relationship were confirmed by higher resolution remote sensing or in situ monitoring, we estimate that reducing discharges of untreated wastewater could reduce global methane emissions by up to 5%–10% while at the same time yielding significant ecological and human co-benefits.
This paper presents an extended scientific HDO/H2O total column data product from short-wave infrared (SWIR) measurements by the Tropospheric Monitoring Instrument (TROPOMI) including clear-sky and cloudy scenes. The retrieval employs a forward model which accounts for scattering, and the algorithm infers the trace gas column information, surface properties, and effective cloud parameters from the observations. Compared to the previous clear-sky-only data product, coverage is greatly enhanced by including scenes over low clouds, particularly enabling data over oceans as the albedo of water in the SWIR spectral range is too low to retrieve under cloud-free conditions. The new dataset is validated against co-located ground-based Fourier transform infrared (FTIR) observations by the Total Carbon Column Observing Network (TCCON). The median bias for clear-sky scenes is 1.4×10²¹ molec cm−2 (2.9 %) in H2O columns and 1.1×10¹⁷ molec cm−2 (−0.3 %) in HDO columns, which corresponds to −17 ‰ (9.9 %) in a posteriori δD. The bias for cloudy scenes is 4.9×10²¹ molec cm−2 (11 %) in H2O, 1.1×10¹⁸ molec cm−2 (7.9 %) in HDO, and −20 ‰ (9.7 %) in a posteriori δD. At low-altitude stations, the bias is small at low and middle latitudes and has a larger value at high latitudes. At high-altitude stations, an altitude correction is required to compensate for different partial columns seen by the station and the satellite. The bias in a posteriori δD after altitude correction depends on sensitivity due to shielding by clouds and on realistic a priori profile shapes for both isotopologues. Cloudy scenes generally involve low sensitivity below the clouds, and since the information is filled up by the prior, a realistic shape of the prior is important for realistic total column estimation in these cases. Over oceans, aircraft measurements with the Water Isotope System for Precipitation and Entrainment Research (WISPER) instrument from a field campaign in 2018 are used for validation, yielding biases of −3.9 % in H2O and −3 ‰ in δD over clouds. To demonstrate the added value of the new dataset, a short case study of a cold air outbreak over the Atlantic Ocean in January 2020 is presented, showing the daily evolution of the event with single-overpass results.
Abstract. The thermal infrared nadir spectra of IASI (Infrared Atmospheric Sounding Interferometer) are successfully used for retrievals of different atmospheric trace gas profiles. However, these retrievals offer generally reduced information about the lowermost tropospheric layer due to the lack of thermal contrast close to the surface. Spectra of scattered solar radiation observed in the near-infrared and/or shortwave infrared, for instance by TROPOMI (TROPOspheric Monitoring Instrument), offer higher sensitivity near the ground and are used for the retrieval of total-column-averaged mixing ratios of a variety of atmospheric trace gases. Here we present a method for the synergetic use of IASI profile and TROPOMI total-column level 2 retrieval products. Our method uses the output of the individual retrievals and consists of linear algebra a posteriori calculations (i.e. calculation after the individual retrievals). We show that this approach has strong theoretical similarities to applying the spectra of the different sensors together in a single retrieval procedure but with the substantial advantage of being applicable to data generated with different individual retrieval processors, of being very time efficient, and of directly benefiting from the high quality and most recent improvements of the individual retrieval processors. We demonstrate the method exemplarily for atmospheric methane (CH4). We perform a theoretical evaluation and show that the a posteriori combination method yields a total-column-averaged CH4 product (XCH4) that conserves the good sensitivity of the corresponding TROPOMI product while merging it with the high-quality upper troposphere–lower stratosphere (UTLS) CH4 partial-column information of the corresponding IASI product. As a consequence, the combined product offers additional sensitivity for the tropospheric CH4 partial column, which is not provided by the individual TROPOMI nor the individual IASI product. The theoretically predicted synergetic effect is verified by comparisons to CH4 reference data obtained from collocated XCH4 measurements at 14 globally distributed TCCON (Total Carbon Column Observing Network) stations, CH4 profile measurements made by 36 individual AirCore soundings, and tropospheric CH4 data derived from continuous ground-based in situ observations made at two nearby Global Atmospheric Watch (GAW) mountain stations. The comparisons clearly demonstrate that the combined product can reliably detect the actual variations of atmospheric XCH4, CH4 in the UTLS, and CH4 in the troposphere. A similar good reliability for the latter is not achievable by the individual TROPOMI and IASI products.
 Tobias Borsdorff合作论文数SRON Netherlands Institute for Space Research47
 Jochen Landgraf合作论文数29I. Aben合作论文数19
 Joannes D. Maasakkers合作论文数SRON Netherlands Institute for Space Research18
 Otto Hasekamp合作论文数SRON Netherlands Institute for Space Research18
 Klaas Folkert Boersma合作论文数Meteorological and Air Quality department, Wageningen University18
 Andreas Richter合作论文数Institute of Environmental Physics, University of Bremen16
 Henk Eskes合作论文数Department of Climate Research, Koninklijk Nederlands Meteorologisch Instituut;Royal Netherlands Meteorological Institute16Joost aan de Brugh合作论文数14
 Andre Butz合作论文数Institute of Environmental Physics, Heidelberg University;Department of Physics and Astronomy, Heidelberg University;Heidelberg Center for the Environment, Heidelberg University14
 Isabelle De Smedt合作论文数Division of Atmospheric Composition, Royal Belgian Institute for Space Aeronomy14
 Michel Van Roozendael合作论文数UV-Visible DOAS Research Group, Belgian Institute for Space Aeronomy13
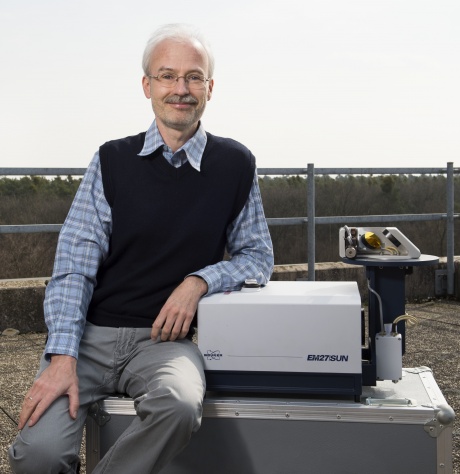 Frank Hase合作论文数Forschungszentrum Karlsruhe13Steffen Beirle合作论文数13
 Mahesh Kumar Sha合作论文数Royal Belgian Inst Space Aeron BIRA IASB12
 Sudhanshu Pandey合作论文数Inst Marine & Atmospher Res Utrecht IMAU, Utrecht, Netherlands11
 Daniel J. Varon合作论文数Sch Engn & Appl Sci, Harvard Univ11Thomas Wagner合作论文数Max Planck Institute For Chemistry11
 Rigel Kivi合作论文数Greenhouse Gases and Satellite Methods group, Finnish Meteorological Institute11Bavo Langerock合作论文数10
 Mark Omara合作论文数Center for Air Resources Engineering and Science, Clarkson University10
 Ritesh Gautam合作论文数Center for Earth Observing and Space Research;George Mason University;Center for Earth Observing and Space Research, George Mason University10
 Sander Houweling合作论文数Faculty of Science, Vrije Universiteit Amsterdam;Utrecht University;SRON Netherlands Institute for Space Research;Institute for Marine and Atmospheric Research Utrecht10Hannah Nesser合作论文数9
 Melissa Sulprizio合作论文数Harvard University, Harvard University9
 Daniel Jacob合作论文数John A. Paulson School of Engineering and Applied Sciences, Harvard University;Department of Earth & Planetary Sciences, Harvard University9
 Jos van Geffen合作论文数8
 Lu Shen合作论文数8
 Xiao Lu (卢骁)合作论文数School of Atmospheric Sciences, Sun Yat-Sen University8Enno Peters合作论文数8Zhen Qu (曲贞)合作论文数Peking University International Hospital8
 Qiansi Tu (涂倩思)合作论文数School of Mechanical Engineering, Tongji University7
 Zichong Chen合作论文数School of Engineering and Applied Sciences, Harvard University7Andreas Schneider合作论文数7
 Hugo Denier Van Der Gon合作论文数TNO7
 Debra Wunch合作论文数Division of Geological and Planetary Sciences, California Institute of Technology7
 Jean-Christopher Lambert合作论文数7Steven Compernolle合作论文数7
 Gaia Pinardi合作论文数Faculty of Medicine, University of Chile7Bruno Rino合作论文数6Sander Niemeijer合作论文数6
 Arno Keppens合作论文数Catholic University College Gent, Catholic University College Gent6Thomas Blumenstock合作论文数Institute of Meteorology and Climate Research, Karlsruhe Institute of Technology6
 François Hendrick合作论文数Belgium Institute for Space Aeronomy6Pauli Heikkinen合作论文数6
 Tijl Verhoelst合作论文数Instituut voor Sterrenkunde, K. U. Leuven6Robert Parker合作论文数Space Research Centre, University of Leicester6Darko Dubravica合作论文数5
 Itziar Irakulis-Loitxate合作论文数Res Inst Water & Environm Engn IIAMA, Univ Politecn Valencia UPV5




