Atmospheric methane (CH 4 ) is a potent greenhouse gas, and its mole fraction has more than doubled since the preindustrial era 1 . Fossil fuel extraction and use are among the largest anthropogenic sources of CH 4 emissions, but the precise magnitude of these contributions is a subject of debate 2 , 3 . Carbon-14 in CH 4 ( 14 CH 4 ) can be used to distinguish between fossil ( 14 C-free) CH 4 emissions and contemporaneous biogenic sources; however, poorly constrained direct 14 CH 4 emissions from nuclear reactors have complicated this approach since the middle of the 20th century 4 , 5 . Moreover, the partitioning of total fossil CH 4 emissions (presently 172 to 195 teragrams CH 4 per year) 2 , 3 between anthropogenic and natural geological sources (such as seeps and mud volcanoes) is under debate; emission inventories suggest that the latter account for about 40 to 60 teragrams CH 4 per year 6 , 7 . Geological emissions were less than 15.4 teragrams CH 4 per year at the end of the Pleistocene, about 11,600 years ago 8 , but that period is an imperfect analogue for present-day emissions owing to the large terrestrial ice sheet cover, lower sea level and extensive permafrost. Here we use preindustrial-era ice core 14 CH 4 measurements to show that natural geological CH 4 emissions to the atmosphere were about 1.6 teragrams CH 4 per year, with a maximum of 5.4 teragrams CH 4 per year (95 per cent confidence limit)—an order of magnitude lower than the currently used estimates. This result indicates that anthropogenic fossil CH 4 emissions are underestimated by about 38 to 58 teragrams CH 4 per year, or about 25 to 40 per cent of recent estimates. Our record highlights the human impact on the atmosphere and climate, provides a firm target for inventories of the global CH 4 budget, and will help to inform strategies for targeted emission reductions 9 , 10 .
Permafrost and methane hydrates are large, climate-sensitive old carbon reservoirs that have the potential to emit large quantities of methane, a potent greenhouse gas, as the Earth continues to warm. We present ice core isotopic measurements of methane (Δ14C, δ13C, and δD) from the last deglaciation, which is a partial analog for modern warming. Our results show that methane emissions from old carbon reservoirs in response to deglacial warming were small (<19 teragrams of methane per year, 95% confidence interval) and argue against similar methane emissions in response to future warming. Our results also indicate that methane emissions from biomass burning in the pre-Industrial Holocene were 22 to 56 teragrams of methane per year (95% confidence interval), which is comparable to today.
. Perfluorocarbons (PFCs) are amongst the most potent greenhouse gases listed under the United Nations Framework Convention on Climate Change (UNFCCC). With atmospheric lifetimes on the order of thousands to tens of thousands of years, PFC emissions represent a permanent alteration to the global atmosphere on human timescales. While the industries responsible for the vast majority of these emissions – aluminium smelting measurements are in conjunction with an inverse modelling framework, to emissions for We compare our maps the and which a of PFC Finally, we explore potential of using one such PFC-emitting as a a tracer
We have developed a chemical mechanism describing the tropospheric degradation of chlorine containing very short-lived substances (VSLS). The scheme was included in a global atmospheric model and used to quantify the stratospheric injection of chlorine from anthropogenic VSLS between 2005 and 2013. By constraining the model with surface measurements of chloroform (CHCl3), dichloromethane (CH2Cl2), tetrachloroethene (C2Cl4), trichloroethene (C2HCl3), and 1,2-dichloroethane (CH2ClCH2Cl), we infer a 2013 mml:msubsup mixing ratio of 123 parts per trillion (ppt). Stratospheric injection of source gases dominates this supply, accounting for approximate to 83% of the total. The remainder comes from VSLS-derived organic products, phosgene (COCl2, 7%) and formyl chloride (CHClO, 2%), and also hydrogen chloride (HCl, 8%). Stratospheric increased by approximate to 52% between 2005 and 2013, with a mean growth rate of 3.7pptCl/yr. This increase is due to recent and ongoing growth in anthropogenic CH(2)Cl(2)the most abundant chlorinated VSLS not controlled by the Montreal Protocol.
HFC-23 (also known as CHF3, fluoroform or trifluoromethane) is a potent greenhouse gas (GHG), with a global warming potential (GWP) of 14 800 for a 100-year time horizon. It is an unavoidable by-product of HCFC-22 (CHClF2, chlorodifluoromethane) production. HCFC-22, an ozone depleting substance (ODS), is used extensively in commercial refrigeration and air conditioning, in the extruded polystyrene (XPS) foam industries (dispersive applications) and also as a feedstock in fluoropolymer manufacture (a non-dispersive use). Aside from small markets in specialty uses, HFC-23 has historically been considered a waste gas that was, and often still is, simply vented to the atmosphere. Efforts have been made in the past two decades to reduce HFC-23 emissions, including destruction (incineration) in facilities in developing countries under the United Nations Framework Convention on Climate Change's (UNFCCC) Clean Development Mechanism (CDM), and by process optimization and/or voluntary incineration by most producers in developed countries. We present observations of lower-tropospheric mole fractions of HFC-23 measured by "Medusa" GC/MSD instruments from ambient air sampled in situ at the Advanced Global Atmospheric Gases Experiment (AGAGE) network of five remote sites (2007–2009) and in Cape Grim air archive (CGAA) samples (1978–2009) from Tasmania, Australia. These observations are used with the AGAGE 2-D atmospheric 12-box model and an inverse method to produce model mole fractions and a "top-down" HFC-23 emission history. The model 2009 annual mean global lower-tropospheric background abundance is 22.6 (±0.2) pmol mol−1. The derived HFC-23 emissions show a "plateau" during 1997–2003, followed by a rapid ~50% increase to a peak of 15.0 (+1.3/−1.2) Gg/yr in 2006. Following this peak, emissions of HFC-23 declined rapidly to 8.6 (+0.9/−1.0) Gg/yr in 2009, the lowest annual emission of the past 15 years. We derive a 1990–2008 "bottom-up" HFC-23 emission history using data from the United Nations Environment Programme and the UNFCCC. Comparison with the top-down HFC-23 emission history shows agreement within the stated uncertainties. In the 1990s, HFC-23 emissions from developed countries dominated all other sources, then began to decline and eventually became fairly constant during 2003–2008. By this point, with developed countries' emissions essentially at a plateau, the major factor controlling the annual dynamics of global HFC-23 emissions became the historical rise of developing countries' HCFC-22 dispersive use production, which peaked in 2007. Thereafter in 2007–2009, incineration through CDM projects became a larger factor, reducing global HFC-23 emissions despite rapidly rising HCFC-22 feedstock production in developing countries.
[1] In the paper ‘‘Sulfuryl fluoride in the global atmosphere’’ by J. Muhle et al. (Journal of Geophysical Research, 114, D05306, doi:10.1029/2008JD011162, 2009), the final two coauthors were omitted. P. B. Krummel and L. P. Steele are affiliated with Centre for Australian Weather and Climate Research, CSIRO Marine and Atmospheric Research, Aspendale, Victoria, Australia. JOURNAL OF GEOPHYSICAL RESEARCH, VOL. 114, D10303, doi:10.1029/2009JD012306, 2009
The hydroxyl free radical (OH) is the major oxidizing chemical in the atmosphere, destroying about 3.7 petagrams (Pg) of trace gases each year, including many gases involved in ozone depletion, the greenhouse effect and urban air pollution. Measurements of 1,1,1‐trichloroethane (methyl chloroform, CH3CCl3), which reacts with OH, provide the most accurate method currently utilized for determining the global behavior of OH. We report that CH3CCl3 levels rose steadily from 1978 to reach a maximum in 1992 and have since decreased rapidly to levels in 2004 about 30% of the levels when measurements began in 1978. Analysis of these observations shows that global average OH levels had a small maximum around 1989 and a larger minimum around 1998, with OH concentrations in 2003 being comparable to those in 1979. This post‐1998 recovery of OH reported here contrasts with the situation 4 years ago when reported OH was decreasing. The 1997–1999 OH minimum coincides with, and is likely caused by, major global wildfires and an intense El Nino event at this time.
The emissions of halogenated gases from the West Coast region of the United States are estimated from measurements from 1995 to 2003 at the Advanced Global Atmospheric Gases Experiment site at Trinidad Head, California. The emissions estimation procedure uses pollution events combined with population densities integrated along back trajectories, and the estimates are constrained by independent estimates of CH 4 and N 2 O emissions from the U.S. West Coast region. The best fit, average emissions of CH 4 and N 2 O and the average chloroform emissions in California, Oregon, and Washington combined from 1996 to 2002 are 44, 3.7, and 0.07 kg person −1 yr −1 , respectively. The emissions per person of CFC‐11 (CCl 3 F), CFC‐12 (CCl 2 F 2 ), CFC‐113 (CCl 2 FCClF 2 ), and methyl chloroform (CH 3 CCl 3 ) from California in 1996–1998 are calculated to be factors of approximately 2.2, 1.3, 0.7, and 1.6, respectively, less (more for CFC‐113) than those reported for the northeastern United States by Barnes et al. (2003). The emission per person of all these gases in the U.S. West Coast region decreased from 1998 to 1999 by a factor of 2 or more, but from 1999 to 2002 the estimated emissions of all four gases have remained fairly constant and are 0.016, 0.048, 0.002, and 0.006 kg person −1 yr −1 , respectively. The methyl chloroform estimates suggest a delay of up to 1 year in the decline of the emissions from 1996 to 1998, but otherwise, and in 1999–2000, in contrast to the Millet and Goldstein (2004) results, they are in agreement with the average methyl chloroform emissions per person for the United States based on the UNEP country by country consumption figures (A. McCulloch, private communication, 2004). Averaging the Trinidad Head and the Barnes et al. (2003) per person estimates and multiplying by the U.S. population suggests average methyl chloroform emissions in the United States of 18 Gg yr −1 in 1996 to 1998. In 2001–2002, if the ratio of the emissions per person in these two regions was the same as in 1996–1998, we estimate U.S. emissions of 2.2 Gg yr −1 , which is one half of the Millet and Goldstein (2004) estimate.
Abstract Improved monitoring of non-CO2 greenhouse gases in air samples is presented, achieved using a new analytical system based on preconcentration, gas-chromatography and mass spectrometry. In addition to the major HFCs, HCFCs and CFCs, the new observations include the first in situ time series of the C1–C3 PFCs (CF4, C2F6 and C3F8) and the more volatile of the HFCs (CHF3, CH2F2, CH3CF3) alongside SF6, all of which are now monitored routinely as part of the Advanced Global Atmospheric Gases Experiment (AGAGE). Observed trends in newly monitored species are shown, obtained from 1–2 years continuous in situ air analyses at remote monitoring sites at Mace Head (Ireland) and Cape Grim (Australia). Observed deviations in the air background for these gas species are linked to modelled trajectories of air masses arriving at the monitoring stations to indicate potential source regions for emissions in Europe and Australia. In addition, preliminary estimates of 2004 mixing ratio growth rates of compounds are deduced from the observations, which highlight the importance of continuous atmospheric monitoring for verification of consumption-based emission estimates of non-CO2 greenhouse gases.
Improved monitoring of non-CO2 greenhouse gases in air samples is presented, achieved using a new analytical system based on preconcentration, gas-chromatography and mass spectrometry. In addition to the major HFCs, HCFCs and CFCs, the new observations include the first in situ time series of the C1–C3 PFCs (CF4, C2F6 and C3F8) and the more volatile of the HFCs (CHF3, CH2F2, CH3CF3) alongside SF6, all of which are now monitored routinely as part of the Advanced Global Atmospheric Gases Experiment (AGAGE). Observed trends in newly monitored species are shown, obtained from 1–2 years continuous in situ air analyses at remote monitoring sites at Mace Head (Ireland) and Cape Grim (Australia). Observed deviations in the air background for these gas species are linked to modelled trajectories of air masses arriving at the monitoring stations to indicate potential source regions for emissions in Europe and Australia. In addition, preliminary estimates of 2004 mixing ratio growth rates of compounds are deduced from the observations, which highlight the importance of continuous atmospheric monitoring for verification of consumption-based emission estimates of non-CO2 greenhouse gases.
The hydroxyl radical (OH) is the dominant oxidizing chemical in the atmosphere. It destroys most air pollutants and many gases involved in ozone depletion and the greenhouse effect. Global measurements of 1,1,1-trichloroethane (CH3CCl3, methyl chloroform) provide an accurate method for determining the global and hemispheric behavior of OH. Measurements show that CH3CCl3 levels rose steadily from 1978 to reach a maximum in 1992 and then decreased rapidly to levels in 2000 that were lower than the levels when measurements began in 1978. Analysis of these observations shows that global OH levels were growing between 1978 and 1988, but the growth rate was decreasing at a rate of 0.23 +/- 0.18% year(-2), so that OH levels began declining after 1988. Overall, the global average OH trend between 1978 and 2000 was -0.64 +/- 0.60% year(-1). These variations imply important and unexpected gaps in current understanding of the capability of the atmosphere to cleanse itself.
We describe in detail the instrumentation and calibrations used in the Atmospheric Lifetime Experiment (ALE), the Global Atmospheric Cases Experiment (GAGE), and the Advanced Global Atmospheric Gases Experiment (AGAGE) and present a history of the majority of the anthropogenic ozone-depleting and climate-forcing gases in air based on these experiments. Beginning in 1978, these three successive automated high-frequency in situ experiments have documented the long-term behavior of the measured concentrations of these gases over the past 20 years, and show both the evolution of latitudinal gradients and the high-frequency variability due to sources and circulation. We provide estimates of the long-term trends in total chlorine contained in long-lived halocarbons involved in ozone depletion. We summarize interpretations of these measurements using inverse methods to determine trace gas lifetimes and emissions. Finally, we provide a combined observational and modeled reconstruction of the evolution of chlorocarbons by latitude in the atmosphere over the past 60 years which can be used as boundary conditions for interpreting trapped air in glaciers and oceanic measurements of chlorocarbon tracers of the deep oceanic circulation. Some specific conclusions are as follows: (1) International compliance with the Montreal Protocol is so far resulting in chlorofluorocarbon and chlorocarbon mole fractions comparable to target levels; (2) mole fractions of total chlorine contained in long-lived halocarbons (CCl2F2, CCl3F, CH3CCl3, CCl4, CHClF2, CCl2FCClF2, CH3Cl, CH2Cl2, CHCl3, CCl2=CCl2) in the lower troposphere reached maximum values of about 3.6 ppb in 1993 and are beginning to slowly decrease in the global lower atmosphere; (3) the chlorofluorocarbons have atmospheric lifetimes consistent with destruction in the stratosphere being their principal removal mechanism; (4) multiannual variations in chlorofluorocarbon and chlorocarbon emissions deduced from ALE/GAGE/AGAGE data are consistent approximately with variations estimated independently from industrial production and sales data where available (CCl2F2 (CFC-12) and CCl2FCClF2 (CFC-113) show the greatest discrepancies); (5) the mole fractions of the hydrochlorofluorocarbons and hydrofluorocarbons, which are replacing the regulated halocarbons, are rising very rapidly in the atmosphere, but with the exception of the much longer manufactured CHClF2 (HCFC-22), they are not yet at levels sufficient to contribute significantly to atmospheric chlorine loading. These replacement species could in the future provide independent estimates of the global weighted-average OH concentration provided their industrial emissions are accurately documented; (6) in the future, analysis of pollution events measured using high-frequency in situ measurements of chlorofluorocarbons and their replacements may enable emission estimates at the regional level, which, together with industrial end-use data, are of sufficient accuracy to he capable of identifying regional noncompliance with the Montreal Protocol.
The current assumptions about the distributions of biogenic and biomass burning emissions of CH3Cl within each region are based on significant prior knowledge and are as reasonable as available. Also, because we use monthly average observations that largely omit pollution events in our inversion, our large-scale regional emission estimates are not readily biased, for example, by errors in the distribution of emissions at grid points close to observing stations that produce these pollution events. Text has been added in Sect. 6 to address this point. If we had a reasonable basis to justify alternative distributions we could run the inversion again with those; but that is not the case.
 Ray Weiss合作论文数Scripps Institution of Oceanography, University of California San Diego8
 S. O'Doherty合作论文数7P. Salameh合作论文数7
 Ronald G. Prinn合作论文数Department of Earth, Atmospheric and Planetary Sciences, School of Science, Massachusetts Institute of Technology;Center for Global Change Science, Massachusetts Institute of Technology6
 John B. Miller合作论文数Cooperative Institute for Research in Environmental Science, University of Colorado Boulder;Global Monitoring Laboratory, National Oceanic & Atmospheric Administration6
 Paul Fraser合作论文数Climate Science Centre, Oceans and Atmosphere, Commonwealth Scientific and Industrial Research Organization6
 Peter G. Simmonds (Peter Simmonds)合作论文数Atmospheric Chemistry Research Group, University of Bristol;School of Chemistry, University of Bristol6Matthew Rigby合作论文数5
 Paul Krummel合作论文数Commonwealth Scientific and Industrial Research Organisation5R. H. J. Wang合作论文数4Paul Steele合作论文数CSIRO4
 Jens Mühle合作论文数Scripps Institution of Oceanography, University of California, San Diego4Archie Mcculloch合作论文数Atmospheric Chemistry Research Group, University of Bristol4Michael Dyonisius合作论文数3M. Leist合作论文数3Isaac J. Vimont合作论文数3
 benjamin hmiel合作论文数Department of Chemistry and Biochemistry, University of Delaware, Newark, DL 19716, USA3
 Jeffrey Severinghaus合作论文数Geosciences Research Division, Scripps Institution of Oceanography, University of California, San Diego3Lambert J M Kuijpers合作论文数3A B. R. Greally合作论文数3A. McCulloch合作论文数2J. Huang合作论文数2B Yang合作论文数2
 Diane J. Ivy合作论文数Department of Earth, Atmospheric, and Planetary Sciences, Massachusetts Institute of Technology2
 Ed Brook合作论文数College of Earth Ocean, and Atmospheric Sciences, Oregon State University2
 David Etheridge合作论文数Division of Atmospheric Research;Industrial Research Organization;Division of Atmospheric Research, Industrial Research Organization2
 Philip F. Place合作论文数2A.M. Smith合作论文数2J. Mühle合作论文数2
 Tim Arnold合作论文数Scripps Institution of Oceanography, University of California2Derek M. Cunnold合作论文数2
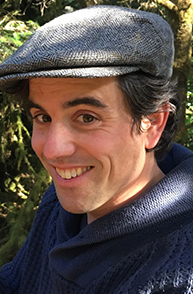 Christo Buizert合作论文数College of Earth, Ocean, and Atmospheric Sciences, Oregon State University2
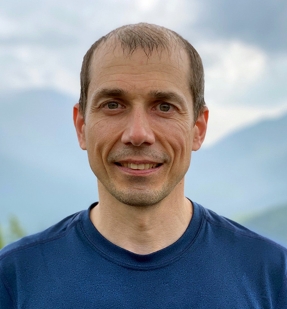 Vasilii Petrenko合作论文数Ice Core and Atmospheric Chemistry Lab, Department of Earth and Environmental Sciences, School of Arts & Sciences, University of Rochester2
 Quan Hua合作论文数Physics Division;Private Mail Bag;Physics Division|Private Mail Bag2M. Baasandorj合作论文数2D. E. Hartley合作论文数1C. Lunder合作论文数1B. L. Dunse合作论文数1J. Muehle合作论文数1L. W. Porter合作论文数1
 j a menking合作论文数1Sylvia Englund Michel合作论文数1
 Sarah Shackleton合作论文数Scripps Inst Oceanog, Univ Calif San Diego1Daniel Baggenstos合作论文数Scripps Institution of Oceanography, University of California;Scripps Institution of Oceanography, University of California1
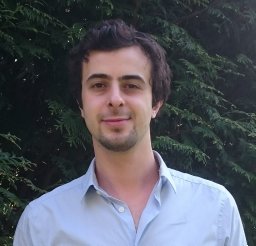 Hossaini Ryan合作论文数⊥School of Earth and Environment, University of Leeds1
 Hubertus Fischer合作论文数Physics Institute, Faculty of Science, University of Bern1Sperlich P合作论文数1
 W. Feng合作论文数Institute for Atmospheric Science;School of Earth and Environment;University of Leeds;School of Earth and Environment, University of Leeds1




