Abstract As large wildfires become more frequent and severe in North America due to heightened fuel aridity and fire weather conditions driven by anthropogenic climate change, wildfire smoke has an increasingly important influence on air quality. Transported smoke can impact urban boundary layer ozone (O 3 ) directly, via the entrainment of O 3 formed in smoke, or indirectly, through the influence of pyrogenic volatile organic compounds (VOCs) and aerosols on local O 3 production. Widespread smoke impacts from the record‐breaking 2023 Canadian wildfire season coincided with the July–August 2023 Airborne Emissions and Reactions Observed from Megacities to Marine Areas (AEROMMA) aircraft‐based field campaign, which provided extensive in situ observations of urban chemistry in North American megacities. Vertically resolved trace gas and aerosol measurements from the August 2 AEROMMA research flight in Chicago indicated the entrainment of diffuse smoke from an aged, lofted wildfire plume into the urban boundary layer and were used to constrain a zero‐dimensional photochemical model and a radiative transfer model. We perturbed the models across a range of smoke densities and urban nitrogen oxide emissions and found net pyrogenic O 3 enhancements of 3–17 ppbv, with the largest contribution from transported smoke O 3 (65%–84%), followed by locally produced photochemical O 3 from smoke VOCs (18%–46%), and finally smoke aerosol shading (−12%–0%). Although these results are specific to the observed August 2 smoke plume and Chicago urban chemistry, the modeling framework presented could be applied to other smoke‐impacted locations to disentangle the various effects of wildfire smoke on urban O 3 .
Abstract Despite the importance of turbulence measurements to atmospheric dynamics and modeling, developing objective, accurate schemes to estimate TKE dissipation ε from velocity time‐series has proven elusive. Objective schemes can be automated, as needed for large data sets generated by today's field programs. But a survey of many such schemes showed that reported approaches are either subjective or rely on assumptions often violated in the real‐world atmosphere. An objective scheme using the compensated structure function is presented, estimating ε and the timescale limits of the turbulence inertial subrange. The procedure is tested using daytime sonic‐anemometer data from Boulder's 300‐m tower. Dissipation profiles were decreasing or nearly constant with height as characteristic of the upper part of unstable surface layers, and magnitudes of 10 −3 –10 −2 m 2 s −3 are also typical of the lower unstable ABL. Results show that, for the midday periods analyzed, a significant fraction of the time‐series variance resides at nonturbulent scales.
Biomass burning emits large quantities of ozone precursors, nitrogen oxides (NOx) and volatile organic compounds (VOCs), to the lower atmosphere. Recent analysis of ozone and tracers for biomass burning and urban emissions in the remote atmosphere shows that a larger fraction of tropospheric ozone may be attributable to biomass burning than global models predict. At continental and regional scales, increasing trends in biomass burning emissions in North America are associated with enhanced ozone in U.S. cities. Ozone production within smoke plumes leads to enhanced regional scale backgrounds, while interaction of aged smoke with urban NOx pollution may lead to increased rates of ozone production depending on the local NOx sensitivity regime. Several recent airborne and ground-based field studies have investigated ozone in biomass burning influenced air. The 2016-2018 Atmospheric Tomography Mission (ATom) sampled remote tropospheric biomass burning influence. The 2019 Fire Influence on Regional to Global Environments and Air Quality (FIREX-AQ) sampled wildfire smoke across the U.S. with multiple research aircraft. The 2022 California Fire Dynamics Experiment (CalFiDE) conducted focused in-situ and remote sensing measurements in California and Oregon. Ground-based measurements in Boulder, Colorado intercepted periods of smoke influence in the Northern Front Range urban area in 2020 and 2021. Finally, the 2023 Atmospheric Emissions and Reactivity Observed from Megacities to Marine Areas (AEROMMA) campaign on the NASA DC-8 and the Coastal Urban Plume Dynamics Study (CUPiDS) on the NOAA Twin Otter observed long range smoke transported to U.S. urban areas and the associated impacts on ozone. These studies provide a comprehensive analysis of the biomass burning influence on tropospheric ozone at all scales, from near field plume chemistry to the global remote troposphere, and from the continental background to local urban influence.
Surface ozone (O 3 ) mixing ratios exceeding the National Ambient Air Quality Standard were measured at rural monitors along the Colorado Front Range on 17 April 2020 during the COVID‐19 lockdown. This unusual episode followed back‐to‐back upslope snowstorms and coincided with the presence of a deep stratospheric intrusion, but ground‐based lidar and ozonesonde measurements show that little, if any, of the O 3 ‐rich lower stratospheric air reached the surface. Instead, the statically stable lower stratospheric air suppressed the growth of the daytime boundary layer and trapped nitrogen oxides (NO x = NO + NO 2 ) and volatile organic compounds (VOCs) emitted by motor vehicles and oil and natural gas (O&NG) operations near the ground where the clear skies and extensive snow cover triggered a short‐lived photochemical episode similar to those observed in the O&NG producing basins of northeastern Utah and southwestern Wyoming. In this study, we use a combination of lidar, ozonesonde, and surface measurements, together with the WRF‐Chem and Goddard Earth Observing System composition forecast models, to describe the stratospheric intrusion and characterize the boundary layer structure, HYSPLIT back trajectories to show the low‐level transport of O 3 and its precursors to the exceedance sites, and surface measurements of NO x and VOCs together with a 0‐D box model to investigate the roles of urban and O&NG emissions and the COVID‐19 quarantine in the O 3 production. The box model showed the O 3 production to be NO x saturated, such that the NO x reductions associated with COVID‐19 exacerbated the event rather than mitigating it.
The Tropospheric Ozone Lidar Network (TOLNet) was used to validate retrievals of ozone (O3) profiles in the troposphere from the TROPOspheric Monitoring Instrument (TROPOMI) ultraviolet (UV), Cross-track Infrared Sounder (CrIS) infrared (IR), and a combined UV + IR wavelength retrieval from TROPOMI/CrIS. Observations from six separate ground-based lidar systems and various locations of ozonesondes distributed throughout North America and in the Netherlands were used to quantify systematic bias and random errors for each satellite retrieval. Furthermore, TOLNet data were used to intercompare idealized UV, IR, and UV + IR convolved lidar profiles of O3 in the troposphere during case studies representative of high-O3 events. This study shows that the improved sensitivity and vertical resolution in UV + IR retrievals in the middle- and upper-troposphere resulted in tropospheric degree of freedom (DOF) values ∼ 33 % higher compared to UV- and IR-only retrievals. The increased DOFs in the UV + IR retrievals allowed for improved reproduction of mid- and upper-tropospheric O3 enhancements and, to a lesser degree, near-surface pollution enhancements compared to single-wavelength satellite products. The validation of O3 profiles in the troposphere retrieved with the UV-only, IR-only, and UV + IR Tikhonov regularised Ozone Profile retrievAl with SCIATRAN (TOPAS) algorithm developed at the Institute for Environmental Physics, University of Bremen, demonstrated the utility of using TOLNet as a satellite evaluation data set. TOPAS UV-only, IR-only, and UV + IR wavelength retrievals had systematic biases, quantified with normalized mean bias, throughout the troposphere of 11.2 ppb (22.1 %), −1.7 ppb (−0.3 %), and 3.5 ppb (7.8 %), respectively, which meet the tropospheric systematic bias requirements defined by the science teams for the TROPOMI and CrIS sensors. The primary drivers of systematic bias were determined to be solar zenith angle, surface albedo, and cloud fraction. Random errors, representative of uncertainty in the retrievals and quantified by root mean squared errors (RMSEs), were large for all three retrievals, with UV-only, IR-only, and UV + IR wavelength retrievals having RMSEs throughout the troposphere of 17.4 ppb (19.8 % of mean tropospheric column values), 10.5 ppb (12.6 % of mean tropospheric column values), and 14.0 ppb (14.6 % of mean tropospheric column values), respectively. TOPAS UV-only profiles did not meet the uncertainty requirements defined for TROPOMI for the troposphere; however, CrIS IR-only retrievals did meet the uncertainty requirements defined by this mission. The larger random errors reflect the challenge of retrieving daily O3 profiles due to the limited sensitivity and vertical resolution of these retrievals in the troposphere. Tropospheric systematic biases and random error were lower in IR-only and combined UV + IR retrievals compared to UV-only products due to the increased sensitivity in the troposphere allowing the retrievals to deviate further from the a priori profiles. Observations from TOLNet demonstrated that the performance of the three satellite products varied by season and altitude in the troposphere. TOLNet was shown to result in similar validation statistics compared to ozonesonde data, which are a commonly used satellite evaluation data source, demonstrating that TOLNet is a sufficient source of satellite O3 profile validation data in the troposphere, which is critical as this data source is the primary product identified for the tropospheric O3 validation of the recently launched Tropospheric Emissions: Monitoring of Pollution (TEMPO) mission.
A simultaneous deployment of Doppler, temperature, and water-vapor lidars is able to provide profiles of molecular destruction rates and turbulent kinetic energy (TKE) dissipation in the convective boundary layer (CBL). Horizontal wind profiles and profiles of vertical wind, temperature, and moisture fluctuations are combined, and transversal temporal autocovariance functions (ACFs) are determined for deriving the dissipation and molecular destruction rates. These are fundamental loss terms in the TKE as well as the potential temperature and mixing ratio variance equations. These ACFs are fitted to their theoretical shapes and coefficients in the inertial subrange. Error bars are estimated by a propagation of noise errors. Sophisticated analyses of the ACFs are performed in order to choose the correct range of lags of the fits for fitting their theoretical shapes in the inertial subrange as well as for minimizing systematic errors due to temporal and spatial averaging and micro- and mesoscale circulations. We demonstrate that we achieve very consistent results of the derived profiles of turbulent variables regardless of whether 1 or 10 s time resolutions are used. We also show that the temporal and spatial length scales of the fluctuations in vertical wind, moisture, and potential temperature are similar with a spatial integral scale of ≈160 m at least in the mixed layer (ML). The profiles of the molecular destruction rates show a maximum in the interfacial layer (IL) and reach values of ϵm≃7×10⁻⁴ g2 kg−2 s−1 for mixing ratio and ϵθ≃1.6×10⁻³ K2 s−1 for potential temperature. In contrast, the maximum of the TKE dissipation is reached in the ML and amounts to ≃10-2 m2 s−3. We also demonstrate that the vertical wind ACF coefficient kw∝w′2‾ and the TKE dissipation ϵ∝w′2‾3/2. For the molecular destruction rates, we show that ϵm∝m′2‾w′2‾1/2 and ϵθ∝θ′2‾w′2‾1/2. These equations can be used for parameterizations of ϵ, ϵm, and ϵθ. All noise error bars are derived by error propagation and are small enough to compare the results with previous observations and large-eddy simulations. The results agree well with previous observations but show more detailed structures in the IL. Consequently, the synergy resulting from this new combination of active remote sensors enables the profiling of turbulent variables such as integral scales, variances, TKE dissipation, and the molecular destruction rates as well as deriving relationships between them. The results can be used for the parameterization of turbulent variables, TKE budget analyses, and the verification of large-eddy simulations.
Understanding the complex dynamical interactions that occur during the evolution of a wildland fire still remains a challenge within the research community. Processes such as entrainment, the incident wind field, the interaction between neighboring updrafts, among other processes, motivates the need for more intensive measurement campaigns to determine the mechanisms responsible for the processes observed as wildland fire updrafts evolve. A recent opportunity to examine processes associated with wildland fires was made possible with a Doppler lidar (DL) mounted on a Twin Otter aircraft to measure horizontal and vertical winds during the 2019 Fire Influence on Regional‐to‐Global Environments and Air Quality campaign. Using the data collected, a technique was developed to isolate updrafts over designated hotspots with the intention of statistically analyzing the updraft samples as well as assessing specific cases that underscore the complex dynamical interactions generated by wildland fire behavior. Strong evidence in support of statistically derived relationships between the updraft characteristics and downdraft extrema at the flanks of updrafts are shown using methods developed herein. In addition to the influence of entrainment/detrainment on the updraft structure are features such as updraft displacement and interacting updrafts that could only be resolved by a high along‐ and cross‐beam resolution DL. Lastly, it was found that a high degree of symmetry between profiles to the left and right of core updrafts was preserved for most of the cases, which validates some of the assumptions typically used in idealized updraft formulations.
Increasing trends in biomass burning emissions significantly impact air quality in North America. Enhanced mixing ratios of ozone (O3) in urban areas during smoke-impacted periods occur through transport of O3 produced within the smoke or through mixing of pyrogenic volatile organic compounds (PVOCs) with urban nitrogen oxides (NOx = NO + NO2) to enhance local O3 production. Here, we analyze a set of detailed chemical measurements, including carbon monoxide (CO), NOx, and speciated volatile organic compounds (VOCs), to evaluate the effects of smoke transported from relatively local and long-range fires on O3 measured at a site in Boulder, Colorado, during summer 2020. Relative to the smoke-free period, CO, background O3, OH reactivity, and total VOCs increased during both the local and long-range smoke periods, but NOx mixing ratios remained approximately constant. These observations are consistent with transport of PVOCs (comprised primarily of oxygenates) but not NOx with the smoke and with the influence of O3 produced within the smoke upwind of the urban area. Box-model calculations show that local O3 production during all three periods was in the NOx-sensitive regime. Consequently, this locally produced O3 was similar in all three periods and was relatively insensitive to the increase in PVOCs. However, calculated NOx sensitivities show that PVOCs substantially increase O3 production in the transition and NOx-saturated (VOC-sensitive) regimes. These results suggest that (1) O3 produced during smoke transport is the main driver for O3 increases in NOx-sensitive urban areas and (2) smoke may cause an additional increase in local O3 production in NOx-saturated (VOC-sensitive) urban areas. Additional detailed VOC and NOx measurements in smoke impacted urban areas are necessary to broadly quantify the effects of wildfire smoke on urban O3 and develop effective mitigation strategies.
Normalized mean biases (NMB, in ppb) were calculated with Eq. (S1) = ∑ ( - ) =1 ∑ =1 convolved with the TROPOMI AK (TOLNet-AK), UV, IR, and UV+IR TOPAS satellite retrievals, and the a priori profile information used in the TOPAS retrieval (total number of colocations (N) = 109).The direct comparison of the profiles and percent difference for UV-only (a, c) IR-only (b, d), and UV+IR (e, f) retrievals are displayed, respectively, using the coarser co-location criteria of 5 hour and 100 km.The percent difference between TOPAS satellite retrievals and TOLNet-AK and TOLNet-raw are labeled as TOPAS-TOLNet (AK) and TOPAS-TOLNet (raw), respectively.The percent difference
Ground‐level ozone (O 3 ) was unusually high in northern Colorado in the summer of 2021 with maximum daily 8‐hr average (MDA8) concentrations 6 to 8 parts‐per‐billion by volume (ppbv) higher than in 2019, 2020, or 2022. One or more of the monitors on the Colorado Front Range exceeded the 2015 U.S. National Ambient Air Quality Standard (NAAQS) of 70 ppbv on 66 of the 122 days from 1 June to 30 September, and this record number of exceedances coincided with the near daily presence of dispersed smoke haze from wildfires in Arizona, California, and the Pacific Northwest. In this paper, we use regulatory and non‐regulatory surface O 3 and PM 2.5 measurements in conjunction with ground‐based lidar observations to estimate how much O 3 was associated with the wildfire smoke. Analyses of the surface measurements suggest that pyrogenic O 3 transported to northern Colorado with the smoke increased the surface concentrations in northern Colorado by an average of 8 ppbv in July, 3 ppbv in August, and 2 ppbv in September. Analysis of the lidar measurements showed these contributions to be as large as 12 ppbv on some days. Production of O 3 from reactions of pyrogenic VOCs and locally emitted NO x appears to have been minimal (<3 ppbv) in the Boulder area, but may have been much larger in the suburbs southwest of downtown Denver.
Since there are only a very few suitable measurements, the thermodynamic field of the lower troposphere is mostly still Terra Incognita. To close this gap, we developed a thermodynamic profiler based on the Raman lidar technique. We call this instrument Atmospheric Raman Temperature and Humidity Sounder (ARTHUS) (Lange et al. 2019). ARTHUS can be operated on ground-based, ship-borne and airborne platforms. Due to an advanced design of the transmitter and the receiver, simultaneous profiling of temperature (T) and water-vapor mixing ratio (WVMR) is possible with unprecedented accuracies and resolutions. Typical resolutions are a few seconds and meters in the lower troposphere. With the measurements themselves, also the statistical uncertainties are derived. The design of the system permits measurements in all weather conditions and even in clouds and rain up to an optical thickness of approx. 2. Stable 24/7 operations over long periods were achieved during several field campaigns and at the Land Atmosphere Feedback Observatory (LAFO) accumulating almost a year of data until now and covering a huge variety of weather conditions. During the EUREC4A field campaign (Stevens et al, 2020), for example, ARTHUS was deployed on board RV Maria S Merian, to study ocean-atmosphere interaction, (18 January to 18 February 2020). ARTHUS was combined with one Doppler lidar in vertically staring mode and a second one in a 6-beam scanning mode. Between 15 July and 20 September 2021, ARTHUS was deployed at Lindenberg Observatory from the German Weather Service (DWD). The objective of the campaign was to demonstrate the potential of ARTHUS in the framework of a ground-based measurement campaign and the evaluation of the data obtained. The long-term stability, accuracy and high resolution of ARTHUS during the day and at night were demonstrated. We also demonstrate that ARTHUS is capable of resolving (1) the strength of the inversion layer at the atmospheric boundary layer (ABL) top and thus the ABL depth zi, (2) elevated lids in the free troposphere, and (3) turbulent fluctuations in WVMR and T. In combination with Doppler lidar, the latter permits measurements of sensible and latent heat flux profiles in the convective ABL and thus flux-gradient relationships (Behrendt et al. 2020). Consequently, ARTHUS can be applied for process studies such as land-atmosphere feedback, weather and climate monitoring, model verification, and data assimilation in weather forecast models. At the conference, highlights of the measurements during the last three years will be shown. Stevens et. al. 2021, https://doi.org/10.5194/essd-2021-18 Lange et al. 2019, https://doi.org/10.1029/2019GL085774 Behrendt et al. 2020, https://doi.org/10.5194/amt-13-3221-2020
We demonstrate the combination of three Doppler lidars (DLs), a water vapor differential absorption lidar and a temperature rotational Raman lidar for the investigation of the interactions between the land‐surface and the atmospheric boundary layer. This combination of scanning lidars was operated for the first time during the Land‐Atmosphere Feedback Experiment at the Atmospheric Radiation Measurement program's Southern Great Plain site, Oklahoma, USA, in August 2017, and provided simultaneous surface layer profiles of horizontal wind, humidity and temperature. The horizontal wind profiles were determined using the dual‐Doppler method with two DLs. The scans were performed above four towers providing atmospheric variables and fluxes. These combined lidar data allowed for the estimation of the friction velocity as well as the surface latent and sensible heat fluxes. For this purpose, profiles calculated with Monin‐Obukhov similarity theory were fitted with the Levenberg‐Marquardt nonlinear least squares curve‐fitting method to the measured surface‐layer lidar profiles. We present case studies of three 50‐min periods to illustrate the new method. The measurements resulted in friction velocities of 0.31, 0.29, and 0.38 ms −1 , sensible surface heat fluxes of 312.1, 234.1, and 183.3 Wm −2 and latent surface heat fluxes of 251.8, 227.3, and 274.4 Wm −2 . These values were compared with the in‐situ measurements of the towers. Considering the sampling differences and the error analyses, the results agree within 25.1%, 42.5%, and 28.8%, respectively, demonstrating that this synergy of scanning active remote sensing systems can be used to derive surface fluxes with reasonable accuracy.
The exchange of energy, moisture and momentum between the atmosphere and the land-surface as well as the associated feedback processes are decisive for the development of the planetary boundary layer. Inaccurate representation and parameterization of these processes are a weakness of current weather and climate models. Improvements in these areas will contribute significantly to better simulations of cloud formation on all temporal and spatial scales. This requires simultaneous measurements of the land-atmosphere system in all compartments. Both the LAFE and the new LAFO design with their instrument synergies have already made important contributions to this. With comparisons between model parameterizations and observations, e.g. the applicability of the Monin-Obukhov similarity theory (MOST) in the case of natural heterogeneous land surface can be investigated or new parameterizations can be developed. The Land-Atmosphere Feedback Experiment (LAFE, Wulfmeyer et al., 2018) was performed in August 2017 as a measurement campaign at the Atmospheric Radiation Measurements (ARM) Program Southern Great Plains site in Oklahoma, USA. For boundary layer observations, scanning Doppler lidar systems for wind measurements, rotational Raman lidar for temperature and humidity measurements, and differential absorption lidar for water vapor measurements were setup. At the land-surface, meteorological and plant dynamics variables, energy balance, and soil moisture and temperature were recorded at eddy covariance stations. These measurements are also executed at the Land-Atmosphere Feedback Observatory (LAFO, lafo.uni-hohenheim.de) at the University of Hohenheim in Stuttgart (Germany) to collect long-term time series in addition to field experiments. Here, lidar measurements are operationally operated and complemented by measurements from a Doppler cloud radar. At the land surface we measure with eddy covariance stations and a network of soil moisture and temperature sensors and the vegetation status is recorded in the study area. This sensor synergy in LAFO is prototype for GLAFOs (Gewex LAFOs, Wulfmeyer et al. 2020) to establish these measurements in different climate regions in the world. In this contribution, we present the measurement concept and how observations can be used to study and improve boundary layer and turbulence parameterizations. We demonstrate this with measurement results from LAFE and LAFO with estimates of fluxes determined by combining the moisture, temperature, and wind profiles near the ground, allowing the derivation of appropriate similarity relationships for both entrainment fluxes and MOST. Wulfmeyer et al., 2018, doi: 10.1175/BAMS-D-17-0009.1 Wulfmeyer et al. 2020, GEWEX Quarterly Vol. 30, No. 1.
The Fires, Asian, and Stratospheric Transport–Las Vegas Ozone Study (FAST-LVOS) was conducted in May and June of 2017 to study the transport of ozone (O3) to Clark County, Nevada, a marginal non-attainment area in the southwestern United States (SWUS). This 6-week (20 May–30 June 2017) field campaign used lidar, ozonesonde, aircraft, and in situ measurements in conjunction with a variety of models to characterize the distribution of O3 and related species above southern Nevada and neighboring California and to probe the influence of stratospheric intrusions and wildfires as well as local, regional, and Asian pollution on surface O3 concentrations in the Las Vegas Valley (≈ 900 m above sea level, a.s.l.). In this paper, we describe the FAST-LVOS campaign and present case studies illustrating the influence of different transport processes on background O3 in Clark County and southern Nevada. The companion paper by Zhang et al. (2020) describes the use of the AM4 and GEOS-Chem global models to simulate the measurements and estimate the impacts of transported O3 on surface air quality across the greater southwestern US and Intermountain West. The FAST-LVOS measurements found elevated O3 layers above Las Vegas on more than 75 % (35 of 45) of the sample days and show that entrainment of these layers contributed to mean 8 h average regional background O3 concentrations of 50–55 parts per billion by volume (ppbv), or about 85–95 µg m−3. These high background concentrations constitute 70 %–80 % of the current US National Ambient Air Quality Standard (NAAQS) of 70 ppbv (≈ 120 µg m−3 at 900 m a.s.l.) for the daily maximum 8 h average (MDA8) and will make attainment of the more stringent standards of 60 or 65 ppbv currently being considered extremely difficult in the interior SWUS.
Abstract. The science guiding the EUREC4A campaign and its measurements are presented. EUREC4A comprised roughly five weeks of measurements in the downstream winter trades of the North Atlantic – eastward and south-eastward of Barbados. Through its ability to characterize processes operating across a wide range of scales, EUREC4A marked a turning point in our ability to observationally study factors influencing clouds in the trades, how they will respond to warming, and their link to other components of the earth system, such as upper-ocean processes or, or the life-cycle of particulate matter. This characterization was made possible by thousands (2500) of sondes distributed to measure circulations on meso (200 km) and larger (500 km) scales, roughly four hundred hours of flight time by four heavily instrumented research aircraft, four global-ocean class research vessels, an advanced ground-based cloud observatory, a flotilla of autonomous or tethered measurement devices operating in the upper ocean (nearly 10000 profiles), lower atmosphere (continuous profiling), and along the air-sea interface, a network of water stable isotopologue measurements, complemented by special programmes of satellite remote sensing and modeling with a new generation of weather/climate models. In addition to providing an outline of the novel measurements and their composition into a unified and coordinated campaign, the six distinct scientific facets that EUREC4A explored – from Brazil Ring Current Eddies to turbulence induced clustering of cloud droplets and its influence on warm-rain formation – are presented along with an overview EUREC4A's outreach activities, environmental impact, and guidelines for scientific practice.
Der Austausch von Energie, Feuchte und Impuls zwischen der Atmosphäre und der Landoberfläche sowie die damit verbundenen Rückkopplungsprozesse sind maßgeblich für die Entwicklung der planetarischen Grenzschicht. Eine ungenaue Darstellung und Parametrisierung dieser Prozesse stellen eine Schwäche der heutigen Wetter- und Klimamodelle dar. Verbesserungen in diesen Bereichen werden einen signifikanten Beitrag zu besseren Simulationen der Wolkenbildung auf allen zeitlichen und räumlichen Skalen leisten. Dazu ist es notwendig, das System Land-Atmosphäre simultan in allen Kompartimenten zu vermessen. Dazu haben sowohl das LAFE- als auch das neue LAFO-Design mit deren Messgerätesynergien schon wichtige Beiträge geliefert. Mit Vergleichen zwischen Modellparametrisierungen und Beobachtungen können z.B. die Anwendbarkeit der Monin-Obukhov Ähnlichkeitstheorie (MOST) bei natürlicher heterogener Landoberfläche überprüft oder neue Parametrisierungen entwickelt werden. Das LAFE (Land-Atmosphere Feedback Experiment, Wulfmeyer et al. 2018) wurde im August 2017 als Messkampagne am Standort des Atmospheric Radiation Measurements (ARM) Program Southern Great Plains in Oklahoma, USA, umgesetzt. Für Grenzschichtbeobachtungen kamen scannende Dopplerlidar-Systeme für Windmessungen, Rotations-Ramanlidar für Temperatur- und Feuchtemessungen und Differentielles Absorptionslidar zur Wasserdampfmessung in der Grenzschicht zum Einsatz. An der Landoberfläche wurden meteorologische und pflanzendynamische Variablen, Energiebilanz, sowie Bodenfeuchte und -temperatur an Eddy-Kovarianz-Stationen erfasst. Diese Messungen verfolgen wir auch am Land-Atmosphäre Feedback Observatorium (LAFO, lafo.uni-hohenheim.de) an der Universität Hohenheim in Stuttgart (Deutschland) um neben Feldexperimenten auch lange Zeitreihen zu erfassen. Hier werden Lidarmessungen operationell betrieben und ergänzt durch Messungen eines Doppler-Wolkenradars. An der Landoberfläche messen Eddy-Kovarianz-Stationen und ein Netzwerk von Bodenfeuchte- und -temperatursensoren, sowie wird der Vegetationsstatus im Untersuchungsgebiet erfasst. Diese Sensorsynergie im LAFO ist Prototyp für GLAFOs (Gewex LAFOs, Wulfmeyer et al. 2020) zur Etablierung dieser Messungen in verschiedenen Klimaregionen der Erde. In diesem Beitrag stellen wir das Messkonzept vor und wie Beobachtungen für die Untersuchung und Verbesserung von Grenzschicht- und Turbulenz-Parametrisierungen eingesetzt werden können. Dies zeigen wir mit Messergebnissen von LAFE und LAFO mit Abschätzungen der Flüsse, die durch Kombination der Feuchte-, Temperatur- und Windprofile in Bodennähe bestimmt werden und die Ableitung entsprechenden Ähnlichkeitsbeziehung sowohl für Entrainment-Flüsse als auch für MOST ermöglichen.
Transport of pollution into pristine wilderness areas is of concern for both federal and state agencies. Assessing such transport in complex terrain is a challenge when relying solely on data from standard federal or state air quality monitoring networks because of the sparsity of network monitors beyond urban areas. During the Front Range air quality study, conducted in the summer of 2008 in the vicinity of Denver, CO, research-grade surface air quality data, vertical wind profiles and mixing heights obtained by radar wind profilers, and ozone profile data obtained by an airborne ozone differential absorption lidar augmented the local regulatory monitoring networks. Measurements from this study were taken on 2 successive days at the end of July 2008. On the first day, the prevailing winds were downslope westerly, advecting pollution to the east of the Front Range metropolitan areas. On this day, chemistry measurements at the mountain and foothills surface stations showed seasonal background ozone levels of approximately 55–68 ppbv (nmol mol–1 by volume). The next day, upslope winds prevailed, advecting pollution from the Plains into the Rocky Mountains and across the Continental Divide. Mountain stations measured ozone values greater than 90 ppbv, comparable to, or greater than, nearby urban measurements. The measurements show the progression of the ozone-enriched air into the mountains and tie the westward intrusion into high-elevation mountain sites to the growth of the afternoon boundary layer. Thus, under deep upslope flow conditions, ozone-enriched air can be advected into wilderness areas of the Rocky Mountains. Our findings highlight a process that is likely to be an important ozone transport mechanism in mountainous terrain adjacent to ozone source areas when the right circumstances come together, namely a deep layer of light winds toward a mountain barrier coincident with a deep regional boundary layer.
During the EUREC4A campaign (Bony et al., 2017, Stevens et al, 2020), a unique combination of lidar systems was operated to study ocean-atmosphere interaction on the German research vessel R/V Maria S Merian between 18 January and 18 February 2020. These systems observed the maritime boundary layer (MBL) and its relation to cloud development in the trade wind alley east of Barbados and in the "Boulevard des Tourbillons" east of Venezuela with turbulence resolving resolution. For this purpose, for the first time, the Atmospheric Raman Temperature and Humidity Sounder (ARTHUS) (Lange et al. 2019; Lange et al. this conference) was operated on a shipborne platform in vertically staring mode. This system is capable of measuring water-vapor, temperature, and aerosol profiles with unprecedented resolution of 7.5 m and 10 s in the lower troposphere. ARTHUS was combined with one Doppler lidar in vertically staring mode and a second one in a 6-beam scanning mode. For studying the above mentioned processes, a data set was collected, which includes profiles of water vapor mixing ratio, temperature, relative humidity, vertical and horizontal wind as well as the statistics of higher-order moments of these parameters. Synergetic parameters from the combination of the data are turbulent kinetic energy (TKE), momentum flux, dissipation rate, sensible and latent heat flux profiles (Behrendt et al. 2020). At the conference, highlights of the measurements will be presented which show the dependence of cloud evolution on sea surface temperature and MBL properties as well as the interaction with the trade wind layer. References Behrendt et al. 2020, https://doi.org/10.5194/amt-13-3221-2020 Bony et al. 2017, https://doi.org/10.1007/s10712-017-9428-0 Lange et al. 2019, https://doi.org/10.1029/2019GL085774 Stevens et al. 2020, submitted to ESSD
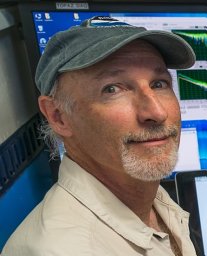 A. O. Langford合作论文数Aeronomy Laboratory, NOAA85
 Robert Banta合作论文数NOAA Chemical Sciences Laboratory66
 R. J. Alvarez合作论文数47Lisa S Darby合作论文数42W. Alan Brewer合作论文数39
 Michael Trainer合作论文数Chemical Sciences Laboratory, National Oceanic and Atmospheric Administration;Earth System Research Laboratory, National Oceanic and Atmospheric Administration37
 Robert Michael Hardesty合作论文数33Scott P. Sandberg合作论文数33Raul J. Alvarez合作论文数33
 Wayne Angevine合作论文数Chemical Sciences Laboratory, Office of Oceanic and Atmospheric Research, National Oceanic and Atmospheric Administration, U.S. Department of Commerce;Cooperative Institute for Research in Environmental Sciences, University of Colorado Boulder30T. B. Ryerson合作论文数27
 Allen B. White合作论文数Physical Sciences Division (PSD), NOAA Earth System Research Laboratory27Richard D. Marchbanks合作论文数26R Michael Hardesty合作论文数26A. M. Weickmann合作论文数25
 Steven Brown合作论文数Chemical Sciences Laboratory, National Oceanic and Atmospheric Administration;College of Arts and Sciences, University of Colorado Boulder23
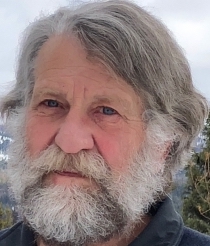 Stuart Mckeen合作论文数Cooperative Institute for Research in Environmental Sciences, University of Colorado;Chemical Sciences Laboratory, National Oceanic and Atmospheric Administration22Sunil Baidar合作论文数21Guillaume Kirgis合作论文数19
 David D. Parrish合作论文数Air Quality Research Center, University of California, Davis;David.D.Parrish, LLC19Eric J. Williams合作论文数18
 Carsten Warneke合作论文数Chemical Sciences Laboratory, National Oceanic and Atmospheric Administration;Earth System Research Laboratory, National Oceanic and Atmospheric Administration16
 Jeff Peischl合作论文数Chemical Sciences Laboratory, National Oceanic and Atmospheric Administration;Institute for Research in Environmental Sciences, University of Colorado Boulder15
 Volker Wulfmeyer合作论文数Institute of Physics and Meteorology, University of Hohenheim;Faculty of Natural Sciences, University of Hohenheim14
 Joost de Gouw合作论文数Cooperative Institute for Research in Environmental Sciences, University of Colorado Boulder;Department of Chemistry, University of Colorado Boulder13Brian M. Lerner合作论文数13Sara C. Tucker合作论文数Cooperat Inst Res Environm Sci, Univ Colorado13
 Jérôme Brioude合作论文数Département Physique, Université de La Réunion13
 John T. Sullivan合作论文数NASA, Goddard Space Flight Center12Andreas Behrendt合作论文数Institut fur Physik und Meteorologie, Universitat Hohenheim12
 Detlev Helmig合作论文数Institute of Arctic and Alpine Research, University of Colorado Boulder12A. Brewer合作论文数11
 Kuang Shi合作论文数Atmospheric Science Department, University of Alabama in Huntsville11
 James MacKenzie Roberts (James M. Roberts)合作论文数Chemical Sciences Division, National Oceanic and Atmospheric Administration11
 Hilke Oetjen合作论文数School of Chemistry;University of Leeds;School of Chemistry, University of Leeds11Gregory J. Frost合作论文数11Späth Florian合作论文数10
 Gilman J B合作论文数Cooperative Institute for Research in Environmental Sciences, University of Colorado10
 C. A. Brock合作论文数University of Denver10
 Thomas J McGee合作论文数10Stephen A. Conley合作论文数10
 Owen R. Cooper合作论文数Aeronomy Laboratory, NOAA10Scott P Sandberg合作论文数10Janet L. Machol合作论文数University of Colorado;Atmospheric Administration;Atmospheric Administration, University of Colorado10
 Rainer Volkamer合作论文数Department of Chemistry, College of Arts and Sciences, University of Colorado Boulder10Timothy A. Berkoff合作论文数NASA Goddard Space Flight Center, University of Maryland Baltimore County10Brandi McCarty合作论文数9
 Diego Lange合作论文数9
 Meiyun Lin合作论文数Cooperative Institute for Modeling the Earth System, Princeton University;NOAA GFDL9




