Supplementary Figure S1 shows independent estimation of circulating tumor DNA fraction using whole exome sequencing.
Supplementary Figure S7 shows the concordance of gene coverage logratios between 72-gene targeted sequencing and whole exome sequencing
<p>Supplementary Figure S17 provides whole exome somatic mutation profiles in patients that did not show temporal changes in 72-gene panel mutation profiles</p>
Supplementary Figure S8 shows that exome-wide sequencing supports ctDNA fraction estimates inferred with the 72-gene panel
Supplementary Figure S13 shows temporal changes in copy number profiles detected via 72-gene targeted sequencing
Supplementary Figure S10 provides Kaplan-Meier plots showing duration of treatment response in patients with different baseline circulating tumor DNA fractions
Supplementary Figure S25 shows concordant identification of intragenic copy number changes inside the androgen receptor (AR) gene based on a coverage-based approach and breakpoint-based approach
Supplementary Figure S24 shows that amplification of the enhancer region 640 kb upstream of the androgen receptor (AR) is common.
Supplementary Figure S12 shows the re-detection rate for somatic mutations identified in an earlier cfDNA sample
Supplementary Figure S14 shows temporal changes in whole exome somatic mutation profiles in patients that had evidence for somatic mutation profile change based on 72-gene targeted sequencing.
<p>Supplementary Figure S17 provides whole exome somatic mutation profiles in patients that did not show temporal changes in 72-gene panel mutation profiles</p>
Supplementary Figure S19 shows the complete switch of circulating tumor DNA profile in patient 026 between baseline and first progression timepoints
Supplementary Figure S20 shows genomic changes in selected prostate cancer driver genes after treatment with abiraterone/enzalutamide
Supplementary Figure S16 shows patients without evidence for somatic mutation profile change after treatment progression based on 72-gene targeted sequencing
Supplementary Figure S23 provides AR region copy number profiles for all 20 patients that showed a change in the structure of androgen receptor (AR) amplifications after treatment with abiraterone/enzalutamide
Supplementary Figure S15 shows temporal changes in whole exome copy number profile in patients that had evidence for copy number profile change in 72-gene targeted sequencing
Supplementary Figure S9 shows the correlation between serum prostate-specific antigen (PSA) levels and plasma circulating tumor DNA fraction.
Supplementary Figure S18 provides whole exome copy number profiles in patients that did not show temporal changes in their 72-gene copy number profile
Supplementary Figure S5 provides an overview of per patient ctDNA fraction and sequential treatment response (best prostate-specific antigen (PSA) decline and duration of response).
 Joanna Vergidis合作论文数34Daygen L. Finch合作论文数34Muhammad Zulfiqar合作论文数33Kim Chi合作论文数33
 Martin Gleave合作论文数Vancouver Prostate Centre, Faculty of Medicine, The University of British Columbia;Department of Urologic Sciences, The University of British Columbia33Khalaf Daniel合作论文数32
 Matti Annala合作论文数Department of Signal Processing, Tampere University of Technology31
 Bernie Eigl合作论文数Division of Medical Oncology, Faculty of Medicine, University of British Columbia;BC Cancer Agency30Kevin Beja合作论文数Vancouver Prostate Centre, University of British Columbia28
 Gillian Vandekerkhove合作论文数Vancouver Prostate Centre, University of British Columbia28
 Sinja Taavitsainen合作论文数Biomeditech Institute, University of Tampere, Tampere, Finland;28
 Colin Collins合作论文数Department of Urologic Sciences, Faculty of Medicine, The University of British Columbia27Matti Nykter合作论文数26
 Evan Warner合作论文数Vancouver Prostate Centre, University of British Columbia26Christian K. Kollmansberger合作论文数23J Sipola合作论文数Faculty of Medicine and Health Technology, Tampere University23
 Cameron Herberts合作论文数Univ British Columbia, Dept Urol Sci, Vancouver Prostate Ctr, 2660 Oak St, Vancouver, BC V6H 3Z6, Canada23Amanda Wong合作论文数23Simon Fu合作论文数23Katherine Sunderland合作论文数Canc Surveillance & Outcomes, British Columbia Canc9
 Arun Azad合作论文数Peter MacCallum Cancer Centre6
 Christian Kollmannsberger合作论文数BC Cancer Vancouver Center;Vancouver Prostate Centre;Department of Medicine, Faculty of Medicine, University of British Columbia5Alexander William Wyatt合作论文数4Sunil Parimi合作论文数3
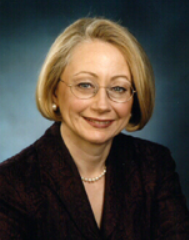 Pamela Goodwin合作论文数Institute of Health Policy, Management and Evaluation, University of Toronto;Lunenfeld-Tanenbaum Research Institute, Mount Sinai Hospital2
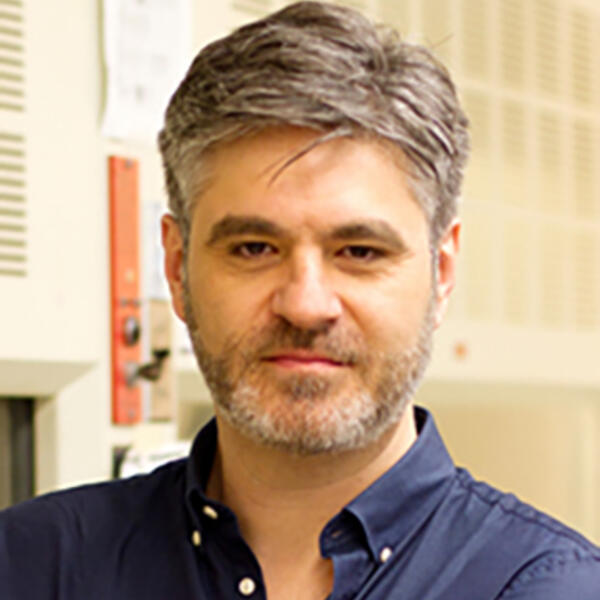 Vuk Stambolic合作论文数Department of Medical Biophysics, Temerty Faculty of Medicine, University of Toronto2
 Som Mukherjee合作论文数Department of Oncology, Faculty of Health Sciences, McMaster University;Escarpment Cancer Research Institute, Faculty of Health Sciences, McMaster University2Whelan Tim J合作论文数2
 Timothy J. Hobday合作论文数Mayo Clinic Comprehensive Cancer Center2Julie Lemieux合作论文数Samuel Lunenfeld Research Institute of the Mount Sinai Hospital, University of Toronto2
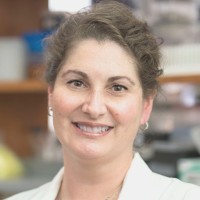 Ingrid A. Mayer合作论文数Breast and Gynecological Cancers, AstraZeneca2
 Wendy Parulekar合作论文数Department of Oncology, Faculty of Health Sciences, Queen’s University2Jennifer A. Ligibel合作论文数2
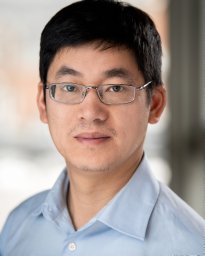 Bingshu Chen合作论文数Department of Public Health Sciences, Faculty of Health Sciences, Queen's University;Department of Mathematics and Statistics, Faculty of Health Sciences, Queen's University;Canadian Cancer Trials Group2Alastair M. Thompson合作论文数2
 Vanessa Bernstein合作论文数Breast Cancer Outcomes Unit, University of British Columbia2
 Haji Chalchal合作论文数From the Allan Blair Cancer Centre, University of Saskatchewan2
 Dawn L Hershman合作论文数Herbert Irving Comprehensive Cancer Center, Columbia University2
 Lois Shepherd合作论文数Sinclair Cancer Research Institute, Queen’s University2
 Kathleen Pritchard合作论文数Breast Cancer Research Centre, Sunnybrook Research Institute;Department of medicine, Temerty Faculty of Medicine, University of Toronto;Institute of Health Policy, Management and Evaluation, Faculty of Medicine, University of Toronto2Priya Rastogi合作论文数2
 Karen A. Gelmon合作论文数Vancouver Coastal Health Research Institute, The University of British Columbia2Lyly Le合作论文数1Bruce Keith合作论文数1Maria I Pacheco合作论文数1Cyrus Chehroudi合作论文数1Deepa Wadhwa合作论文数1Miles P Mannas合作论文数1Krista L Noonan合作论文数1




