The 2022 Hunga eruption injected unprecedented quantities of water vapor into the stratosphere, alongside modest amounts of aerosol precursors. There remain uncertainties regarding the extent to which it influenced the stratospheric ozone layer. We address this using a multi-model ensemble of chemistry-climate model simulations, assessing the impacts of Hunga-induced perturbations in both water vapor and aerosol by combining free-running and specified-dynamics experiments. The results confirm that the Hunga eruption contributed to the anomalously low ozone abundances observed in the southern mid-latitudes in 2022. The simulations also indicate enhanced ozone depletion inside the Antarctic polar vortex, albeit with significant differences in magnitude and persistence across the models. Our results indicate that the chemical contribution was as important as the dynamical contribution in determining the overall ozone response to the Hunga eruption in the southern extra-tropics, with anomalous chemical (chlorine, bromine and nitrogen) processing on aerosol surfaces under conditions of water-induced stratospheric cooling together with dynamical contributions from altered circulation and ozone transport. Finally, while Hunga may continue to exert a smaller influence on ozone as the anomalous water vapor and aerosol is removed from the atmosphere, natural dynamical variability will likely hinder detection of any such influences, with the most robust Hunga signal expected in the upper stratosphere. Our study confirms the eruption's role in modulating stratospheric ozone levels in the short term, but also highlights the associated uncertainties and the presence of large natural variability, all of which makes confident attribution of the Hunga impacts an ongoing challenge.
Methane (CH4) and carbon monoxide (CO) are gases with important climate impacts as direct and indirect greenhouse gases, respectively. Methane has a warming potential 28 times that of carbon dioxide on a 100-year timescale, and carbon monoxide is a precursor to ozone in the troposphere. Modeling trace gas concentrations in the Arctic atmosphere can be challenging due to Arctic conditions and sensitivity to long-range transport, and comparing model outputs to remote sensing measurements is essential for ensuring that models are performing well. Ground-based Arctic measurements are spatially sparse, so it is important to make use of all such available data sets. In this study, we assess eight atmospheric models, comparing their simulations of atmospheric CO and CH4 column-averaged dry-air mole fractions for 2014 and 2015 with ground-based retrievals of these species at three Arctic stations in the Total Carbon Column Observing Network (TCCON). The multi-model mean had mean biases (+/- one standard deviation of the mean) of -5.4% +/- 8% at Eureka, Canada, -6.5% +/- 8% at Ny-& Aring;lesund, Norway, and -11% +/- 7% at Sodankyl & auml;, Finland for CO, and mean biases of -0.25% +/- 0.5% at Eureka, -0.90% +/- 0.5% at Ny-& Aring;lesund, and -1.0% +/- 0.5% at Sodankyl & auml; for CH4. Individual model mean biases range from -33% to +35% for CO and -2.5% to +1.9% for CH4. These results indicate that models could benefit from improvements targeting simulations of Arctic CO.
Climate models predict that the Brewer–Dobson circulation (BDC) will accelerate due to tropospheric warming, leading to a redistribution of trace gases and, consequently, to a change of the radiative properties of the atmosphere. Changes in the BDC are diagnosed by the so-called “age of air”, that is, the time since air in the stratosphere exited the troposphere. These changes can be derived from a long-term observation-based record of long-lived trace gases with increasing concentration in the troposphere, such as sulfur hexafluoride (SF6). The Atmospheric Chemistry Experiment Fourier Transform Spectrometer (ACE-FTS) provides the longest available continuous time series of vertically resolved SF6 measurements, spanning 2004 to the present. In this study, a new age-of-air product is derived from the ACE-FTS SF6 dataset. The ACE-FTS product is in good agreement with other observation-based age-of-air datasets and shows the expected global distribution of age-of-air values. Age of air from a chemistry–climate model is evaluated, and the linear trend of the observation-based age of air is calculated in 12 regions within the lower stratospheric midlatitudes (14–20 km, 40–70°) in each hemisphere. In 8 of 12 regions, there was not a statistically significant trend. The trends in the other regions, specifically 50–60 and 60–70° S at 17–20 km and 40–50° N at 14–17 and 17–20 km, are negative and significant to 2 standard deviations. This is therefore the first observation-based age-of-air trend study to suggest an acceleration of the shallow branch of the BDC, which transports air poleward in the lower stratosphere, in regions within both hemispheres.
According to satellite measurements from multiple instruments, water vapour (H2O) concentrations, in most regions of the stratosphere, have been increasing at a statistically significant rate of ∼1 %–5 % per decade since the early 2000s. Previous studies have estimated stratospheric H2O trends, but none have simultaneously quantified the contributions from all main sources (temperature variations in the tropical tropopause region, changes in the Brewer–Dobson circulation, and changes in methane (CH4) concentrations and oxidation) at all latitudes. Atmospheric Chemistry Experiment–Fourier Transform Spectrometer (ACE-FTS) measurements are used to estimate altitude-/latitude-dependent stratospheric H2O trends from 2004–2021 due to these sources. Results indicate that rising temperatures in the tropical tropopause region play a significant role in the increases, accounting for ∼1 %–4 % per decade in the tropical lower mid-stratosphere and in the mid-latitudes below ∼20 km. By regressing to ACE-FTS N2O concentrations, it is found that, in the lower mid-stratosphere, general circulation changes have led to both significant H2O increases and significant H2O decreases on the order of 1 %–2 % per decade depending on the altitude/latitude region. Making use of measured and modelled CH4 concentrations, the increase in H2O due to CH4 oxidation is calculated to be ∼1 %–2 % per decade above ∼30 km in the Northern Hemisphere and throughout the stratosphere in the Southern Hemisphere. After accounting for these sources, there are still regions of the mid-latitude lower mid-stratosphere that exhibit significant residual H2O trends increasing at 1 %–2 % per decade. Results indicate that these unaccounted-for increases could potentially be explained by increases in upper-tropospheric molecular hydrogen.
Lower stratospheric ozone between 60°S and 60°N has continued to decline since 1998, despite the reduction of ozone‐depleting substances following the Montreal Protocol. Previous studies have shown that, while chemistry‐climate models reproduce the negative ozone trend in the tropical lower stratosphere as a response to increased upwelling, they fail to capture the ozone decline in northern midlatitudes. This study revisits recent lower stratospheric ozone trends over the period 1998–2018 using two types of simulations from the new Chemistry Climate Model Initiative 2022 (CCMI‐2022): REF‐D1, with observed sea surface temperatures, and REF‐D2, with simulated ocean. The observed negative trend in midlatitudes falls within the range of model trends, especially when considering simulations with observed boundary conditions. There is a large spread in the simulated midlatitudes ozone trends, with some simulations showing positive and others negative trends. A multiple linear regression analysis shows that the spread in the trends is not explained by the different linear response to external forcings (solar cycle, global warming, and ozone‐depleting substances) or to the main variability modes (El Niño‐Southern Oscillation and the quasi‐biennial oscillation) but is instead attributed to internal atmospheric variability. Moreover, the fact that some models show very different trends across members, while other models show similar trends in all members, suggests fundamental differences in the representation of the internal variability of ozone transport across models. Indeed, we report substantial intermodel differences in the ozone‐transport connection on interannual timescales and we find that ozone trends are closely coupled to transport trends.
The Brewer-Dobson Circulation (BDC) is one of the main determinants of trace gas distributions in the atmosphere. Climate models predict that atmospheric warming will cause the BDC to accelerate, modifying where greenhouse gases are most active and impacting the radiative properties of the atmosphere, resulting in a feedback effect. This acceleration is difficult to verify with observations because the speed of the BDC cannot be measured directly. However, changes in stratospheric transport can be identified using the stratospheric age of air, defined as the time since an air parcel entered the stratosphere from the troposphere. A decrease in age of air at higher latitudes would suggest a reduction in transit times, signifying an acceleration of the BDC. Age of air can be calculated using long-lived “clock tracers” such as sulfur hexafluoride (SF6), an industrial gas that is produced in the troposphere, has a negligible seasonal cycle, and has no stratospheric sinks. Due to its small concentrations, measurements have been historically limited, but detecting changes in age of air derived from SF6 requires a long-term, and ideally consistent (i.e., measured by the same instrument), time series. The Atmospheric Chemistry Experiment Fourier Transform Spectrometer (ACE-FTS) provides the longest available vertically-resolved record of SF6, spanning 2004 to the present. This study presents a new age of air product derived from the ACE-FTS SF6 dataset using an updated version of the method used for the Michelson Interferometer for Passive Atmospheric Sounding (MIPAS) SF6 dataset, which spans the 2002-2012 period. In this presentation, the method for age of air calculation will be presented along with comparisons with other age of air profile datasets derived from MIPAS and balloon measurements. The long-term trend in age of air will be estimated using this new product with the goal of corroborating the predictions made by climate models.
This study evaluates tropospheric columns of methane, carbon monoxide, and ozone in the Arctic simulated by 11 models. The Arctic is warming at nearly 4 times the global average rate, and with changing emissions in and near the region, it is important to understand Arctic atmospheric composition and how it is changing. Both measurements and modelling of air pollution in the Arctic are difficult, making model validation with local measurements valuable. Evaluations are performed using data from five high-latitude ground-based Fourier transform infrared (FTIR) spectrometers in the Network for the Detection of Atmospheric Composition Change (NDACC). The models were selected as part of the 2021 Arctic Monitoring and Assessment Programme (AMAP) report on short-lived climate forcers. This work augments the model–measurement comparisons presented in that report by including a new data source: column-integrated FTIR measurements, whose spatial and temporal footprint is more representative of the free troposphere than in situ and satellite measurements. Mixing ratios of trace gases are modelled at 3-hourly intervals by CESM, CMAM, DEHM, EMEP MSC-W, GEM-MACH, GEOS-Chem, MATCH, MATCH-SALSA, MRI-ESM2, UKESM1, and WRF-Chem for the years 2008, 2009, 2014, and 2015. The comparisons focus on the troposphere (0–7 km partial columns) at Eureka, Canada; Thule, Greenland; Ny Ålesund, Norway; Kiruna, Sweden; and Harestua, Norway. Overall, the models are biased low in the tropospheric column, on average by −9.7 % for CH4, −21 % for CO, and −18 % for O3. Results for CH4 are relatively consistent across the 4 years, whereas CO has a maximum negative bias in the spring and minimum in the summer and O3 has a maximum difference centered around the summer. The average differences for the models are within the FTIR uncertainties for approximately 15 % of the model–location comparisons.
Lightning is an important atmospheric process for generating reactive nitrogen, resulting in the production of tropospheric ozone, as well as igniting wildland fires, which result in potentially large emissions of many pollutants and short-lived climate forcers. Lightning is also expected to change in frequency and location with the changing climate. As such, lightning is an important component of Earth system models. Until now, the Canadian Earth System Model (CanESM) did not contain an interactive-lightning parameterization. The fire parameterization in CanESM5.1 was designed to use prescribed monthly climatological lightning. In this study, we have added a logistical regression lightning model that predicts lightning occurrence interactively based on three environmental variables and their interactions in CanESM5.1's atmospheric model, CanAM5.1 (Canadian Atmospheric Model), creating the capacity to interactively model lightning, allowing for future projections under different climate scenarios. The modelled lightning and resulting burned area were evaluated against satellite measurements over the historical period, and model biases were found to be acceptable. Modelled lightning had a small negative bias and excellent land-ocean ratio compared to satellite measurements.The modified version of CanESM5.1 was used to simulate two future climate scenarios (SSP2-4.5 and SSP5-8.5; Shared Socioeconomic Pathway) to assess how lightning and burned area change in the future. Under the higher-emissions scenario (SSP5-8.5), CanESM5.1 predicts almost no change to the global mean lightning flash rate by the end of the century (2081-2100 vs. 2015-2035 average). However, there are substantial regional changes to lightning - particularly over land - such as a mean increase of 6 % in the northern mid-latitudes and decrease of -8 % in the tropics. By the century's end, the change in global total burned area with prescribed climatological lightning was about 2 times greater than that with interactive lightning (42 % vs. 26 % increase, respectively). Conversely, in the northern mid-latitudes the use of interactive lightning resulted in 3 times more burned area compared to that with unchanging lightning (48 % vs. 16 % increase, respectively). These results show that the future changes to burned area are greatly dependent on a model's lightning scheme, both spatially and overall.
The Atmospheric Chemistry Experiment Fourier Transform Spectrometer (ACE-FTS) is currently providing the only measurements of vertically resolved chlorodifluoromethane (HCFC-22) from space. This study assesses the ACE-FTS HCFC-22 v5.2 product in the upper troposphere and lower stratosphere, as well as simulations of HCFC-22 from a 39-year specified dynamics run of the Canadian Middle Atmosphere Model (CMAM39) in the same region. In general, ACE-FTS HCFC-22 observations tend to agree with subsampled CMAM39 data to within ±5 %, except for between ∼ 15 and 25 km in the extratropical regions where ACE-FTS exhibits a negative bias of 5 %–30 % and near 6 km in the tropics where ACE-FTS exhibits a bias of −15 %. When comparing against correlative satellite, aircraft, and balloon data, ACE-FTS typically exhibits a low bias on the order of 0 %–10 % between ∼ 5 and 15 km and is within ±15 % between ∼ 15 and 25 km. ACE-FTS, CMAM39, and surface flask measurements from the NOAA Global Monitoring Laboratory's surface air-sampling network all exhibit consistent tropospheric HCFC-22 trends ranging between 6.8 and 7.8 ppt yr−1 (within 95 % confidence) for 2004–2012 and between 3.1 and 4.7 ppt yr−1 (within 95 % confidence) for 2012–2018. Interhemispheric differences (IHDs) of HCFC-22 were also derived using ACE-FTS, NOAA, and CMAM39 data, and all three yielded consistent and correlated (r≥0.42) IHD time series, with the results indicating that surface IHD values decreased at a rate of 2.2 ± 1.1 ppt per decade between 2004 and 2018.
Abstract. In the Arctic stratosphere, the combination of chemical ozone depletion by halogenated ozone-depleting substances (hODSs) and dynamic fluctuations can lead to severe ozone minima. These Arctic ozone minima are of great societal concern due to their health and climate impacts. Owing to the success of the Montreal Protocol, hODSs in the stratosphere are gradually declining, resulting in a recovery of the ozone layer. On the other hand, continued greenhouse gas (GHG) emissions cool the stratosphere, possibly enhancing the formation of polar stratospheric clouds (PSCs) and, thus, enabling more efficient chemical ozone destruction. Other processes, such as the acceleration of the Brewer–Dobson circulation, also affect stratospheric temperatures, further complicating the picture. Therefore, it is currently unclear whether major Arctic ozone minima will still occur at the end of the 21st century despite decreasing hODSs. We have examined this question for different emission pathways using simulations conducted within the Chemistry-Climate Model Initiative (CCMI-1 and CCMI-2022) and found large differences in the models' ability to simulate the magnitude of ozone minima in the present-day climate. Models with a generally too-cold polar stratosphere (cold bias) produce pronounced ozone minima under present-day climate conditions because they simulate more PSCs and, thus, high concentrations of active chlorine species (ClOx). These models predict the largest decrease in ozone minima in the future. Conversely, models with a warm polar stratosphere (warm bias) have the smallest sensitivity of ozone minima to future changes in hODS and GHG concentrations. As a result, the scatter among models in terms of the magnitude of Arctic spring ozone minima will decrease in the future. Overall, these results suggest that Arctic ozone minima will become weaker over the next decades, largely due to the decline in hODS abundances. We note that none of the models analysed here project a notable increase of ozone minima in the future. Stratospheric cooling caused by increasing GHG concentrations is expected to play a secondary role as its effect in the Arctic stratosphere is weakened by opposing radiative and dynamical mechanisms.
Abstract. Both measurements and modelling of air pollution in the Arctic are difficult. Yet with the Arctic warming at nearly four times the global average rate, and changing emissions in and near the region, it is important to understand Arctic atmospheric composition and how it is changing. This study examines the simulations of atmospheric concentrations of methane, carbon monoxide and ozone in the Arctic by 11 models. Evaluations are performed using data from five high-latitude ground-based Fourier transform infrared (FTIR) spectrometers in the Network for the Detection of Atmospheric Composition Change (NDACC). Mixing ratios of trace gases are modelled at three-hourly intervals by CESM, CMAM, DEHM, EMEP MSC-W, GEM-MACH, GEOS-Chem, MATCH, MATCH-SALSA, MRI-ESM2, UKESM1 and WRF-Chem for the years 2008, 2009, 2014, and 2015. The comparisons focus on the troposphere (0–7 km partial columns) at Eureka, Canada; Thule, Greenland; Ny Ålesund, Norway; Kiruna, Sweden; and Harestua, Norway. Overall, the models are biased low in the tropospheric column, on average by -9.6 % for CH4, -21 % for CO and -18 % for O3. Results for CH4 are relatively consistent across the four years, whereas CO has a maximum negative bias in the spring and minimum in the summer, and O3 has a maximum difference centred around the summer. The average differences for the models are within the FTIR uncertainties for approximately 15 % of the model-location comparisons.
Observed trends in tropospheric ozone, an important air pollutant and short-lived climate forcer (SLCF), are estimated using available surface and ozonesonde profile data for 1993-2019, using a coherent methodology, and compared to modeled trends (1995-2015) from the Arctic Monitoring Assessment Program SLCF 2021 assessment. Increases in observed surface ozone at Arctic coastal sites, notably during winter, and concurrent decreasing trends in surface carbon monoxide, are generally captured by multi-model median trends. Wintertime increases are also estimated in the free troposphere at most Arctic sites, with decreases during spring months. Winter trends tend to be overestimated by the multi-model medians. Springtime surface ozone increases in northern coastal Alaska are not simulated while negative springtime trends in northern Scandinavia are not always reproduced. Possible reasons for observed changes and model performance are discussed including decreasing precursor emissions, changing ozone dry deposition, and variability in large-scale meteorology. The Arctic is warming much faster than the rest of the globe due to increases in carbon dioxide, and other trace constituents like ozone, also an air pollutant. However, improved understanding is needed about long-term changes or trends in Arctic tropospheric ozone. A coherent methodology is used to identify trends in surface and regular profile measurements over the last 20-30 years, and results from six chemistry-climate models. Increases in observed ozone are found at the surface and in the free troposphere during winter in the high Arctic. Paradoxically, decreases in nitrogen oxide emissions at mid-latitudes appear to be leading to increases in ozone during winter, but associated increases in Arctic tropospheric ozone tend to be overestimated in the models. Increases are also found at the surface in northern Alaska during spring but not reproduced by the models. The causes are unknown but could be related to changes in local sources or sinks of Arctic ozone or in large-scale weather patterns. Declining mid-latitude emissions, or increased dry deposition to northern forests, may explain negative surface ozone trends over northern Scandinavia in spring that are not always captured by the models. Further work is needed to understand changes in Arctic tropospheric ozone. Coherent ozone trend analysis methodology applied to multi-decade, pan-Arctic surface and ozonesonde datasets and multi-model mediansIncreasing winter Arctic tropospheric ozone overestimated by models in the free troposphere, and spring surface changes not capturedSpring (summer) decreases (increases) in observed ozone throughout the troposphere, not always simulated by models
Water vapour in the upper troposphere and stratosphere has a significant impact both on the radiative and chemical properties of the atmosphere. Reliable water vapour climate data records (CDRs) are essential for use in climate research, to assess vertically resolved trends and associated radiative impacts. Within the ESA Water Vapour Climate Change Initiative (WV_cci), new vertically resolved water vapour CDRs in the stratosphere and UTLS were merged from a range of satellite observations. In this contribution, we provide an overview of these CDRs, highlighting innovations in the merging methodologies and results from a detailed quality assessment. In particular, the long-term trends derived from the new water vapour CDRs are compared to other merged datasets, reanalyses, and simulations from chemistry-climate models, with the ESA WV_cci CDRs deemed to be valuable new datasets for climate studies. We conclude that, mostly driven by dynamical variability, the derived water vapour trends vary significantly depending on the dataset used, chosen time period and location in the atmosphere. Using an off-line radiative transfer model, we estimate the consequence of these differences on the radiative forcing from water vapour changes in the upper troposphere and stratosphere over the past 30+ years.
Water vapor plays an important role in many aspects of the climate system, by affecting radiation, cloud formation, atmospheric chemistry and dynamics. Even the low stratospheric water vapor content provides an important climate feedback, but current climate models show a substantial moist bias in the lowermost stratosphere. Here we report crucial sensitivity of the atmospheric circulation in the stratosphere and troposphere to the abundance of water vapor in the lowermost stratosphere. We show from a mechanistic climate model experiment and inter-model variability that lowermost stratospheric water vapor decreases local temperatures, and thereby causes an upward and poleward shift of subtropical jets, a strengthening of the stratospheric circulation, a poleward shift of the tropospheric eddy-driven jet and regional climate impacts. The mechanistic model experiment in combination with atmospheric observations further shows that the prevailing moist bias in current models is likely caused by the transport scheme, and can be alleviated by employing a less diffusive Lagrangian scheme. The related effects on atmospheric circulation are of similar magnitude as climate change effects. Hence, lowermost stratospheric water vapor exerts a first order effect on atmospheric circulation and improving its representation in models offers promising prospects for future research.
The Canadian Atmospheric Model version 5 (CanAM5) is the component of Canadian Earth System Model version 5 (CanESM5) which models atmospheric processes and coupling of the atmosphere with land and lake models. Described in this paper are the main features of CanAM5, with a focus on changes relative to the last major scientific version of the model (CanAM4). These changes are mostly related to improvements in radiative transfer, clouds, and aerosol parameterizations, as well as a major upgrade of the land surface and land carbon cycle models and addition of a small lake model. In addition to changes to parameterizations and models, changes in the adjustable parameters between CanAM4 and CanAM5 are documented. Finally, the mean climatology simulated by CanAM5 for the present day is evaluated against observations and compared with that simulated by CanAM4. Although many of the aspects of the simulated climate are similar between CanAM4 and CanAM5, there is a reduction in precipitation and temperature biases over the Amazonian basin, global cloud fraction biases, and solar and thermal cloud radiative effects, all of which are improvements relative to observations.
As the third most important greenhouse gas (GHG) after carbon dioxide (CO2) and methane (CH4), tropospheric ozone (O3) is also an air pollutant causing damage to human health and ecosystems. This study brings together recent research on observations and modeling of tropospheric O3 in the Arctic, a rapidly warming and sensitive environment. At different locations in the Arctic, the observed surface O3 seasonal cycles are quite different. Coastal Arctic locations, for example, have a minimum in the springtime due to O3 depletion events resulting from surface bromine chemistry. In contrast, other Arctic locations have a maximum in the spring. The 12 state-of-the-art models used in this study lack the surface halogen chemistry needed to simulate coastal Arctic surface O3 depletion in the springtime; however, the multi-model median (MMM) has accurate seasonal cycles at non-coastal Arctic locations. There is a large amount of variability among models, which has been previously reported, and we show that there continues to be no convergence among models or improved accuracy in simulating tropospheric O3 and its precursor species. The MMM underestimates Arctic surface O3 by 5 % to 15 % depending on the location. The vertical distribution of tropospheric O3 is studied from recent ozonesonde measurements and the models. The models are highly variable, simulating free-tropospheric O3 within a range of ±50 % depending on the model and the altitude. The MMM performs best, within ±8 % for most locations and seasons. However, nearly all models overestimate O3 near the tropopause (∼300 hPa or ∼8 km), likely due to ongoing issues with underestimating the altitude of the tropopause and excessive downward transport of stratospheric O3 at high latitudes. For example, the MMM is biased high by about 20 % at Eureka. Observed and simulated O3 precursors (CO, NOx, and reservoir PAN) are evaluated throughout the troposphere. Models underestimate wintertime CO everywhere, likely due to a combination of underestimating CO emissions and possibly overestimating OH. Throughout the vertical profile (compared to aircraft measurements), the MMM underestimates both CO and NOx but overestimates PAN. Perhaps as a result of competing deficiencies, the MMM O3 matches the observed O3 reasonably well. Our findings suggest that despite model updates over the last decade, model results are as highly variable as ever and have not increased in accuracy for representing Arctic tropospheric O3.
Stratospheric aerosol injection (SAI) holds the potential to offset some of the future warming of the Earth’s surface. It comes with many potentially dangerous side effects, however, which are currently not well understood and poorly constrained. A major concern is the effect on stratospheric ozone, which could be weakened and delayed in its recovery, given that ozone-depleting substances will take decades to be completely removed. We are interested in ozone depletion and recovery in a scenario, where SAI is employed to keep the global surface temperature constant. Previous analyses have been conducted with models that have widely different treatments of aerosol microphysics and chemistry. To isolate and estimate the uncertainty of the chemical and dynamical effects in a multi-model context, CCMI-2022 proposed a new senD2-sai experiment, where the ocean is kept fixed and the elevated stratospheric aerosol burden, thus, only affects the middle atmospheric composition and temperature. Stratospheric aerosols are also uniformly prescribed for all participating models in order to minimize the uncertainty arising from the treatment of aerosol microphysics. In our work, we perform these experiments with our aerosol-chemistry-climate model SOCOLv4.0, and compare our results with other CCMI-2022 models, with a focus on the stratospheric ozone and temperature changes. We evaluate the role of individual processes, such as ozone destruction cycles and changes in large-scale transport. In addition, we discuss implementation issues related to imposing this aerosol forcing, as this will help in the interpretation of the main inter-model uncertainties. Finally, we discuss the implications of this work for our understanding of chemical feedbacks in future climate in the context of mitigation via SAI, and its relevance for future ozone assessments.
 Eugene Rozanov合作论文数Physical-Meteorological Observatory Davos;Institute of Atmosphere and Climate Science, ETH Zurich56
 Olaf Morgenstern合作论文数National Institute of Water and Atmospheric Research54
 Hideharu Akiyoshi合作论文数Earth System Division, National Institute for Environmental Studies48
 Guang Zeng合作论文数National Centre for Atmospheric Science;Department of Chemistry;University of Cambridge;National Centre for Atmospheric Science, University of Cambridge47
 Patrick Jöckel合作论文数Department of Earth System Modelling, German Aerospace Center, Deutsches Zentrum für Luft- und Raumfahrt46
 Makoto Deushi合作论文数Atmospheric Environment and Applied Meteorology Research Department, Meteorological Research Institute44Douglas E. Kinnison合作论文数Atmospheric Chemistry Division, National Center for Atmospheric Research43
 Jean-Francois Lamarque合作论文数National Center for Atmospheric Research;Climate and Global Dynamics Laboratory36John F. Scinocca (John Scinocca)合作论文数Canadian Centre for Climate Modelling and Analysis, Environment Canada36Andrea Stenke合作论文数35
 Martyn Chipperfield合作论文数School of Earth and Environment,University of Leeds34
 Slimane Bekki合作论文数LATMOS, Conseil National de la Recherche Scientifique34
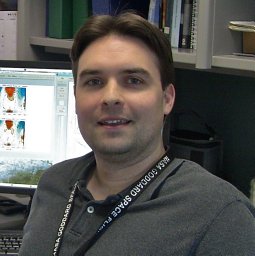 Luke D. Oman合作论文数Atmospheric Chemistry and Dynamics Laboratory, Earth Sciences Division, Goddard Space Flight Center, National Aeronautics and Space Administration32
 Sandip Dhomse合作论文数Institute for Climate and Atmospheric Science, School of Earth and Environment, University of Leeds31
 B. Josse合作论文数30
 Veronika Eyring合作论文数Institut für Physik der Atmosphäre, Deutsches Zentrum für Luft- und Raumfahrt;Institute of Environmental Physics, University of Bremen29laura e revell合作论文数ETH, Inst Atmospher & Climate Sci, Zurich, Switzerland28
 Martin Dameris合作论文数Fakultät für Physik, Ludwig-Maximilians-Universität München;Institut für Physik der Atmosphäre, Deutsches Zentrum für Luft- und Raumfahrt28
 Theodore G. Shepherd合作论文数Department of Meteorology, University of Reading25Neal Butchart合作论文数25
 Simone Tilmes合作论文数Atmospheric Chemistry Observations & Modeling Lab, National Center for Atmospheric Research, The University Corporation for Atmospheric Research25Sarah A. Strode合作论文数Atmospher Chem & Dynam Lab, NASA Goddard Space Flight Ctr22Hella Garny合作论文数22G. Pitari合作论文数21E. Mancini合作论文数20K. Shibata合作论文数20
 Kaley Walker合作论文数Department of Physics, University of Toronto20
 Darryn Waugh合作论文数Morton K. Blaustein Department of Earth and Planetary Sciences, Krieger School of Arts & Sciences, Johns Hopkins University19
 Drew Shindell合作论文数Earth & Climate Sciences Division, Nicholas School of the Environment, Duke University;School of the Environment and Earth Sciences, Tel Aviv University;UN Environment18
 Robyn Schofield合作论文数School of Geography, Earth and Atmospheric Sciences, Faculty of Science, The University of Melbourne18
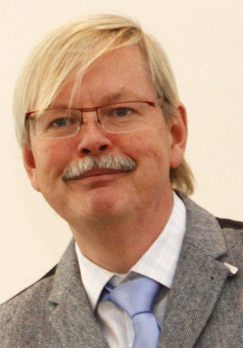 Peter Braesicke合作论文数Institute of Meteorology and Climate Research - Atmospheric Trace Gases and Remote Sensing, Karlsruhe Institute of Technology18
 Steven Hardiman合作论文数Hadley Centre, Met Office18
 Michaela I. Hegglin合作论文数Department of Meteorology, University of Reading18
 Alex Archibald合作论文数Yusuf Hamied Department of Chemistry, University of Cambridge;National Centre for Atmospheric Science18
 Cionni Irene合作论文数Energy and the Environment (ENEA),, Italian National Agency for New Technologies17Yousuke Yamashita合作论文数17
 Larry W. Horowitz合作论文数Earth System Processes and Interactions Division, Geophysical Fluid Dynamics Laboratory, National Oceanic and Atmospheric Administration;Department of Geosciences, Princeton University17
 Gregory S Faluvegi合作论文数NASA Goddard Institute for Space Studies;Center for Climate Systems Research, Columbia Climate School, Columbia University in the City of New York17
 Daniele Visioni合作论文数Cornell Univ, Sibley Sch Mech & Aerosp Engn, Ithaca, NY 14853 USA16
 Sophie Szopa合作论文数Laboratoire des Sciences du Climat et de l’Environnement16
 Philip Cameron-Smith合作论文数16
 Andrew Gettelman合作论文数Pacific Northwest National Laboratory16
 Wenshou Tian (田文寿)合作论文数Key Laboratory of Semi-Arid Climate Change, Ministry of Education, china, College of Atmospheric Sciences, Lanzhou University16
 Rolando Garcia合作论文数Atmospheric Chemistry Division, National Center for Atmospheric Research;Atmospheric Chemistry Observations & Modeling Lab, National Center for Atmospheric Research15
 Fiona O'Connor合作论文数Met Office Hadley Centre15
 Luke Abraham合作论文数Centre for Atmospheric Science, Yusuf Hamied Department of Chemistry, University of Cambridge;National Centre for Atmospheric Science;Software Sustainability Institute15
 Kengo Sudo合作论文数Center for Global Change;Agency for Marine-Earth Science and Technology;Agency for Marine-Earth Science and Technology, Center for Global Change14Martine Michou合作论文数14




