The amount of Earth observation data is getting larger day by day. This rapid evolution of the field and the exponential growth of data generation mediums urges the need for modern ways of fast analysis and processing of satellite images. Earth Observation Data Cubes enhance the way Earth data are distributed, handled, stored, and analyzed by providers and users. In this study the development of the National Earth Observation Data Cube of Cyprus is described and the importance of such software-based infrastructure is demonstrated through a water resource monitoring use case in the context of climate crisis in the Mediterranean region. Moreover, this study exhibits the capabilities of semantic classification in Earth observation, introducing a spatially generalized approach for easier environmental monitoring. Such developments can enhance the preservation of the environment and its protection from future natural and human disasters.
Landscape ecology is the study of how different land uses and natural areas are arranged across a region, and how these spatial patterns affect biodiversity, ecosystem health, and human impacts. To measure and track these patterns, ecologists are using a range of tools and metrics that capture features such as connectivity, fragmentation, and the balance between natural and developed land. One such method is the Landscape Mosaic (LM) approach which classifies land into categories based on the mix of agriculture, natural habitats, and developed areas (e.g., urban), providing an integrated view of how humans are influencing ecosystems. Until recently, LM was only available through a specialized software package (i.e., GuidosToolbox), which limits its flexibility, interaction with other tools, and integration in scientific workflows. To address this, we present PyLM, a Python-based implementation of the LM model, making it easier for researchers, planners, and conservationists to analyze land use/cover (LUC) maps, generate statistics, and embed results into broader environmental workflows. The applicability of PyLM is demonstrated through a use case based on a LUC dataset for Switzerland. This new implementation enhances accessibility, supports sustainability assessments, and strengthens the ability to monitor landscapes over time.
Reconstructing the Earth system evolution through deep time requires spatially consistent, multi‑layer datasets that integrate geological, geophysical, and climatic information. Here we present a unified, high‑resolution (10×10km) global dataset describing the Earth’s evolution over the past 545 million years. This atlas provides 45 time slices spanning the Phanerozoic, each including quantified palaeogeography, seafloor age, crustal thickness, lithospheric thickness, and climate variables (surface air temperature, precipitation, and climate zones). All layers are generated using a consistent reconstruction framework based solely on the PANALESIS plate tectonic model, ensuring self consistency and reproducibility across the entire record. Surface and interior layers are computed from physically based relationships linking palaeogeography, crustal structure, tectonic domain boundaries, and seafloor thermal evolution. Climate simulations are produced using the intermediate complexity AOGCM PLASIM–GENIE, forced by time‑dependent palaeogeography, atmospheric CO2, and solar luminosity. Technical validation against present‑day reference datasets demonstrates strong agreement for seafloor age, palaeogeography, and crustal structure, and captures first‑order spatial patterns in lithospheric thickness and climate fields. This atlas enables a broad range of applications, including paleoclimate modelling, biodiversity and biogeographic analyses, tectonic and geodynamic studies, and long‑term surface process modelling. All datasets and code are openly available, ensuring transparent reuse and straightforward integration into Earth system modelling and Geographic Information Systems (GIS) workflows. The PANALESIS Atlas establishes a comprehensive, fully quantified baseline for investigating Earth’s coupled surface–interior–atmosphere evolution across the Phanerozoic.
The world is undergoing rapid transformations driven by climate change, socio-economic pressures, and geopolitical tensions. Monitoring these dynamics is essential to understand and anticipate territorial change. Although initiatives such as the European Union’s Open Data program promote spatiotemporal datasets (e.g., population, land use), analyzing and interpreting these data over time remains complex and requires technical expertise, limiting their accessibility. This research proposes Semantic Web-based methods to detect and annotate trends in spatiotemporal series, thereby assisting in the systematic analysis of temporal patterns. We introduce the SETT ontology (SEmantic Trajectory of Territory) and its OFF-SETT framework (Ontological Framework For SETT), enabling the formal description of territorial trends and their publication as semantic trajectories in the Linked Open Data cloud. The study delivers (i) a generic methodology for detecting and describing trajectories in spatiotemporal datasets; (ii) a framework for automatically generating knowledge graphs capturing these trajectories; (iii) a knowledge graph describing trajectories of demographic and satellite-derived variables (e.g., temperature, water, vegetation) for study areas in France and Switzerland; and (iv) a web-based geovisualization platform. The approach shows that Semantic Web technologies bridge complex spatiotemporal analysis and public accessibility. By publishing territorial trajectories as knowledge graphs, it fosters transparency, interoperability, and reuse of data, supporting informed decision-making and citizen engagement.
Geospatial embeddings (geo-embeddings) derived from large-scale Earth Observation Foundation Models offer new opportunities to increase the accuracy and temporal consistency of land cover maps in support of environmental monitoring. The research aimed to evaluate the potential of classifying environmental descriptors (EDs) from the TESSERA and AlphaEarth geo-embedding products and, from these, construct land cover maps according to the Food and Agriculture Organisation (FAO) Land Cover Classification System (LCCS). Random Forest classifiers were calibrated separately for three contrasting regions in Switzerland, Brazil and Spain using geo-embeddings values as predictors and specific land cover reference data as target variables. Model performance was assessed against stratified training and testing datasets, with hyperparameter optimization conducted through cross-validation. Robust and consistent predictive performance was observed across the three regions that were comparable when using TESSERA and AlphaEarth geo-embedding products. Accuracies exceeding 90 % were observed for the LCCS natural vegetation and water classes, but were lower for artificial surfaces (F1-score ~ 0.68-0.86) and bare soil (F1-score ~ 0.77-0.84) classes. Importantly, the cultivated vegetation class predicted by both models showed improved agreement with in situ observations compared to the aggregated Copernicus Crop Type product. Performance differences across regions were likely to be primarily influenced by reference data characteristics rather than landscape complexity. ESA WorldCover proved to be a reliable proxy reference dataset where in situ data were unavailable. Overall, geo-embeddings-based approaches provide a scalable, reproducible, and operationally viable pathway for classifying EDs with this translating into greater classifications of land cover. Once trained, the model can be implemented for other years, with this supporting numerous national to international applications including in relation to land use dynamics and impacts on carbon and biodiversity.
The latest planetary boundaries assessment underscores that freshwater systems are facing escalating risks. At the same time, they remain a priority on the political agenda, as reflected in the Sustainable Development Goals. Water security offers a comprehensive framework for disentangling the complex relationships between freshwater resources and human development.WS encompasses economic, environmental, and hazard dimensions, yet existing measurement approaches suffer from heterogeneity, limited comparability, and poor temporal coverage. This paper advances WS research in three ways. First, we present an original, reproducible global WS assessment at 0.5 degrees & times;0.5 degrees resolution from 2003-2019, integrating Earth observations and statistical data to capture multidimensional risks and resources. Second, we apply both weak and strong sustainability frameworks to WS, revealing substantial discrepancies in estimated security levels and threat areas, with weak sustainability systematically overestimating WS. Third, we examine how economic development and governance interact with WS at the national scale, distinguishing size and intensity effects and identifying institutional conditions that shape outcomes. Our analysis reveals that the weak sustainability approach systematically overestimates both the quality and progression of WS when compared with the strong sustainability approach, a discrepancy primarily attributable to the underlying embeddedness assumption. The mechanisms analysis highlight the non-linearities linking economic and political development to WS levels.
Cities and urban planning are crucial for a sustainable future. However, challenges such as urban sprawl, limited data, and methodological issues hinder effective monitoring of urban green spaces (UGS). UGS are essential for enhancing liveability, public health, and climate resilience, yet rapid urbanization threatens their accessibility and equitable distribution. Hereafter, we present a reproducible, scalable, and open data-based approach to assess accessibility to UGSs in support of SDG 11.7, which calls for universal access to safe, inclusive, and accessible green and public spaces. Building on the data-information-knowledge-wisdom (DIKW) framework and FAIR principles, we implemented, within the ESA-EU Horizon 2020 GEOSS Platform Plus (GPP) project, a web-based service integrating two open-source tools inAccessMod and AccessMod for automated data preparation, travel-time modelling, and accessibility estimation. The resulting indicator provides estimates of the share of urban populations lacking access to green spaces within defined walking distances, enabling comparison across cities and possibly monitoring over time. Results demonstrate the feasibility of generating harmonized, reproducible knowledge products that could ultimately support science-based decision-making and climate adaptation. Despite current limitations in datasets and simplified travel scenarios, the proposed approach provides a cost-effective, replicable, and possibly policy-relevant solution for global UGS monitoring.
Accurate land-cover mapping in tropical regions remains challenging because of high environmental heterogeneity, complex vegetation structure, and persistent cloud cover. Recent geospatial foundation models provide pre-computed Geo-embeddings that offer a new representation of Earth Observation data (EO), yet their potential for detailed tropical land-cover mapping and their performance relative to, and in combination with, conventional Sentinel-1 and Sentinel-2 satellite image time series remains largely unexplored. This study evaluated AlphaEarth Foundation Geo-embeddings for detailed vegetation mapping in northern Madagascar and investigated whether combining them with satellite image time series processed using the Satellite Image Time Series (SITS) R package could improve classification performance. Geo-embeddings were classified using a Random Forest model (GEO), while four supervised classifiers were trained on Sentinel-1 and Sentinel-2 time series. GEO achieved the highest standalone performance (OA = 0.74), outperforming all classifiers trained on the satellite image time series. Probability-level ensemble models were then used to assess whether both data representations could be beneficially combined. The best-performing ensemble, combining GEO (75%) with Temporal Convolutional Neural Network (TempCNN; 25%), increased overall accuracy from 0.74 to 0.82. These results suggest that Geo-embeddings provide an effective standalone representation for detailed tropical land-cover mapping and indicate that combining them with conventional satellite image time series may exploit complementary information. As geospatial foundation models continue to evolve, understanding how they can be integrated with established Earth observation workflows may support future operational land-cover mapping.
Understanding the Earth’s evolution across geological timescales requires access to spatially explicit deep time datasets, yet existing palæogeographic and geodynamic products are often disseminated as isolated files with limited metadata, heterogeneous formats, and no standard mechanisms for analysis, limiting reproducibility, interoperability, and large scale comparative studies. Hereafter, we present the Palæo Data Cube (PDC), the first open framework applying concepts and technologies from modern Earth Observation data to deep time Earth system data. The PDC integrates palæogeographic reconstructions and other derived global products over 45 time steps covering the last 545 million years (Phanerozoic eon), all sharing a consistent projection, resolution, and temporal structure. The system relies entirely on open standards, combining GeoServer for spatiotemporal data access, GeoNetwork for ISO compliant metadata, and a SpatioTemporal Asset Catalog (STAC) for discovery. This architecture provides a harmonized, FAIR compliant environment where users can query, visualize, and analyse deep time datasets using the same tools commonly used for present day Digital Earth platforms. The PDC enables new applications in palæoclimatology, geodynamics, and landscape evolution, while also supporting geoscience education. By establishing an open, scalable and extensible foundation, the PDC represents a major step toward a fully interoperable “Digital Earth of the past.”
Addressing the global environmental crisis necessitates coordinated efforts, supported by open and reproducible research practices. Such practices aim to enhance the reliability, efficiency, and credibility of scientific outputs. Innovative tools are necessary for systematic conservation planning. This technical note presents a reproducible and automated approach for supporting land management and planning by identifying and updating ecological infrastructure (EI). Grounded in open science Findable, Accessible, Interoperable, and Reusable principles data management, and digital twin (DT) concepts, the method focuses on the Canton of Geneva, Switzerland. It integrates species distribution modelling, ecosystem service assessments, and spatial prioritization within a shared JupyterLab environment. The infrastructure centralizes data, automates indicator calculations, and ensures transparency, traceability, and reproducibility through version control and metadata generation. Ecological tools like Zonation enable the identification of high-priority conservation areas aligned with international targets. The system facilitates collaborative workflows and indicator updates. Its architecture allows scalability to broader regions and scenario modelling, laying the foundation for a DT of Geneva’s environment. Despite challenges in harmonizing workflows across institutional partners, this solution enhances efficiency and replicability in EI planning. The methodology is transferable to other regions and adaptable to various environmental modelling domains, offering a robust base for sustainable territorial management.
The UN General Assembly (2015) emphasizes sustainable pathways to enhance resilience for people and nature, with future development driven by data and evidence. Sustainable development frameworks (e.g., the UN 2030 Agenda and the 2016 Paris Climate Agreement) highlight the importance of data and evidence in assessment and decision-making that respects national policies and priorities. Global advances in Earth observation (EO) data provision and digital solutions that increase efficiencies, timeliness, and affordability are making major contributions. However, many existing platforms rely on externally hosted cloud infrastructures and generic global classifications of environments that may not align with domestic statutory definitions, limiting national control over data governance, methodological standards, and regulatory reporting. These constraints have raised growing concerns regarding data and technological sovereignty for countries seeking authoritative, policy-ready environmental information. Using Wales (United Kingdom; UK) as an exemplar, this study showcases the design and implementation of a flexible, sovereign National Digital Infrastructure (NDI) that uses the Open Data Cube (ODC) to apply Living Earth, a novel and customizable approach for EO-focused environmental monitoring. Outputs are time series of land cover and habitat maps and change products, including post-event (e.g., fire, flood) management, which address key policy requirements and support land and water resource management (from freshwater to marine environments), while ensuring public dissemination. Major advantages include the sharing of consistent datasets across governments and partner organizations, minimizing duplication of effort, improving transparency, traceability, and reproducibility, fostering collaboration between diverse stakeholders and communities, promoting inclusivity in environmental management decision-making, and supporting sustainable outcomes.
The overexploitation of natural resources and pollution are urgent concerns affecting the Earth's global system.Earth Observation (EO) data can be used to analyze the environmental impact of human activities. However, extracting meaningful insights from EO time series data requires domain expertise. In this position paper, we propose a methodology to improve the accessibility and understanding of environmental trends for a wide audience. Using Machine Learning (ML) technologies, we detect and describe in the Semantic Web (SW) changes in EO time series.
Despite the large availability of satellite and in-situ data on snow cover in the Northern Hemisphere, long-term assessments at an adequate resolution to capture the complexities of mountainous terrains remain limited, particularly for countries like Switzerland. This study addresses this gap by employing two products—the monthly NDSI (Normalized Difference Snow Index) and snow cover products—derived from the Snow Observation from Space (SOfS) algorithm to monitor snow cover dynamics across Switzerland over the past 37 years. The pixel-wise analysis reveals significant negative trends in the monthly NDSI across all seasons, with the most pronounced decreases at low to mid-elevations, particularly in winter and spring (e.g., a 50% reduction in NDSI for pixels showing positive significative trends in winter below 1,000 m, and a 43% reduction in spring between 1,000 and 2,000 m). Similarly, snow cover area has declined significantly, with reductions of −13% to −15% in spring for the transitional zones between 1,000–1,500 m and 1,500–2,000 m. Furthermore, the monthly NDSI values are more strongly influenced by temperature than precipitation, especially at lower altitudes. To estimate trends in snow cover for the 21st century, we modelled the relationship between snow presence and two climatic variables (temperature and precipitation) using a binomial generalized linear mixed model (GLMM). In the context of climate change, projections under various greenhouse gas emission scenarios suggest further declines in snow cover by the end of the century. Even with moderate climate action (RCP 2.6), snow-free areas could expand by 22% at lower elevations by 2100. Under the more extreme scenario (RCP 8.5), snow-free regions could increase by over 43%, with significant impacts during the transitional months of April and May. The SOfS algorithm, developed within the Swiss Data Cube, provides valuable insights into snow cover dynamics across Switzerland. Complementing in-situ observations, this innovative approach is essential for assessing snow cover changes and guiding adaptation strategies in a country where snow is not only an environmental indicator but also a cultural and economic asset.
Landsat and Sentinel-2 satellites offer significant advantages for monitoring snow cover over mountainous countries like Switzerland. Starting in the 1970s, Landsat data provides over 50 years of medium resolution imagery. However, the main limitation of optical imagery is cloud cover. Cloud obstruction is particularly challenging for Landsat and Sentinel-2 data, which have limited temporal resolutions. In this study we present the Snow Observation from Space (SOfS) algorithm composed of seven successive temporal and spatial techniques to reduce cloud coverage in the final snow cover products. We used long-term Landsat and Sentinel-2 datasets available from the Swiss Data Cube. The results indicate that the filtering techniques are efficient in reducing cloud cover by half while still leaving an average of less than 30% of cloud cover. The accuracy of the entire algorithm is evaluated over Switzerland, using in-situ measurements of 263 climate stations in the period 1984-2021. The validation results show an agreement between SOfS dataset and ground snow observations with an average accuracy of 93%.
This paper describes the chaining of several existing components to measure geographic accessibility to services into a single automated framework called the “AccessMod framework”. It then explains how this framework is exposed on the Internet thanks to the use of a virtual laboratory that transforms it into an integrated and transparent service. To demonstrate the capabilities of this service, a use case allowing to model geographic accessibility to green spaces in specific cities has been implemented in a virtual laboratory using Docker images. An execution of this geographic accessibility modeling to green spaces is done for the city of Yerevan, Armenia. Three ways of running the model are demonstrated: (1) in command line; (2) through the virtual laboratory interface and (3) through the GEOSS portal. The outputs are described, and the advantages, issues, limitations and perspectives are discussed. The possibility to reduce the technical complexity of geographic accessibility modeling thanks to its exposition on a web browser represents an undeniable step towards a wider adoption of this accessibility parameter for various thematics. This paper raises the importance of the availability of global renown datasets (e.g. OpenStreetMap, Worldpop, Copernicus land cover, etc.) for automated workflows, but also highlights the limitations of global models, that need to be customized (e.g. for the travel scenarios that are different among cities). Several perspectives are finally proposed to improve the automatic modelling of geographic accessibility through this framework.
The increasing frequency and severity of natural and anthropogenic disasters, including those induced by war and climate change, demand innovative tools for monitoring, forecasting, and managing land use change. This article presents a novel AI-powered Digital Twin (DT) framework tailored for disaster-affected regions, integrating multimodal satellite data, climate reanalysis, and in situ observations. The architecture comprises modular Digital Twin Instances (DTIs), each addressing specific thematic domains, such as vegetation dynamics, land surface temperature, and forest cover dynamics, coordinated through a central Digital Twin Aggregator (DTA). The system supports both rapid and gradual monitoring cycles, enabling timely and scalable assessments. We incorporate recent advances in geospatial foundation models, physics-informed neural networks, and semantic harmonization to address data heterogeneity and scarcity. The framework is demonstrated through pilot applications in Ukraine and Switzerland. In Ukraine, DTIs capture conflict-related cropland losses and forest degradation near the front line, as well as post-flood recovery following the Kakhovka Dam destruction; in Switzerland, annual-scale forest dynamics are assessed, highlighting gradual structural shifts in response to climate and socio-economic drivers. A cognitive user interface further enhances usability by integrating large language models for natural language interaction, improving accessibility for nontechnical users. The proposed framework offers a scalable and adaptive approach to land use monitoring, with significant implications for disaster management, environmental recovery, and sustainable development.
Switzerland, renowned for its mountainous landscapes, holds nearly 10% of Europe’s water reserves, with 40% of its running waters originating from snowmelt. Snow plays a crucial role in the country’s water management, hydroelectric power, and alpine ecosystems. It supports freshwater supply, agriculture, and tourism, making accurate snow monitoring vital for resource management and environmental preservation. Climate change, however, threatens snow cover, impacting water availability, biodiversity, and ecosystem services. Remote sensing technologies have emerged as key tools for monitoring snow cover, providing critical data for climate models, hazard prediction, and resource planning. In Switzerland, snow cover is monitored using ground-based measurements, remote sensing, and climate models, with datasets from satellites like Landsat and Sentinel-2 offering valuable insights despite challenges such as cloud obstruction. Such data are essential for hydrological modelling, agricultural monitoring, and climate studies, contributing to our understanding of global warming and aiding in natural hazard assessment. Hereafter, we present a 37-year monthly time-series of snow cover derived from Landsat and Sentinel-2 data using the Snow Observations from Space algorithm and processed in the Swiss Data Cube that facilitates the analysis, production and reuse of this Essential Climate Variable, enhancing environmental monitoring efforts at national scale.
Palaeogeography is the study of the geography in the geological past, focusing on reconstructing the position of continents, oceans and mountain ranges over millions of years, helping scientists to understand past climates, the evolution of life and quantify sea-level variations. Plate tectonic models are essential for reconstructing palaeogeography, as they provide information about the position and age of geological features controlling the topography. The PANALESIS model, for instance, can be used to create fully quantified palaeogeographic reconstructions and sea-level variations estimates. However, the data and code used to produce previous results using PANALESIS were never published, were dependent on proprietary software, and can no longer be run due to software obsolescence, making them impossible to reproduce. To address this, we have entirely rewritten and enhanced the source code into a QGIS plugin named TopoChronia. In this paper, we present sea-level curves derived from the new palaeogeographic maps over the Phanerozoic, and compare them with the original PANALESIS sea-level curve as well as other data obtained with sequential stratigraphic studies. We discuss possible causes explaining differences in results. The TopoChronia plugin is available at https://github.com/florianfranz/topo_chronia
 Anthony Lehmann合作论文数Laboratoire d'Ecologie et de Biologie Aquatique, University of Geneva39
 Pascal Peduzzi合作论文数UNEP, Switzerland38
 Pierre Lacroix合作论文数27
 Bruno Chatenoux合作论文数25
 Stephane Kluser合作论文数24
 Yaniss Guigoz合作论文数SALB Coordination Office;World Health Organisation;SALB Coordination Office, World Health Organisation24
 Nicolas Ray合作论文数ALICE reseach team (LORIA22
 Dorian Gorgan合作论文数Computer Science Department, Technical University of Cluj-Napoca16
 Nativi Stefano合作论文数Ministry of Foreign Affairs and Foreign Trade;CNR - Institute of Atmospheric Pollution Research16
 Hy Dao合作论文数15
 Andrea de Bono合作论文数14
 Denisa Rodila合作论文数Computer Science Department, Technical University of Cluj-Napoca14
 Charlotte Poussin合作论文数13
 Mattia Santoro合作论文数13Paolo Mazzetti合作论文数Institute of Atmospheric Pollution Research, National Research Council of Italy13Karin Allenbach合作论文数11
 Hrachya Astsatryan合作论文数Institute for Informatics and Automation Problems, the National Academy of Sciences of the Republic of Armenia11
 Jean-Philippe Richard合作论文数9Andrea Bono合作论文数8Bocar Sy合作论文数7
 Corine Frischknecht合作论文数Section of Earth and Environmental Sciences, Univ. Geneva7
 Karim C. Abbaspour (Karim Abbaspour)合作论文数Swiss Federal Institute of Aquatic Science and Technology;Department of Biological and Agricultural Engineering, College of Agriculture & Life Sciences, Texas A&M University7
 Victor Bacu合作论文数Computer Science Department, Technical University of Cluj-Napoca7Daniel Ohnenstetter合作论文数6
 Danut Mihon合作论文数6A. De Bono合作论文数5
 Vahagn Muradyan合作论文数Center for Ecological-Noosphere Studies of NAS RA, Abovyan 68, 0025, Yerevan, Armenia5Armen Saghatelyan合作论文数Ctr Ecol Noosphere Studies, NAS5Crispin K Mulaji合作论文数Universite de Kinshasa5
 Pablo Timoner合作论文数Uni Carl Vogt, Univ Geneva5
 Martin Beniston合作论文数Institute of Environmental Sciences, University of Geneva5
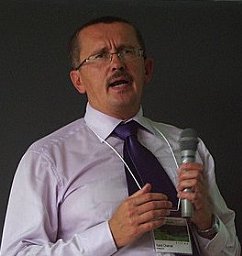 Karel Charvat合作论文数Help Service Remote Sensing5
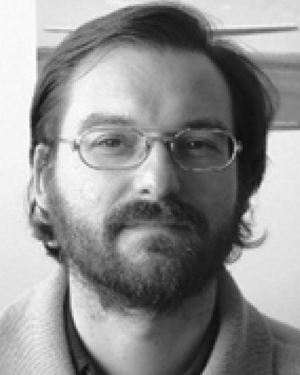 Joan Masó-Pau合作论文数5
 Shushanik Asmaryan合作论文数Center for Ecological Studies5
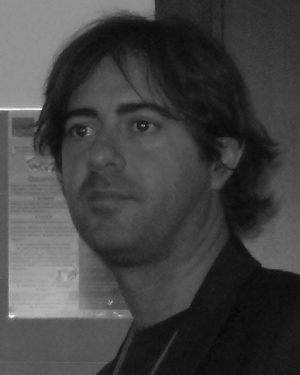 Pierluigi Cau合作论文数5Thomas Piller合作论文数4Arthur Lalayan合作论文数Natl Polytech Univ Armenia4Erica Honeck合作论文数4
 Camille Bernard合作论文数Univ. Grenoble Alpes, Grenoble, France4Mlisa, A.合作论文数Umvoto Africa (Pty) Ltd.;c4Olivier Ertz合作论文数4
 Pius T. Mpiana合作论文数Department of Chemistry, Science Faculty, University of Kinshasa4Laffite Amandine合作论文数4
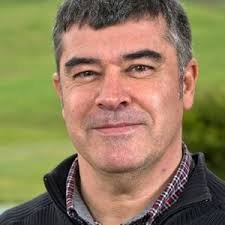 Jérôme Gensel合作论文数LIG Laboratory, STEAMER Team, Saint Martin D'Hères, France4
 Anthony Fallick合作论文数School of Geographical & Earth Sciences, University of Glasgow;Scottish Universities Environmental Research Centre, University of Glasgow4
 Brian D. Killough合作论文数4
 Jens Ingensand合作论文数Institute of Urban and Regional Planning & Design – Geomatics Lausanne, Swiss Federal Institute of Technology Lausanne4
 Lorenzo Bigagli合作论文数IMAA C.da S.Loja–Zona Industriale Tito Scalo Italy, Italian National Research Council4




