The spatial variability in the atmospheric CO2 and CH4 concentrations in urban land is affected by the source type, source distribution, and emission intensity in the cityscape. In this study, we analyzed vehicle-mounted measurements of street-level CO2 and CH4 concentrations in Hangzhou—a large metropolitan area in the Yangtze River Delta in eastern China. The results revealed that CO2 and CH4 emission hotspots did not overlap geographically, with the former occurring as linear features at elevated road intersections and expressways and the latter occurring at waste treatment facilities (sewage treatment plants and landfills). The CH4:CO2 emission ratios (ppb ppm−1) were ranked in increasing order as follows: traffic (1.01 ± 1.82; mean ± 1 SD); overall (3.46 ± 2.71); sewage treatment (12.76 ± 2.50); and landfill (36.50 ± 10.15). Waste treatment was largely responsible for the increased overall emission ratio, supporting this source category as a major contributor to the CH4 budget in this city and suggesting a negligible role of domestic appliances (cookstoves and water heaters). A two-source mixing model calculation indicated that 99.9
It is widely acknowledged that government policies significantly influence the emission and distribution of urban greenhouse gases (GHGs). However, accurately assessing the impact of urban pollution control measures on GHGs in megacities remains challenging and relies on integrating model simulations with multi-source observational data. Since 2003, Beijing, the capital of China, has gradually expanded a heating transformation policy from the city center. This policy shift offers a unique opportunity to quantify the reduction in urban GHG emissions resulting from government interventions. Based on urban GHG observations in Beijing from 2015 to 2020 (conducted without a drying system), this study applies an atmospheric method to analyze interannual variations in GHG emissions during winter heating seasons, which coincided with the energy structure transition, and identifies the main drivers of the observed trends in CH4/CO2 and N2O/CO2 ratios. Our findings showed that: (1) the shift in energy structure has directly reduced greenhouse gas emissions, thereby significantly impacting Beijing's seasonal GHG concentration trends, with an average annual winter reduction of 5.30 & times; 105 t of CO2-equivalent between 2015 and 2018.; (2) the CH4/CO2 and N2O/CO2 ratios exhibited distinct winter trends during 2015-2020, ranging between 6.02 & times; 10-3-8.39 & times; 10-3 ppm ppm-1 and 5.60 & times; 10-5-8.88 & times; 10-5 ppm ppm-1, respectively; (3) source diagnostics derived from the inter-gas correlations show that the interannual variations were driven by both the coal-to-gas transition and other anthropogenic sources like coal mining, wastewater treatment, and landfill management. This study focuses on Beijing, a city that has undergone significant energy structure changes, and serves as a case study for other cities undergoing similar transformations. While this practice can reduce GHG emission intensity, the increased use of natural gas may introduce other emission challenges that require further investigation.
China is the largest methane (CH4) emitter globally, with the Yangtze River Delta (YRD) region recognized as a major emission hotspot. However, due to the scarcity of in situ observations and the complex spatiotemporal variability of these sources, significant uncertainties remain in regional CH4 emission estimates. To address this, we conducted continuous atmospheric CH4 concentration measurements from 1 June 2023, to 31 May 2024, at a central YRD site. Using an atmospheric transport model and a Bayesian inversion framework, we quantified monthly and sub-monthly CH4 emissions from different source categories, with a focus on waste treatment (including both landfill and wastewater). The results reveal the following key findings: (a) Substantial discrepancies were found between prior and posterior emissions across all categories. At the city scale, posterior annual CH4 emissions were estimated to be 87.4%, 64.6%, 109.5%, and 91.9% of prior emissions for all categories, waste treatment, rice paddy + wetland, and other sources, respectively, with waste treatment contributing the largest uncertainty. (b) Strong seasonal biases were observed, with waste treatment emissions peaking in August and reaching a minimum in March (a 2.6-fold variation), while rice paddy emissions were overestimated in May and underestimated in August by a factor of two. (c) CH4 emissions from waste treatment exhibited high temperature sensitivity, increasing by 29%-31% per 10 degrees C rise. Under future warming scenarios, waste treatment CH4 emission factors (EFs) will increase by up to 121.3% under SSP5-8.5 by the end of the century (2091-2100), relative to 2023-2024 levels. In contrast, atmospheric pressure showed negligible influence (3.2% per 1 hPa) on waste treatment CH4 emissions. (d) More additional observations (i.e., satellite or multiple sites) are strongly suggested to resolve the prior spatial pattern of emissions, especially for fossil fuel-related sources.
To characterize the concentrations of CO2 and CH4 in the urban atmospheric boundary layer (ABL), this study conducted airborne measurements over four cities in Eastern China, obtaining full vertical profiles (ground to 2 km) over Beijing and Nanjing, partial profiles over Hengshiu and Shangqiu. Results showed that the CO2 and CH4 concentrations in the ABL were consistently higher than those in the free atmosphere, with the highest values observed near the surface (Beijing and Nanjing). In Beijing, the daytime and nighttime inversion jumps in the CO2 concentration were -25.2 +/- 0.4 and -18.0 +/- 0.2 ppm, respectively. In Nanjing, the corresponding values were -9.5 +/- 0.1 and -10.0 +/- 0.4 ppm. For CH4, the inversion jumps were -171.4 +/- 0.4 ppb during the day and -202.6 +/- 2.3 ppb at night (Beijing); in Nanjing, they were -140.7 +/- 0.1 and -108.0 +/- 2.1 ppb, respectively. Change in the airmass trajectory altered the free-atmospheric CO2 concentration over Nanjing by 3 ppm in a matter of a few hours. The EDGAR CH4:CO2 emissions ratio was within measurement uncertainty of the nighttime ABL value in Beijing, but about 80 % higher in Nanjing, indicating that the inventory may have missed the recent energy transition from gasoline and natural gas to electric in the transport sector. The experimental data is available at 10.7910/DVN/ZPVSVU (Wang et al., 2026).
The gene flow rate in rice (Oryza sativa L.) is a critical factor for establishing safe isolation distances between genetically modified (GM) and non-GM varieties and for ensuring varietal purity in rice breeding programs. This study refines existing gene flow models by disentangling two key components of rice pollen dynamics: quantitative pollen competition and genetic competitiveness. We define B as the proportion of GM pollen within mixed pollen, representing quantitative pollen competitiveness. The outcrossing parameter Cb reflects the likelihood of successful fertilization and seed development by foreign pollen, while the hybrid compatibility parameter Cp captures the relative fertilization success of GM versus non-GM pollen within the same pollen pool. Together, Cb and Cp characterize the genetic competitiveness of rice pollen. Our findings reveal a nonlinear relationship between B and the observed GM pollen rate G, which may exhibit either upward or downward curvature. A nonlinear model provides a significantly better fit to this relationship than a linear model, improving R2 by 4.1–21.4% and reducing RMSE by 9.9–47.8%. The parameters Cb and Cp play central roles in determining gene flow; higher values correspond to stronger GM pollen competitiveness, resulting in higher gene flow rates and greater dispersal distances. Specifically, Cb sets the range of the B–G curve, while Cp determines its curvature.
Methane (CH4) emissions from the coal industry represent a substantial portion of anthropogenic CH4 emissions from energy-related activities. China ranks as the world's largest coal producer, where Shanxi Province is one of its major coal production regions and accounts for 20.7 % of the national total coal production. The inherent variability in coal properties, geological conditions, and mining techniques across coal mines introduces significant fluctuations in CH4 emission characteristics and emission factors (EFs), creating considerable uncertainty when estimating CH4 emissions in this major coal mining region using traditional emission inventories, thereby introducing large bias in estimating national total CH4 emissions of China. In this study, we applied a top-down approach to estimate CH4 emissions in the Taiyuan-Jinzhong Metropolitan (TJM) area of Shanxi Province, using atmospheric CH4 concentration observed from a 30-meter tower between March 2018 and February 2019. Building upon our previous work, we integrated five emission inventories-EDGAR, GFEI-coal, PRO-coal, GFEI-fuel, and a satellite-based CH4 emission product-with two inversion methods. Additionally, satellite xCH4 data were utilized to identify significant emission outliers, which were then calibrated when estimating the CH4 emission and EF for the region. Our results revealed notable disparities in the magnitude of CH4 emissions among the five inventories for the TJM region. After applying the MSF and SFBI methods to constrain the prior emission inventories, the posterior CH4 emissions for the TJM region were estimated at 1.1 × 10⁶ t, 1.0 × 10⁶ t, 1.1 × 10⁶ t, 1.3 × 10⁶ t, and 1.5 × 10⁶ t, respectively, across the five inventories. The derived coal mine CH4 EF for the TJM region was 9.6 (±1.35) m3/t, significantly lower than the previously reported value of 23.2 (±4.9) m3/t, highlighting the substantial impact of emission outliers on posterior CH4 emissions. A comparative analysis with EFs from other studies demonstrated that this value closely aligns with the EF values for coal with low CH4 content. However, it is important to note that substantial regional variability of coal mining activities can result in significant uncertainty in EFs across different areas. Therefore, we underscore the necessity of establishing a more extensive atmospheric CH4 observation network to enhance the assessment of regional variations in CH4 EFs and emissions from coal mining activities.
After the initial prevention of COVID-19 in early 2020, China gradually lifted its control measures in the latter half of 2020, leading to a rebound in anthropogenic CO2 emissions. However, the emergence of a COVID-19 variant in late 2021, particularly in densely populated and economically developed areas, prompted the reimplementation of stringent confinement measures. Furthermore, with the policy shift towards achieving "herd immunity", China fully lifted pandemic control measures in December 2022, resulting in the unrestricted movement of residents and facilitating the widespread transmission of COVID-19 in the ensuing months. But to our knowledge, no studies have yet quantified the relative changes in CO2 emissions during these successive phases, representing a significant knowledge gap in understanding the impact of varying control measures on anthropogenic CO2 emissions at both city and regional scales. Consequently, we selected Hangzhou city and the Yangtze River Delta (YRD) region as our study area due to their status as economically developed and densely populated regions in China. In order to mitigate the influence of biological CO2 flux, we utilized wintertime atmospheric CO2 observations at two urban and rural sites, along with their gradient, across three years (December 2020-February 2023). We employed two distinct methods with the WRF-STILT model to quantify the relative changes in CO2 emissions. Our findings indicate that (1) atmospheric CO2 concentrations at both sites and their gradients in 2022 were significantly lower than those observed in 2020, with modeled simulations using consistent emissions suggesting that changes in emissions were the predominant factor rather than variations in atmospheric transport processes; (2) After applying the source region partition method, anthropogenic CO2 emissions during the winter of 2021 decreased to 69.8 % ± 1.6 % in Hangzhou city when compared with 2020, while emissions in the YRD region dropped to 92.5 % ± 6.2 %. In winter 2022, emissions in Hangzhou city decreased to 79.9 % ± 1.9 %, and YRD region decreased to 82.0 % ± 7.2 % relative to 2020, highlighting substantial spatial heterogeneity from the city to the regional scale; (3) notably, the observed decreases in CO2 emissions in both Hangzhou and the YRD were not reflected in prior inventories, which indicated an annual increase of 8 % for 2021 and 2022, suggesting that even the most recent inventories fail to account for the prolonged emission reduction effects occurring over the preceding three years.
On the basis of the vehicle-carried mobile observation method, we conducted CO2 and CH4 observations in Hangzhou city during different periods before, during and after the Asian Games in autumn 2023. Both the difference between urban and rural monitoring station data and the difference between mobile observation and urban background station data during the period of emission reduction implementation were used as quantitative indicators of policy effectiveness. The differences in the CO2 and CH4 concentrations between the mobile observations and the background values exhibited the order of during the Asian Games < before the Asian Games < after the Asian Games, and the differences between the urban and rural observation station values decreased during the Asian Games, indicating the effectiveness of the emission reduction measures. Additionally, the differences in the CO2 and CH4 concentrations between the mobile observations and background values revealed different spatial variation characteristics before, during and after the Asian Games. This demonstrates that emission reduction measures do not yield exactly the same effectiveness for greenhouse gases from diverse emission sources. Moreover, the wind speed, wind direction and boundary layer height may negatively affect the effectiveness of emission reduction. To obtain better results, emission reduction measures must continue over a longer period.
The use of high-albedo roof materials is a simple and effective way to reduce roof temperature, conserve electricity required for air conditioning, and ease power shortages. In this study, three common cooling roof materials, namely, white elastomeric acrylic (AC) paint, a white thermoplastic polyolefin (TPO) membrane, and an aluminum foil composite film-covered styrene-butadiene-styrene bituminous (SBS) membranes, were chosen to conduct a nearly 4-yr experiment in Nanjing, China, to study the difference in surface temperatures (DTs) between the cooling roof materials and concrete. The results showed that even during heatwaves, DTs was only 2.1 degrees C (AC), 3.8 degrees C (TPO), and 7.0 degrees C (SBS) on average and 6.9 degrees-18.2 degrees C to the greatest extent, which was far less than those reported by many studies. The intensity of solar radiation where the cooling roof material is used and the roof material's albedo contribute to the difference in DTs. The initial albedo of the AC was 0.53 and dropped to 0.16 due to rapid aging, which is close to that of concrete, in less than 3 months. The albedo of TPO and SBS dropped to 0.16 after 9 and 4.7 years, respectively. Further, SBS is the optimal choice in terms of cost and performance, costing only USD 0.67 m22 yr21. However, its albedo exhibits seasonal fluctua-tions and is significantly affected by air pollution. In particular, particulate matter settles on the surface, thereby decreasing the albedo. Nevertheless, manual cleaning can recover the albedo, extend service life, and further reduce costs.
Aquaculture ponds are inland small water bodies subject to human activities. They are not only carbon sources, but important sources of regional water evaporation. Accurate observation of carbon and water fluxes in aquaculture ponds is the basis for quantifying carbon emission and evaporation contribution of inland water. Nanjing University of Information Science and Technology set up an atmospheric environment experiment site to observe the carbon and water flux over aquaculture water bodies in Guandu Village of Quanjiao County, Anhui Province. This dataset includes the CO2 flux data (measured by the multi-channel closed dynamic floating chamber method), CH4 flux data (measured by the eddy covariance method, multi-channel closed dynamic floating chamber method, and inverted funnel method), latent heat and sensible heat fluxes data (measured by the eddy covariance method), as well as key environmental factors data, such as air temperature, water temperature, and radiation. All data were processed by standardized procedures. Moreover, data quality controls were performed. This dataset can provide important data for accurately estimating carbon emission and evaporation contribution in regional and global inland small water bodies.
Nowadays, great uncertainty still exists on the urban- and regional-scale anthropogenic CO2 emission estimation based on emission inventories. In order to achieve the carbon peaking and neutrality targets for China, it is urgent to accurately estimate anthropogenic CO2 emissions at regional scales, especially in large urban agglomerations. Using two inventories (EDGAR v6.0 inventory and a modified inventory combining EDGAR v6.0 with GCG v1.0) as prior anthropogenic CO2 emission datasets andtaking themas input data respectively, this study utilized the WRF-STILT atmospheric transport model to simulate atmospheric CO2 concentration in the Yangtze River Delta region from December 2017 to February 2018. The simulated atmospheric CO2 concentrations were further improved by referencing atmospheric CO2 concentration observation at a tall tower in Quanjiao County of Anhui Province and using the scaling factors obtained from the Bayesian inversion method. An estimation of anthropogenic CO2 emission flux in the Yangtze River Delta regionwas finally accomplished. The results indicated that:①in winter, in comparison to the atmospheric CO2 concentration simulated based on EDGAR v6.0, the atmospheric CO2 concentration simulated based on the modified inventory was more consistent with observed values. ②The simulated atmospheric CO2 concentration was higher than observation at night and lower than observation during the daytime. The CO2 emission data of emission inventories could not fully reflect the diurnal variation in anthropogenic emissions, andtheoverestimation, caused by the simulated low-atmospheric boundary layer height at night, of the contribution from point sources with higher emission height near the observation station were the main reasons. ③The simulation performance on atmospheric CO2 concentration was greatly affected by the emission bias of the EDGAR grid points that significantly contributed to concentrations of the observation station, and this indicated that the uncertainty in the spatial distribution in EDGAR emission was the main factor influencing the simulation accuracy. ④The posterior anthropogenic CO2 emission flux in the Yangtze River Delta from December 2017 to February 2018 was around (0.184±0.006) mg·(m2·s)-1and (0.183±0.007) mg·(m2·s)-1 based on EDGAR and the modified inventory, respectively. It is suggested that the inventories with higher temporal and spatial resolutions and more accurate spatial emission distribution should be selected as the prior emissions to obtain a more accurate estimation of the regional anthropogenic CO2 emissions.
基于车载激光气体分析仪于2020年冬季和2021年春季在杭州道路观测近地面大气CO2和CH4浓度.结果表明:(1)城市不同区域道路近地面大气CO2浓度与城市背景站差值(ΔCO2)的排序为工业区>商业居民混合区>沿江住宅区>自然风景区,而CH4差值(ΔCH4)的排序为沿江住宅区>商业居民混合区>工业区>自然风景区,这说明城市CO2和CH4排放源有差异.(2)城市CO2和CH4排放热点同一位置多次观测浓度均高于周边地区30%以上,且CO2和CH4浓度昼夜差异明显.(3)杭州隧道内CH4∶CO2浓度比值为(0.000912±0.00002),表明杭州主城区车辆以汽油车为主.(4)在高度约为20~30m的高架处观测的CO2浓度对于不透水面影响的空间代表范围半径为2100~3100m,普通路面近地面观测CO2浓度对于植被覆盖影响的空间代表范围半径为1900~6100m,由此可见,2000m半径对于高密度组网观测来说是较为合理的布局间隔.
利用2018年4月—2019年4月南京盘城大孔径闪烁仪(Large Aperture Scintillom-eter,LAS)观测数据,分析了城镇感热通量的时空变化特征及影响因素.结果表明:1)南京城镇感热通量呈单峰型日变化特征,白天明显大于夜间,且白天晴天明显大于阴天,夜间晴天略小于阴天,晴、阴天小时感热通量年平均分别在2.25~200.53 W·m-2、13.10~132.52 W·m-2波动.2)城镇感热通量夏季明显大于冬季,8月昼、夜分别为112.19、23.54 W·m-2,2月昼、夜分别为35.57、11.57 W·m-2.3)晴天白天条件下,不同风向(通量贡献源区)城镇感热通量存在显著差异,即随着不透水层占比的增加,净辐射分配到感热通量的比例明显提高,当占比大于60%时提高趋势不明显.4)以莫宁-奥布霍夫长度判断大气稳定度为标准,C2n 法在计算感热通量的5种大气稳定度判断方法中的误判率较低且数据源于LAS,是比较适宜城镇夜间大气稳定度的判断方法.5)在影响城镇感热通量的地表参数中,有效高度变化的影响最大,风速变化的影响较大特别在秋冬季节更为明显,波文比变化对城镇感热通量的影响较小,温度、地表粗糙度和零平面位移变化的影响可忽略不计.
为明确小型水体上的大气湍流特征和涡度相关系统的适用性,基于2018年安徽省滁州市全椒县官渡村小型农业养殖塘的通量观测数据,分析该地的大气稳定状态、湍流方差相似性、湍流速度谱和协谱、湍流强度及湍流动能的变化特征.结果表明,该小型农业养殖塘上1 d内约21 h大气处于不稳定状态;Monin-Obukhov相似理论适用于该农业养殖塘;三维风速归一化标准差随大气稳定度的变化符合1/3次方规律,不稳定条件下的拟合效果优于稳定条件下,且以垂直方向上拟合效果最佳,温度和湿度的归一化标准差在大气不稳定时符合-1/3次方规律;三维风速的湍流谱在惯性子区中符合-2/3次方关系,垂直风速与标量的协谱在惯性子区中符合-4/3次方规律,涡度相关系统能够观测该小型农业养殖塘上的感热、潜热和C02通量;该小型农业养殖塘上的湍流强度随风速衰减的速度快于大型湖泊,风速大于1m·s-1时湍流强度趋近于常数,且水平方向上的湍流强度大于垂直方向;该小型农业养殖塘上的湍流动能在中性条件下最大(3.0 m2·s-2),且以风切变贡献为主;湍流动能随风速增大而增大,并呈现昼高夜低的变化特征.上述结果可为明确小型水体上的大气湍流特征及小型农业养殖塘与大气之间能量和物质的交换机制奠定一定的理论基础.
Strict air pollution control measures were conducted during the Youth Olympic Games (YOG) period at Nanjing city and surrounding areas in August 2014. This event provides a unique chance to evaluate the effect of government control measures on regional atmospheric pollution and greenhouse gas emissions. Many previous studies have observed significant reductions of atmospheric pollution species and improvement in air quality, while no study has quantified its synergism on anthropogenic CO2 emissions, which can be co-reduced with air pollutants. To better understand to what extent these pollution control measures have reduced anthropogenic CO2 emissions, we conducted atmospheric CO2 measurements at the suburban site in Nanjing city from 1st July to 30th September 2014 and 1st August to 31st August 2015, obvious decrease in atmospheric CO2 was observed between YOG and the rest period. By coupling the a priori emission inventory with atmospheric transport model, we applied the scale factor Bayesian inversion approach to derive the posteriori CO2 emissions in YOG period and regular period. Results indicate CO2 emissions from power industry decreased by 45%, and other categories also decreased by 16% for manufacturing combusting, and 37% for non-metallic mineral production. Monthly total anthropogenic CO2 emissions were 9.8 (±3.6) × 109 kg/month CO2 for regular period and decreased to 6.2 (±1.9) × 109 kg/month during the YOG period in Nanjing city, with a 36.7% reduction. When scaling up to whole Jiangsu Province, anthropogenic CO2 emissions were 7.1 (±2.4) × 1010 kg/month CO2 for regular period and decreased to 4.4 (±1.2) × 1010 kg/month CO2 during the YOG period, yielding a 38.0% reduction.
Abstract On the coexistence of genetically modified (GM) and non‐GM maize, the isolation distance plays an important role in controlling the transgenic flow. In this study, maize gene flow model was used to quantify the MTD0.1% and MTD1% in the main maize‐planting regions of China; those were the maximum threshold distance for the gene flow frequency equal to or lower than 1% and 0.1%. The model showed that the extreme MTD1% and MTD0.1% were 187 and 548 m, respectively. The regions of northern China and the coastal plain, including Hainan crop winter‐season multiplication base, showed a significantly high risk for maize gene flow, while the west‐south of China was the largest low‐risk areas. Except for a few sites, the isolation distance of 500 m could yield a seed purity of better than 0.1% and meet the production needs of breeder seeds. The parameters of genetic competitiveness (cp) were introduced to assess the effects of hybrid compatibility between the donor and recipient. The results showed that hybrid incompatibility could minimize the risk. When cp = 0.05, MTD1% and MTD0.1% could be greatly reduced within 19 m and 75 m. These data were helpful to provide scientific data to set the isolation distance between GM and non‐GM maize and select the right place to produce the hybrid maize seeds.
Meteorological disasters have brought a great negative impact on people’s lives. With the rapid development of modern science and technology, the detection technology of meteorological disasters has been continuously improved. At present, satellite remote sensing detection technology has made gratifying achievements, and it has a good application in meteorological disaster prediction. In this paper, the application of satellite remote sensing technology in the process of meteorological disaster monitoring is discussed in depth. In traditional work, the accuracy and timeliness of meteorological disaster monitoring is the key and difficult point of meteorological disaster prevention. Using satellite telemetry to monitor meteorological disasters can effectively improve the accuracy and timeliness of meteorological disaster monitoring, provide reasonable solutions and decision-making basis for meteorological disaster prevention, and achieve the purpose of disaster prevention and mitigation. This paper introduces the basic principle, technical system, and important role of satellite remote sensing technology, expounds on the application of satellite remote sensing technology in the monitoring of agricultural meteorological disasters such as water, drought, freezing, and hail, and provides a scientific reference for farmers, agricultural sustainability, and agricultural decision-making. The continuous development of our country’s modern social economy has put forward higher requirements for agricultural production. Traditional monitoring technology can no longer meet the needs of agricultural meteorological disaster monitoring. The scientific application of remote sensing monitoring technology has important value, which can effectively improve the detection level and make it have higher accuracy and real-time performance, thereby promoting modern agricultural production in China. Based on the analysis of the application value of remote sensing monitoring technology, this paper comprehensively discusses the specific conditions of different disasters monitored by remote sensing monitoring technology in agricultural production.
基于重庆市沙坪坝(城区)和北碚(郊区)站点1959~2018年夏季(6~8月)的气象观测数据,探究重庆市城区60年高温事件的时间变化特征,分析城郊差异和暖夜日数的变化特征,并通过计算温度-湿度指数(THI)以探究湿度因子对人体不舒适度的影响.结果表明:(1)重庆市城区高温热浪20世纪60~80年代呈减少趋势,90年代开始呈增加趋势,21世纪之后大幅增加.于2006年夏季到达顶峰,热浪天数达23 d.从城郊两站的差值分析,1997年以后,城市化过程导致城郊日平均气温和日最低气温增大,表明城市在夜间的增温效应明显.相对湿度的差值增大,城市区域湿度明显降低.(2)暖夜的发生率明显大于日间高温热浪,稳定存在,最高暖夜日数发生在2013年,达33 d.在2000~2009年日间、夜间高温同时存在的天数所占比例达到了 35.73%,在2010~2018年增加到55.89%.城市化过程对重庆市城区的夜间高温产生一定影响.(3)近年来重庆地区高温高湿的日数逐渐增多.湿度对人体舒适程度存在不可忽视的影响.THI>24的所有数据中,相对湿度大于70%的天数所占的比例达到22.51%;夜间的不舒适受湿度因子的影响很大,相对湿度大于70%以上的日数日数占比为64.12%,延续了日间高温的危害.
城市是CO2、CH4等温室气体的主要来源,对全球碳收支有显著的贡献.该研究利用车载温室气体观测系统,选择了贯穿南京主城区的3条线路,进行了为期4d的大气CO2和CH4浓度的流动观测.结果表明,大气CO2与CH4浓度变化的主控因子不同,有着截然不同的时间变化特征.CO2呈现"双峰型"变化,峰值出现在早、晚高峰;而大气CH4为昼低夜高的"Ⅴ"型分布,最高值出现在凌晨.其次,大气CO2和CH4浓度存在明显的周末效应,工作日平均要比周末高.最后,大气CO2、CH4的低浓度出现频率明显高于高浓度.CO2浓度超过696.9 μmol/mol、CH4浓度超过4.7 μmol/mol的观测点仅占1.16%和1.34%,这些高值点从城市中心向四周逐渐减少.研究结果可为区域碳源、汇空间格局的分析提供数据.
作物光温反应特性是农业气象学重要的知识点,在指导花期调控方面具有很强的应用价值.鉴于传统的实验教学存在的诸多不足,将混合式学习理论应用于实践教学,基于杂交稻制种过程中的花期相遇和气象灾害问题,设计杂交稻制种播期预测虚拟仿真实验.该实验以Unity3D为开发平台,实现了水稻生长发育过程的虚拟展示,改变光温条件后可以直接观察到发育速度的变化,输入不同的父母本播种期后可以显示制种结果的差异性.实验结果表明,通过人机交互不仅加深了学生对光温反应特性的理解,更提高了学生的系统分析和综合设计能力.
 Kemin Yao (姚克敏)合作论文数School of Ecology and Applied Meteorology, Nanjing University of Information Science & Technology32
 Xiaodong Jiang (江晓东)合作论文数School of Ecology and Applied Meteorology, Nanjing University of Information Science & Technology21
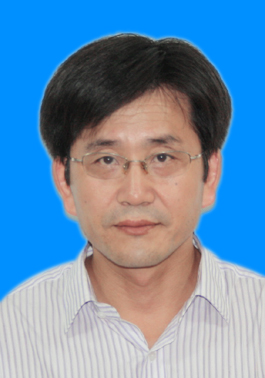 Shoudong Liu (刘寿东)合作论文数School of Ecology and Applied Meteorology, Nanjing University of Information Science & Technology20
 Chuangen Lv (吕川根)合作论文数Jiangsu Academy of Agricultural Sciences11
 Jiangshi Zou (邹江石)合作论文数Jiangsu Academy of Agricultural Sciences11
 Wei Xiao (肖薇)合作论文数School of Ecology and Applied Meteorology, Nanjing University of Information Science & Technology10
 Cheng Hu (胡诚)合作论文数College of Ecology and Environment, Nanjing Forestry University8
 Xuhui Lee合作论文数School of the Environment, Yale University;Department of Geology and Geophysics, Yale University8
 Xinwu Pei (裴新梧)合作论文数中国农业科学院生物技术研究所8
 Jichao Hu (胡继超)合作论文数School of Ecology and Applied Meteorology, Nanjing University of Information Science & Technology7
 Yongwei Wang (王咏薇)合作论文数School of Atmospheric Physics, Nanjing University of Information Science & Technology7
 Lü Chuan-Gen合作论文数7
 Qianhua Yuan (袁潜华)合作论文数School of Breeding and Multiplication, Hainan University;College of Tropical Crops, Hainan University6Gao Yunqiu合作论文数6Jiayu Zhao合作论文数5ShiJian Xia (夏士健)合作论文数5
 Shenbin Yang (杨沈斌)合作论文数School of Ecology and Applied Meteorology, Nanjing University of Information Science & Technology5
 Yongxiu Li (李永秀)合作论文数School of Ecology and Applied Meteorology, Nanjing University of Information Science & Technology5
 Mi Zhang (张弥)合作论文数School of Ecology and Applied Meteorology, Nanjing University of Information Science & Technology5Shi-Rong Jia合作论文数5
 Timothy Griffis合作论文数Department of Soil, Water, and Climate, College of Food, Agricultural and Natural Resource Sciences, University of Minnesota5Zhang XiaoCui合作论文数4MengFei Hua (华梦飞)合作论文数4
 Weihong Luo (罗卫红)合作论文数College of Agriculture, Nanjing Agricultural University4ZongZhi Lu (卢宗志)合作论文数3
 Xiaoya Yang (杨晓亚)合作论文数School of Chemistry and Materials Science, Nanjing University of Information Science & Technology3
 Chang Cao (曹畅)合作论文数School of Ecology and Applied Meteorology, Nanjing University of Information Science & Technology3
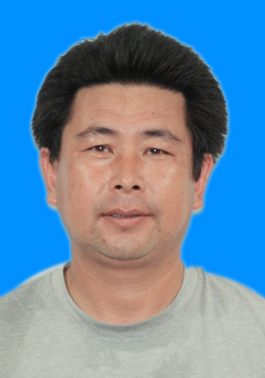 Fucun Zhang (张富存)合作论文数National Demonstration Center for Experimental Atmospheric Science and Environmental Meteorology Education, Nanjing University of Information Science & Technology3Wanlong Chen (陈万隆)合作论文数3
 Zhen Zhang (张臻)合作论文数Institute of Tibetan Plateau Research, Chinese Academy of Sciences3Yexian Zhou (周业娴)合作论文数3Zhang QiJun合作论文数2HongJu Zhang合作论文数2Huili Liu合作论文数2
 Jiaping Xu合作论文数2Yanlong Guo合作论文数2Xian-bo HAN (韩娴博)合作论文数2Shu-min WANG (王淑敏)合作论文数2WANG Lu-yao (王璐瑶)合作论文数2Rui Xu合作论文数2Bing Qi合作论文数2Xue Zhang合作论文数2Wenjing Huang合作论文数2Yongbo Hu合作论文数2Xue ZHANG (张雪)合作论文数2Zhou YU (于洲)合作论文数2WuGe Liu (柳武革)合作论文数2




