We examine the anthropogenically forced climate response for the 21st century representative concentration pathway (RCP) emission scenarios and their extensions for the period 2101-2500. The experiments were performed with ModelE2, a new version of the NASA Goddard Institute for Space Sciences (GISS) coupled general circulation model that includes three different versions for the atmospheric composition components: a noninteractive version (NINT) with prescribed composition and a tuned aerosol indirect effect (AIE), the TCAD version with fully interactive aerosols, whole-atmosphere chemistry, and the tuned AIE, and the TCADI version which further includes a parameterized first indirect aerosol effect on clouds. Each atmospheric version is coupled to two different ocean general circulation models: the Russell ocean model (GISS-E2-R) and HYCOM (GISS-E2-H). By 2100, global mean warming in the RCP scenarios ranges from 1.0 to 4.5 degrees C relative to 1850-1860 mean temperature in the historical simulations. In the RCP2.6 scenario, the surface warming in all simulations stays below a 2 degrees C threshold at the end of the 21st century. For RCP8.5, the range is 3.5-4.5 degrees C at 2100. Decadally averaged sea ice area changes are highly correlated to global mean surface air temperature anomalies and show steep declines in both hemispheres, with a larger sensitivity during winter months. By the year 2500, there are complete recoveries of the globally averaged surface air temperature for all versions of the GISS climate model in the low-forcing scenario RCP2.6. TCADI simulations show enhanced warming due to greater sensitivity to CO2, aerosol effects, and greater methane feedbacks, and recovery is much slower in RCP2.6 than with the NINT and TCAD versions. All coupled models have decreases in the Atlantic overturning stream function by 2100. In RCP2.6, there is a complete recovery of the Atlantic overturning stream function by the year 2500 while with scenario RCP8.5, the E2-R climate model produces a complete shutdown of deep water formation in the North Atlantic.
I suggest that a ‘scientific reticence’ is inhibiting the communication of a threat of a potentially large sea level rise. Delay is dangerous because of system inertias that could create a situation with future sea level changes out of our control. I argue for calling together a panel of scientific leaders to hear evidence and issue a prompt plain-written report on current understanding of the sea level change issue.
[1] We appreciate the opportunity to reply to comments and concerns raised by Tanner and Eatough [2007, hereinafter referred to as TE] on our paper [Novakov et al., 2005]. In the following we address the “major flaws” that they assert. [2] 1. TE state that our work was motivated by a need to reduce OC/EC ratios to match predominantly urban-based emissions inventories. [3] Our objective was to analyze a large number of measured OC/BC values, obtained at different locations and published in a variety of contexts. Our main finding is that ambient OC/BC ratios, taken at face value as published, decrease with BC mass concentrations for all locations. [4] 2. TE claim that we do not consider negative artifact. [5] We concluded that the positive sampling artifact may, at least qualitatively, explain the OC/BC versus BC trend. We provide proof of this explanation using data from SAFARI 2000, which unequivocally show that the OC/BC dependence on BC concentration observed with uncorrected data is removed with positive artifact-corrected values. Regarding the negative artifact, we stated that the data considered are insufficient to evaluate the effect of a negative sampling artifact on OC/BC ratios. [6] 3. TE comment that we used predominantly urban emission data for global estimates of the artifact-induced errors in reported OC/EC ratios. This, they think, implicitly assumes that the correction for gaseous organics adsorbed on the filter is the same for urban as for rural. [7] This inference is incorrect. After saturation of the filter material with organic gases is achieved, the positive artifact diminishes with continued sampling of carbonaceous particles. Thus the magnitude of the positive artifact may tend to be smallest in (urban) areas where carbon particle concentrations are highest, and is certainly not “clearly dependent of the relative amounts…of gaseous organics vis à vis particulate carbon” as TE assert. [8] 4. TE state that we have made the extraordinary assumption that OC/EC ratios should remain constant during aerosol transport from urban or source-rich regions to rural and background locations. [9] We make no assumption that OC/BC ratios are constant during aerosol transport from urban to rural areas, nor do we ignore the frequently large contribution of secondary organic aerosols. In the GISS model we account for most secondary OC, which is derived from natural biogenic emissions by assuming it to be proportional to terpene emissions. We report ratios for a variety of locations, both urban and rural, but we do not report data as a function of time after emission. Thus inferences regarding transport or changes of the OC/BC ratio as a function of time since emission cannot be made. [10] We have shown that OC/BC ratios that can be “substitutes” for the artifact-corrected values. We compared these values with OC/BC ratios calculated from published OC and BC emission inventories. This is important because compiled OC and BC emission inventories and, therefore, OC/BC ratios may be significantly uncertain especially for some global regions.
A full description of the ModelE version of the Goddard Institute for Space Studies (GISS) atmospheric general circulation model (GCM) and results are presented for present-day climate simulations (ca. 1979). This version is a complete rewrite of previous models incorporating numerous improvements in basic physics, the stratospheric circulation, and forcing fields. Notable changes include the following: the model top is now above the stratopause, the number of vertical layers has increased, a new cloud microphysical scheme is used, vegetation biophysics now incorporates a sensitivity to humidity, atmospheric turbulence is calculated over the whole column, and new land snow and lake schemes are introduced. The performance of the model using three configurations with different horizontal and vertical resolutions is compared to quality-controlled in situ data, remotely sensed and reanalysis products. Overall, significant improvements over previous models are seen, particularly in upper-atmosphere temperatures and winds, cloud heights, precipitation, and sea level pressure. Data-model comparisons continue, however, to highlight persistent problems in the marine stratocumulus regions.
Previous research has identified links between changes in sea surface temperature (SST) and hurricane intensity. We use climate models to study the possible causes of SST changes in Atlantic and Pacific tropical cyclogenesis regions. The observed SST increases in these regions range from 0.32°C to 0.67°C over the 20th century. The 22 climate models examined here suggest that century-timescale SST changes of this magnitude cannot be explained solely by unforced variability of the climate system. We employ model simulations of natural internal variability to make probabilistic estimates of the contribution of external forcing to observed SST changes. For the period 1906–2005, we find an 84% chance that external forcing explains at least 67% of observed SST increases in the two tropical cyclogenesis regions. Model “20th-century” simulations, with external forcing by combined anthropogenic and natural factors, are generally capable of replicating observed SST increases. In experiments in which forcing factors are varied individually rather than jointly, human-caused changes in greenhouse gases are the main driver of the 20th-century SST increases in both tropical cyclogenesis regions.
The month-to-month variability of tropical temperatures is larger in the troposphere than at Earth's surface. This amplification behavior is similar in a range of observations and climate model simulations and is consistent with basic theory. On multidecadal time scales, tropospheric amplification of surface warming is a robust feature of model simulations, but it occurs in only one observational data set. Other observations show weak, or even negative, amplification. These results suggest either that different physical mechanisms control amplification processes on monthly and decadal time scales, and models fail to capture such behavior; or (more plausibly) that residual errors in several observational data sets used here affect their representation of long-term trends.
Measurements of organic carbon (OC) and black carbon (BC) concentrations over a variety of locations worldwide have been analyzed to infer the spatial distributions of the ratios of OC to BC. Since these ratios determine the relative amounts of scattering and absorption, they are often used to estimate the radiative forcing due to aerosols. An artifact in the protocol for filter measurements of OC has led to widespread overestimates of the ratio of OC to BC in atmospheric aerosols. We developed a criterion to correct for this artifact and analyze corrected OC to BC ratios. The OC to BC ratios, ranging from 1.3 to 2.4, appear relatively constant and are generally unaffected by seasonality, sources, or technology changes, at the locations considered here. The ratios compare well with emission inventories over Europe and China but are a factor of 2 lower in other regions. The reduced estimate for OC/BC in aerosols strengthens the argument that reduction of soot emissions maybe a useful approach to slow global warming.
We discuss the rationale for long-term monitoring of the global distribution of natural and anthropogenic aerosols (black carbon, sulfates, mineral aerosols, etc.) and clouds with specificity, accuracy, and coverage sufficient for a reliable quantification of the direct and indirect aerosol effects on climate, the anthropogenic component of these effects, and the long-term change of these effects caused by natural and anthropogenic factors. This discussion is followed by the formulation of specific scientific objectives of the Aerosol Polarimetry Sensor component of the National Aeronautics and Space Administration's Glory Project established within the framework of the US Climate Change Research Initiative.
We use data from a unique 40-year record of 150 urban and rural stations in the “Black Smoke and SO2 Network” in Great Britain to infer information about sources of atmospheric black carbon (BC). The data show a rapid decline of ambient atmospheric BC between 1962 and the early 1990s that exceeds the decline in official estimates of BC emissions based only on amount of fuel use and mostly fixed emission factors. This provides empirical confirmation of the existence and large impact of a time-dependent “technology factor” that must multiply the rate of fossil fuel use. Current ambient BC amounts in Great Britain comparable to those in western and central Europe, with diesel engines being the principal present source. From comparison of BC and SO2 data we infer that current BC emission inventories understate true emissions in the UK by about a factor of two. The results imply that there is the potential for improved technology to achieve large reduction of global ambient BC. There is a need for comparable monitoring of BC in other countries.
Anthropogenic emissions of fine black carbon (BC) particles, the principal light‐absorbing atmospheric aerosol, have varied during the past century in response to changes of fossil‐fuel utilization, technology developments, and emission controls. We estimate historical trends of fossil‐fuel BC emissions in six regions that represent about two‐thirds of present day emissions and extrapolate these to global emissions from 1875 onward. Qualitative features in these trends show rapid increase in the latter part of the 1800s, the leveling off in the first half of the 1900s, and the re‐acceleration in the past 50 years as China and India developed. We find that historical changes of fuel utilization have caused large temporal change in aerosol absorption, and thus substantial change of aerosol single scatter albedo in some regions, which suggests that BC may have contributed to global temperature changes in the past century. This implies that the BC history needs to be represented realistically in climate change assessments.
We examine changes in tropopause height, a variable that has hitherto been neglected in climate change detection and attribution studies. The pressure of the lapse rate tropopause, pLRT, is diagnosed from reanalyses and from integrations performed with coupled and uncoupled climate models. In the National Centers for Environmental Prediction (NCEP) reanalysis, global‐mean pLRT decreases by 2.16 hPa/decade over 1979–2000, indicating an increase in the height of the tropopause. The shorter European Centre for Medium‐Range Weather Forecasts (ECMWF) reanalysis has a global‐mean pLRT trend of −1.13 hPa/decade over 1979–1993. Simulated pLRT trends over the past several decades are consistent with reanalysis results. Superimposed on the overall increase in tropopause height in models and reanalyses are pronounced height decreases following the eruptions of El Chichón and Pinatubo. Interpreting these pLRT results requires knowledge of both T(z), the initial atmospheric temperature profile, and ΔT(z), the change in this profile in response to external forcing. T(z) has a strong latitudinal dependence, as does ΔT(z) for forcing by well‐mixed greenhouse gases and stratospheric ozone depletion. These dependencies help explain why overall tropopause height increases in reanalyses and observations are amplified toward the poles. The pronounced increases in tropopause height in the climate change integrations considered here indicate that even AGCMs with coarse vertical resolution can resolve relatively small externally forced changes in tropopause height. The simulated decadal‐scale changes in pLRT are primarily thermally driven and are an integrated measure of the anthropogenically forced warming of the troposphere and cooling of the stratosphere. Our algorithm for estimating pLRT (based on a thermal definition of tropopause height) is sufficiently sensitive to resolve these large‐scale changes in atmospheric thermal structure. Our results indicate that the simulated increase in tropopause height over 1979–1997 is a robust, zero‐order response of the climate system to forcing by well‐mixed greenhouse gases and stratospheric ozone depletion. At the global‐mean level, we find agreement between the simulated decadal‐scale pLRT changes and those estimated from reanalyses. While the agreement between simulated pLRT changes and those in NCEP is partly fortuitous (due to excessive stratospheric cooling in NCEP), it is also driven by real pattern similarities. Our work illustrates that changes in tropopause height may be a useful “fingerprint” of human effects on climate and are deserving of further attention.
The authors simulate climate change for 1951 - 2050 using the GISS SI2000 atmospheric model coupled to HYCOM, a quasi-isopycnal ocean model ("ocean E''), and contrast the results with those obtained using the same atmosphere coupled to a passive Q-flux ocean model ("ocean B'') and the same atmosphere driven by observed SST ("ocean A''). All of the models give reasonable agreement with observed global temperature change during 1951 - 2000, but the quasi-isopycnal ocean E mixes heat more deeply and hence sequesters heat more effectively on the century timescale. Global surface warming in the next 50 yr is only 0.3degrees - 0.4degreesC with this ocean in simulations driven by an "alternative scenario'' climate forcing (1.1 W m(-2) in the next 50 yr), only half as much as with ocean B. From the different models the authors estimate that the earth was out of radiation balance by about 0.18 W m(-2) in 1951 and is now out of balance by about 0.75 W m(-2). This energy imbalance, or residual climate forcing, a consequence of deep ocean mixing of heat anomalies and the history of climate forcings, is a crucial measure of the state of the climate system that should be precisely monitored with full-ocean temperature measurements.
In ensembles of retrospective general circulation model (GCM) simulations, surface temperatures in the east‐central United States cool between 1951 and 1997. This cooling, which is broadly consistent with observed surface temperatures, is present in GCM experiments driven by observed time varying sea‐surface temperatures (SSTs) in the tropical Pacific, whether or not increasing greenhouse gases and other time varying climate forcings are included. Here we focus on ensembles with fixed radiative forcing and with observed varying SST in different regions. In these experiments the trend and variability in east‐central U.S. surface temperatures are tied to tropical Pacific SSTs. Warm tropical Pacific SSTs cool U.S. temperatures by diminishing solar heating through an increase in cloud cover. These associations are embedded within a year‐round response to warm tropical Pacific SST that features tropospheric warming throughout the tropics and regions of tropospheric cooling in midlatitudes. Precipitable water vapor over the Gulf of Mexico and the Caribbean and the tropospheric thermal gradient across the Gulf Coast of the United States increase when the tropical Pacific is warm. In observations, recent warming in the tropical Pacific is also associated with increased precipitable water over the southeast United States. The observed cooling in the east‐central United States, relative to the rest of the globe, is accompanied by increased cloud cover, though year‐to‐year variations in cloud cover, U.S. surface temperatures, and tropical Pacific SST are less tightly coupled in observations than in the GCM.
The stratosphere has been cooling by about 2K/decade at 30–60 km over the past several decades and by lesser amounts toward the tropopause. Climate model calculations suggest that stratospheric water vapor is an important contributor to the observed stratospheric cooling, but there are large differences among recent GCM simulations for prescribed changes in stratospheric water vapor, which point to problems with the current GCM treatment of the absorption and emission by stratospheric water vapor. We show that the correlated k‐distribution treatment with sufficient resolution is capable of simulating accurately cooling by stratospheric water vapor. We obtain equilibrium cooling of about 0.3K that extends from 20 km to the top of the atmosphere, and adjusted radiative forcing of 0.12 Wm−2, for a stratospheric water vapor increase of 0.7 ppmv which has been estimated for the period 1979–1997.
The growth rate of climate forcing by measured greenhouse gases peaked near 1980 at almost 5 W/m2 per century. This growth rate has since declined to ≈3 W/m2 per century, largely because of cooperative international actions. We argue that trends can be reduced to the level needed for the moderate “alternative” climate scenario (≈2 W/m2 per century for the next 50 years) by means of concerted actions that have other benefits, but the forcing reductions are not automatic “co-benefits” of actions that slow CO2 emissions. Current trends of climate forcings by aerosols remain very uncertain. Nevertheless, practical constraints on changes in emission levels suggest that global warming at a rate +0.15 ± 0.05°C per decade will occur over the next several decades.
Several previous studies have attempted to remove the effects of explosive volcanic eruptions and El Nino-Southern Oscillation (ENSO) variability from time series of globally averaged surface and tropospheric temperatures. Such work has largely ignored the nonzero correlation between volcanic signals and ENSO. Here we account for this collinearity using an iterative procedure. We remove estimated volcano and ENSO signals from the observed global mean temperature data, and then calculate trends over 1979-1999 in the residuals. Residual trends are sensitive to the choice of index used for removing ENSO effects and to uncertainties in key volcanic parameters. Despite these sensitivities, residual surface and lower tropospheric (2LT) trends are almost always larger than trends in the raw observational data. After removal of volcano and ENSO effects, the differential warming between the surface and lower troposphere is generally reduced. These results suggest that the net effect of volcanoes and ENSO over 1979-1999 was to reduce globally averaged surface and tropospheric temperatures and cool the troposphere by more than the surface. ENSO and incomplete volcanic forcing effects can hamper reliable assessment of the true correspondence between modeled and observed trends. In the second part of our study, we remove these effects from model data and compare simulated and observed residual trends. Residual temperature trends are not significantly different at the surface. In the lower troposphere the statistical significance of trend differences depends on the experiment considered, the choice of ENSO index, and the volcanic signal decay time. The simulated difference between surface and tropospheric warming rates is significantly smaller than observed in 51 out of 54 cases considered. We also examine multiple realizations of model experiments with relatively complete estimates of natural and anthropogenic forcing. ENSO and volcanic effects are not removed from these integrations. As in the case of residual trends, model and observed raw trends are in good agreement at the surface but differ significantly in terms of the trend differential between the surface and lower troposphere. Observed and simulated lower tropospheric trends are not significantly different in 17 out of 24 cases. Our study highlights the large uncertainties inherent in removing volcano and ENSO effects from atmospheric temperature data. It shows that statistical removal of these effects improves the correspondence between modeled and observed temperature trends over the satellite era. Accounting for volcanoes and ENSO cannot fully explain the observed warming of the surface relative to the lower troposphere, or why this differential warming is not reproduced in the model simulations considered here.
The direct-beam spectral extinction of solar radiation contains information on atmospheric composition in a form that is essentially free from the data analysis complexities that often arise from multiple scattering. Ground based Multi-Filter Shadowband Radiometer (MFRSR) measurements provide such information for the vertical atmospheric column path, while solar occultation measurements from a satellite platform provide horizontal slices through the atmosphere. We describe application of a Multi-Spectral Atmospheric Column Extinction (MACE) analysis technique that we developed to analyze MFRSR data to occultation measurements made by Stratospheric Aerosol and Gas Experiment (SAGE II). For analysis, we select the 1985 Nevado del Ruiz volcanic eruption period to retrieve atmospheric profiles of ozone and NO"2, and changes in the stratospheric aerosol size and optical depth. The time evolution of volcanic aerosol serves as a passive tracer to study stratospheric dynamics, and changes in particle size put constraints on the sulfur chemistry modeling of volcanic aerosols.
 Andrew A. Lacis合作论文数Goddard Institute for Space Studies, Goddard Space Flight Center, National Aeronautics and Space Administration16
 Reto A. Ruedy合作论文数Sciences and Exploration Directorate, Goddard Space Flight Center, National Aeronautics and Space Administration;Goddard Institute for Space Studies, National Aeronautics and Space Administration;Autonomic Integra, LLC9
 Makiko Sato合作论文数Earth Institute, Columbia Univ.7
 David H. Rind合作论文数Goddard Institute for Space Studies, National Aeronautics and Space Administration;Goddard Space Flight Center, National Aeronautics and Space Administration5
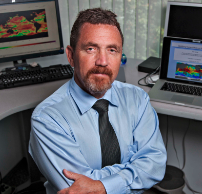 Benjamin David Santer (Benjamin D. Santer)合作论文数Lawrence Livermore National Laboratory, University of California5Gary L. Russell合作论文数NASA Goddard Institute for Space Studies5tml wigley合作论文数4
 Gavin A. Schmidt合作论文数Goddard Institute for Space Studies, National Aeronautics and Space Administration4T. Novakov合作论文数4
 Gerald Meehl合作论文数Climate and Global Dynamics Laboratory, National Center for Atmospheric Research4James S Boyle合作论文数4
 Karl E. Taylor合作论文数Program for Climate Model Diagnosis and Intercomparison, Lawrence Livermore National Laboratory4D. Koch合作论文数3
 Drew Shindell合作论文数Earth & Climate Sciences Division, Nicholas School of the Environment, Duke University;School of the Environment and Earth Sciences, Tel Aviv University;UN Environment3Surabi Menon合作论文数3
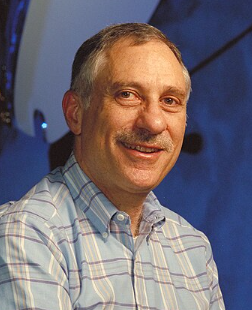 James B. Pollack合作论文数Ames Research Center, NASA3D. L. Coffeen合作论文数3
 Philip Jones合作论文数Climatic Research Unit, School of Environmental Sciences, University of East Anglia3
 Thomas W. Kirchstetter合作论文数Civil and Environmental Engineering,University of California,Berkeley3Charles Doutriaux合作论文数Lawrence Livermore National Laboratory3Peter H Stone合作论文数3V. Oinas合作论文数3
 Larry D. Travis合作论文数NASA Goddard Institute for Space Studies3j w hovenier合作论文数2Tp Barnett合作论文数2
 Shan Sun (孙山)合作论文数2Lane W A合作论文数2
 T M L Wigley合作论文数School of Biological Sciences, University of Adelaide;National Center for Atmospheric Research2
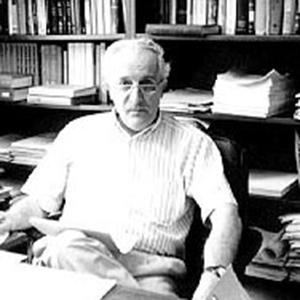 Vittorio M. Canuto合作论文数The Fu Foundation School of Engineering and Applied Science, Columbia University;Sciences and Exploration Directorate Earth Sciences Division, Goddard Space Flight Center, NASA Goddard Institute for Space Studies2
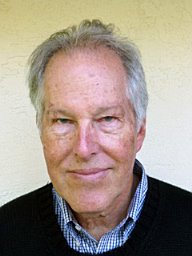 Richard Chapin James Somerville合作论文数Scripps Institution of Oceanography;University of California , San Diego;Scripps Institution of Oceanography, University of California , San Diego2
 Yuk L. Yung合作论文数Division of Geological and Planetary Sciences, California Institute of Technology2J. Lerner合作论文数2Susanne E. Bauer合作论文数Goddard Institute for Space Studies, National Aeronautics and Space Administration2
 Warren Washington合作论文数National Center for Atmospheric Research2
 M. Patrick McCormick合作论文数Center for Atmospheric Sciences, Hampton University2Kiyoshi Kawabata合作论文数2
 Anastasia Romanou合作论文数Dept . of Applied Physics and Applied Mathematics;Columbia University;Dept . of Applied Physics and Applied Mathematics, Columbia University2
 Stephen A Klein合作论文数Cloud Processes Research Group, Lawrence Livermore National Laboratory2
 Brian Cairns合作论文数NASA Goddard Institute for Space Studies2
 Michael F. Wehner合作论文数Applied Mathematics and Computational Research Division, Lawrence Berkeley National Laboratory2
 Krishna Achutarao合作论文数Centre for Atmospheric Sciences, Indian Institute of Technology Delhi;School of Public Policy2
 William J Quirk合作论文数2
 Jan P Perlwitz合作论文数Columbia University2
 S. C. B. Raper合作论文数Dalton Research Institute, Manchester Metropolitan University2Nancy Y Kiang合作论文数2Nicholas Tausnev合作论文数2
 Gregory S Faluvegi合作论文数NASA Goddard Institute for Space Studies;Center for Climate Systems Research, Columbia Climate School, Columbia University in the City of New York2Maxwell Kelley合作论文数2L. Nazarenko合作论文数2




