Methane (CH4) and carbon monoxide (CO) are gases with important climate impacts as direct and indirect greenhouse gases, respectively. Methane has a warming potential 28 times that of carbon dioxide on a 100-year timescale, and carbon monoxide is a precursor to ozone in the troposphere. Modeling trace gas concentrations in the Arctic atmosphere can be challenging due to Arctic conditions and sensitivity to long-range transport, and comparing model outputs to remote sensing measurements is essential for ensuring that models are performing well. Ground-based Arctic measurements are spatially sparse, so it is important to make use of all such available data sets. In this study, we assess eight atmospheric models, comparing their simulations of atmospheric CO and CH4 column-averaged dry-air mole fractions for 2014 and 2015 with ground-based retrievals of these species at three Arctic stations in the Total Carbon Column Observing Network (TCCON). The multi-model mean had mean biases (+/- one standard deviation of the mean) of -5.4% +/- 8% at Eureka, Canada, -6.5% +/- 8% at Ny-& Aring;lesund, Norway, and -11% +/- 7% at Sodankyl & auml;, Finland for CO, and mean biases of -0.25% +/- 0.5% at Eureka, -0.90% +/- 0.5% at Ny-& Aring;lesund, and -1.0% +/- 0.5% at Sodankyl & auml; for CH4. Individual model mean biases range from -33% to +35% for CO and -2.5% to +1.9% for CH4. These results indicate that models could benefit from improvements targeting simulations of Arctic CO.
Chemical transport models (CTM) are powerful tools to assess the health risk of population exposure to atmospheric pollutants. CTM simulations can cover large areas and provide quantitative estimates of air pollution concentrations. This is especially useful in areas where surface measurements are scarce and satellite data are acquired at low frequencies (limited to almost clear skies). However, the performance of these models is strongly dependent on the available input data. As partners in the project “Arctic Community Resilience to Boreal Environmental Change: Assessing Risks from Fire and Diseases” (ACRoBEAR), we have used the MATCH CTM, developed by the Swedish Meteorological and Hydrological Institute—SMHI, to assess the risk associated with forest fire smoke plumes. The work presented focuses on model runs for Europe from June to August 2018. The model domain covered all parts of Europe with major fires during that period, and extended well beyond the Arctic Circle. Two fire emissions inventories were used—the Copernicus GFAS product, with 0.1° × 0.1° horizontal resolution, and the FINNv2.2–NCAR inventory, with a finer spatial resolution (1 km × 1 km). The impacts of wildfire-related particulate matter on the extinction coefficient and tropospheric ozone concentrations were tested with the MATCH model. The model results are sensitive to the correction of the photolysis rate with the extinction coefficient impacting the simulated near-surface ozone concentrations by up to 50 µg m-3, on an hourly basis.
This study evaluates tropospheric columns of methane, carbon monoxide, and ozone in the Arctic simulated by 11 models. The Arctic is warming at nearly 4 times the global average rate, and with changing emissions in and near the region, it is important to understand Arctic atmospheric composition and how it is changing. Both measurements and modelling of air pollution in the Arctic are difficult, making model validation with local measurements valuable. Evaluations are performed using data from five high-latitude ground-based Fourier transform infrared (FTIR) spectrometers in the Network for the Detection of Atmospheric Composition Change (NDACC). The models were selected as part of the 2021 Arctic Monitoring and Assessment Programme (AMAP) report on short-lived climate forcers. This work augments the model–measurement comparisons presented in that report by including a new data source: column-integrated FTIR measurements, whose spatial and temporal footprint is more representative of the free troposphere than in situ and satellite measurements. Mixing ratios of trace gases are modelled at 3-hourly intervals by CESM, CMAM, DEHM, EMEP MSC-W, GEM-MACH, GEOS-Chem, MATCH, MATCH-SALSA, MRI-ESM2, UKESM1, and WRF-Chem for the years 2008, 2009, 2014, and 2015. The comparisons focus on the troposphere (0–7 km partial columns) at Eureka, Canada; Thule, Greenland; Ny Ålesund, Norway; Kiruna, Sweden; and Harestua, Norway. Overall, the models are biased low in the tropospheric column, on average by −9.7 % for CH4, −21 % for CO, and −18 % for O3. Results for CH4 are relatively consistent across the 4 years, whereas CO has a maximum negative bias in the spring and minimum in the summer and O3 has a maximum difference centered around the summer. The average differences for the models are within the FTIR uncertainties for approximately 15 % of the model–location comparisons.
The contributions to PM2.5 from different emission sectors across central Chile and the Santiago metropolitan area during summer/fall and winter have been evaluated using a chemical transport model. The simulations generally underestimate the mean PM2.5 concentrations compared to measurements conducted at stations in Santiago that belong to the Chilean National Air Quality Information System (SINCA). The potential reasons for this discrepancy include underestimated direct PM2.5 emissions, missing emissions for semi- and intermediately volatile organic compounds (SVOCs and IVOCs) and overestimated wind speeds in the simulations. The simulated winter PM2.5 concentrations in Santiago are lower and higher than the values observed during nighttime, and daytime and late evening, respectively, which may be related to excessive simulated wind speeds, as well as to uncertainties in the diurnal variation in the emissions. During summer/fall, the simulated diurnal variation better agrees with the observations, but the peak concentrations during the morning are underestimated, whereas those during the evening are overestimated. The simulated contributions of different aerosol components to the PM2.5 at one station in Santiago are all lower than the observed values, except for elemental carbon equivalent black carbon (BCe), which exhibit comparable or higher levels in the simulations. The absolute differences are the largest for the total organic matter, whereas the relative differences are the largest for BCe and ammonium. The simulated sector contributions indicate that emissions originating from transport and construction machinery dominate the PM2.5 in Santiago; however, residential wood combustion is the primary source in other urban areas of central Chile, except near major point sources. Away from urban areas, traffic routes and major industrial sources, secondary inorganic aerosol (SIA) is estimated to be the largest component of the aerosol, whereas the simulated secondary organic aerosol (SOA) only contributes a small fraction.
Abstract. Baltic Earth is an independent research network of scientists from all Baltic Sea countries that promotes regional Earth system research. Within the framework of this network, the Baltic Earth Assessment Reports (BEARs) were produced in the period 2019–2022. These are a collection of 10 review articles summarising current knowledge on the environmental and climatic state of the Earth system in the Baltic Sea region and its changes in the past (palaeoclimate), present (historical period with instrumental observations) and prospective future (until 2100) caused by natural variability, climate change and other human activities. The division of topics among articles follows the grand challenges and selected themes of the Baltic Earth Science Plan, such as the regional water, biogeochemical and carbon cycles; extremes and natural hazards; sea-level dynamics and coastal erosion; marine ecosystems; coupled Earth system models; scenario simulations for the regional atmosphere and the Baltic Sea; and climate change and impacts of human use. Each review article contains an introduction, the current state of knowledge, knowledge gaps, conclusions and key messages; the latter are the bases on which recommendations for future research are made. Based on the BEARs, Baltic Earth has published an information leaflet on climate change in the Baltic Sea as part of its outreach work, which has been published in two languages so far, and organised conferences and workshops for stakeholders, in collaboration with the Baltic Marine Environment Protection Commission (Helsinki Commission, HELCOM).
Abstract. Baltic Earth is an independent research network of scientists from all Baltic Sea countries that promotes regional Earth system research. Within the framework of this network, the Baltic Earth Assessment Reports (BEARs) were produced in the period 2019–2022. These are a collection of 10 review articles summarising current knowledge on the environmental and climatic state of the Earth system in the Baltic Sea region and its changes in the past (palaeoclimate), present (historical period with instrumental observations) and prospective future (until 2100) caused by natural variability, climate change and other human activities. The division of topics between articles follows the grand challenges and selected themes of the Baltic Earth Science Plan, such as the regional water, biogeochemical and carbon cycles, extremes and natural hazards, sea level dynamics and coastal erosion, marine ecosystems, coupled Earth system models, scenario simulations for the regional atmosphere and the Baltic Sea, and climate change and impacts of human use. Each review article contains an introduction, the current state of knowledge, knowledge gaps, conclusions and key statements, based on which recommendations are made for future research. In parallel, Baltic Earth's ongoing outreach work has led to the publication of an information leaflet on climate change in the Baltic Sea, which has been published in two languages so far, and the organisation of stakeholder conferences and workshops.
Abstract. Both measurements and modelling of air pollution in the Arctic are difficult. Yet with the Arctic warming at nearly four times the global average rate, and changing emissions in and near the region, it is important to understand Arctic atmospheric composition and how it is changing. This study examines the simulations of atmospheric concentrations of methane, carbon monoxide and ozone in the Arctic by 11 models. Evaluations are performed using data from five high-latitude ground-based Fourier transform infrared (FTIR) spectrometers in the Network for the Detection of Atmospheric Composition Change (NDACC). Mixing ratios of trace gases are modelled at three-hourly intervals by CESM, CMAM, DEHM, EMEP MSC-W, GEM-MACH, GEOS-Chem, MATCH, MATCH-SALSA, MRI-ESM2, UKESM1 and WRF-Chem for the years 2008, 2009, 2014, and 2015. The comparisons focus on the troposphere (0–7 km partial columns) at Eureka, Canada; Thule, Greenland; Ny Ålesund, Norway; Kiruna, Sweden; and Harestua, Norway. Overall, the models are biased low in the tropospheric column, on average by -9.6 % for CH4, -21 % for CO and -18 % for O3. Results for CH4 are relatively consistent across the four years, whereas CO has a maximum negative bias in the spring and minimum in the summer, and O3 has a maximum difference centred around the summer. The average differences for the models are within the FTIR uncertainties for approximately 15 % of the model-location comparisons.
Observed trends in tropospheric ozone, an important air pollutant and short-lived climate forcer (SLCF), are estimated using available surface and ozonesonde profile data for 1993-2019, using a coherent methodology, and compared to modeled trends (1995-2015) from the Arctic Monitoring Assessment Program SLCF 2021 assessment. Increases in observed surface ozone at Arctic coastal sites, notably during winter, and concurrent decreasing trends in surface carbon monoxide, are generally captured by multi-model median trends. Wintertime increases are also estimated in the free troposphere at most Arctic sites, with decreases during spring months. Winter trends tend to be overestimated by the multi-model medians. Springtime surface ozone increases in northern coastal Alaska are not simulated while negative springtime trends in northern Scandinavia are not always reproduced. Possible reasons for observed changes and model performance are discussed including decreasing precursor emissions, changing ozone dry deposition, and variability in large-scale meteorology. The Arctic is warming much faster than the rest of the globe due to increases in carbon dioxide, and other trace constituents like ozone, also an air pollutant. However, improved understanding is needed about long-term changes or trends in Arctic tropospheric ozone. A coherent methodology is used to identify trends in surface and regular profile measurements over the last 20-30 years, and results from six chemistry-climate models. Increases in observed ozone are found at the surface and in the free troposphere during winter in the high Arctic. Paradoxically, decreases in nitrogen oxide emissions at mid-latitudes appear to be leading to increases in ozone during winter, but associated increases in Arctic tropospheric ozone tend to be overestimated in the models. Increases are also found at the surface in northern Alaska during spring but not reproduced by the models. The causes are unknown but could be related to changes in local sources or sinks of Arctic ozone or in large-scale weather patterns. Declining mid-latitude emissions, or increased dry deposition to northern forests, may explain negative surface ozone trends over northern Scandinavia in spring that are not always captured by the models. Further work is needed to understand changes in Arctic tropospheric ozone. Coherent ozone trend analysis methodology applied to multi-decade, pan-Arctic surface and ozonesonde datasets and multi-model mediansIncreasing winter Arctic tropospheric ozone overestimated by models in the free troposphere, and spring surface changes not capturedSpring (summer) decreases (increases) in observed ozone throughout the troposphere, not always simulated by models
Tropospheric ozone, an important air pollutant and short-lived climate forcer, is changing globally with reported increases over emission regions that can influence ozone downwind. Here, ozone trends are examined in the Arctic troposphere, where surface warming is around four times faster than the global mean. Trends at the surface and in the free troposphere are estimated for 1993-2019 using available surface and ozonesonde data. Observed trends are also compared to modelled trends from the Arctic Monitoring Assessment Project (AMAP) multi-model evaluation, where models were run with the same anthropogenic emissions from 1990 to 2015 (Whaley et al., 2022, ACP). Findings include observed increases in annual mean surface ozone at Arctic coastal sites notably driven by increases during winter that are concurrent with decreasing surface carbon monoxide trends. Positive trends are also diagnosed at most high-Arctic ozonesonde sites in the wintertime free troposphere (up to 400 hPa). These ozone increases, which tend to be overestimated by the multi-model median (MMM) trends, are likely to be due to reductions in anthropogenic emission of nitrogen oxides at mid-latitudes leading to less ozone titration and influencing northern hemispheric ozone. Springtime increases are also found at the surface in northern coastal Alaska/Greenland but not in the MMMs. Causes are unknown but may be related to changing Arctic sea-ice or weather patterns affecting ozone sources or sinks. In contrast, surface ozone trends in northern Scandinavia are negative during spring, likely a response to decreasing ozone precursor emissions in Europe. MMM trends are also negative but generally overestimated. Springtime trends in the free troposphere also tend to be negative while summer trends are positive. Changes in ozone precursor emissions, the downward stratospheric ozone flux or general circulation may be contributing to these seasonal variations in the trends. The implications of these reported trends and model behaviour are discussed.
In the summer of 2018, Sweden experienced widespread wildfires, particularly in the region of Jämtland Härjedalen during the final weeks of July. We previously conducted an epidemiological study and investigated acute respiratory health effects in eight municipalities relation to the wildfire air pollution. In this study, we aimed to estimate the potential health impacts under less favorable conditions with different locations of the major fires. Our scenarios focused on the most intense plume from the 2018 wildfire episode affecting the largest municipality, which is the region’s only city. Combining modeled PM2.5 concentrations, gridded population data, and exposure–response functions, we assessed the relative increase in acute health effects. The cumulative population-weighted 24 h PM2.5 exposure during the nine highest-level days reached 207 μg/m3 days for 63,227 inhabitants. We observed a small number of excess cases, particularly in emergency unit visits for asthma, with 13 additional cases compared to the normal 12. Overall, our scenario-based health impact assessment indicates minor effects on the studied endpoints due to factors such as the relatively small population, limited exposure period, and moderate increase in exposure compared to similar assessments. Nonetheless, considering the expected rise in fire potential due to global warming and the long-range transport of wildfire smoke, raising awareness of the potential health risks in this region is important.
The vertical structure of temperature in the troposphere is closely related to PM2.5 concentration in polluted regions, with temperature inversions associated to higher PM2.5 at the surface. This fact is more relevant in places surrounded by mountains, like Santiago de Chile, where high pollution events are common in winter. A char-acterization of the vertical profile of PM2.5 and temperature has been carried out in winter and spring with an unmanned aerial vehicle. Temperature inversions up to 400 m were found only in winter, with full inversions associated to the highest PM2.5 at the surface. Days with full inversion are also characterized by very low wind speeds. In most cases, PM2.5 decreased rapidly with altitude, even when there was mixing layer of considerable height. Consequently, PM2.5 above 300 m was always low, in contrast to other studies, indicating that there are factors that influence the vertical concentration of PM2.5 which are still not well understood. Chemistry transport model (CTM) simulated vertical profiles of PM2.5 agrees qualitatively well with observed concentration profiles in spring, but there is a negative bias in comparison to the measured data and also a stronger simulated vertical gradient than observed. In winter, average simulated PM2.5 concentrations at the surface are similar to observed, but with increasing altitude the simulated data decline faster than measured.
As the third most important greenhouse gas (GHG) after carbon dioxide (CO2) and methane (CH4), tropospheric ozone (O3) is also an air pollutant causing damage to human health and ecosystems. This study brings together recent research on observations and modeling of tropospheric O3 in the Arctic, a rapidly warming and sensitive environment. At different locations in the Arctic, the observed surface O3 seasonal cycles are quite different. Coastal Arctic locations, for example, have a minimum in the springtime due to O3 depletion events resulting from surface bromine chemistry. In contrast, other Arctic locations have a maximum in the spring. The 12 state-of-the-art models used in this study lack the surface halogen chemistry needed to simulate coastal Arctic surface O3 depletion in the springtime; however, the multi-model median (MMM) has accurate seasonal cycles at non-coastal Arctic locations. There is a large amount of variability among models, which has been previously reported, and we show that there continues to be no convergence among models or improved accuracy in simulating tropospheric O3 and its precursor species. The MMM underestimates Arctic surface O3 by 5 % to 15 % depending on the location. The vertical distribution of tropospheric O3 is studied from recent ozonesonde measurements and the models. The models are highly variable, simulating free-tropospheric O3 within a range of ±50 % depending on the model and the altitude. The MMM performs best, within ±8 % for most locations and seasons. However, nearly all models overestimate O3 near the tropopause (∼300 hPa or ∼8 km), likely due to ongoing issues with underestimating the altitude of the tropopause and excessive downward transport of stratospheric O3 at high latitudes. For example, the MMM is biased high by about 20 % at Eureka. Observed and simulated O3 precursors (CO, NOx, and reservoir PAN) are evaluated throughout the troposphere. Models underestimate wintertime CO everywhere, likely due to a combination of underestimating CO emissions and possibly overestimating OH. Throughout the vertical profile (compared to aircraft measurements), the MMM underestimates both CO and NOx but overestimates PAN. Perhaps as a result of competing deficiencies, the MMM O3 matches the observed O3 reasonably well. Our findings suggest that despite model updates over the last decade, model results are as highly variable as ever and have not increased in accuracy for representing Arctic tropospheric O3.
While carbon dioxide is the main cause for global warming, modeling short-lived climate forcers (SLCFs) such as methane, ozone, and particles in the Arctic allows us to simulate near-term climate and health impacts for a sensitive, pristine region that is warming at 3 times the global rate. Atmospheric modeling is critical for understanding the long-range transport of pollutants to the Arctic, as well as the abundance and distribution of SLCFs throughout the Arctic atmosphere. Modeling is also used as a tool to determine SLCF impacts on climate and health in the present and in future emissions scenarios. In this study, we evaluate 18 state-of-the-art atmospheric and Earth system models by assessing their representation of Arctic and Northern Hemisphere atmospheric SLCF distributions, considering a wide range of different chemical species (methane, tropospheric ozone and its precursors, black carbon, sulfate, organic aerosol, and particulate matter) and multiple observational datasets. Model simulations over 4 years (2008–2009 and 2014–2015) conducted for the 2022 Arctic Monitoring and Assessment Programme (AMAP) SLCF assessment report are thoroughly evaluated against satellite, ground, ship, and aircraft-based observations. The annual means, seasonal cycles, and 3-D distributions of SLCFs were evaluated using several metrics, such as absolute and percent model biases and correlation coefficients. The results show a large range in model performance, with no one particular model or model type performing well for all regions and all SLCF species. The multi-model mean (mmm) was able to represent the general features of SLCFs in the Arctic and had the best overall performance. For the SLCFs with the greatest radiative impact (CH4, O3, BC, and SO42-), the mmm was within ±25 % of the measurements across the Northern Hemisphere. Therefore, we recommend a multi-model ensemble be used for simulating climate and health impacts of SLCFs. Of the SLCFs in our study, model biases were smallest for CH4 and greatest for OA. For most SLCFs, model biases skewed from positive to negative with increasing latitude. Our analysis suggests that vertical mixing, long-range transport, deposition, and wildfires remain highly uncertain processes. These processes need better representation within atmospheric models to improve their simulation of SLCFs in the Arctic environment. As model development proceeds in these areas, we highly recommend that the vertical and 3-D distribution of SLCFs be evaluated, as that information is critical to improving the uncertain processes in models.
A tighter integration of modeling frameworks for climate and air quality is urgently needed to assess the impacts of clean air policies on future Arctic and global climate. We combined a new model emulator and comprehensive emissions scenarios for air pollutants and greenhouse gases to assess climate and human health co-benefits of emissions reductions. Fossil fuel use is projected to rapidly decline in an increasingly sustainable world, resulting in far-reaching air quality benefits. Despite human health benefits, reductions in sulfur emissions in a more sustainable world could enhance Arctic warming by 0.8 °C in 2050 relative to the 1995–2014, thereby offsetting climate benefits of greenhouse gas reductions. Targeted and technically feasible emissions reduction opportunities exist for achieving simultaneous climate and human health co-benefits. It would be particularly beneficial to unlock a newly identified mitigation potential for carbon particulate matter, yielding Arctic climate benefits equivalent to those from carbon dioxide reductions by 2050.
During the summer of 2018 Sweden experienced a high occurrence of wildfires, most intense in the low-densely populated Jämtland Härjedalen region. The aim of this study was to investigate any short-term respiratory health effects due to deteriorated air quality generated by the smoke from wildfires. For each municipality in the region Jämtland Härjedalen, daily population-weighted concentrations of fine particulate matter (PM2.5) were calculated through the application of the MATCH chemistry transport model. Modelled levels of PM2.5 were obtained for two summer periods (2017, 2018). Potential health effects of wildfire related levels of PM2.5 were examined by studying daily health care contacts concerning respiratory problems in each municipality in a quasi-Poisson regression model, adjusting for long-term trends, weekday patterns and weather conditions. In the municipality most exposed to wildfire smoke, having 9 days with daily maximum 1-h mean of PM2.5 > 20 μg/m3, smoke days resulted in a significant increase in daily asthma visits the same and two following days (relative risk (RR) = 2.64, 95% confidence interval (CI): 1.28–5.47). Meta-estimates for all eight municipalities revealed statistically significant increase in asthma visits (RR = 1.68, 95% CI: 1.09–2.57) and also when grouping all disorders of the lower airways (RR = 1.40, 95% CI: 1.01–1.92).
Near Santiago de Chile and towards the Andes Mountains there are several areas sensitive to contamination, such as, the Natural Sanctuary Yerba Loca, National Park Rio Clarillo, several glaciers and the Farellones ski resort. The health of the glaciers is very important, because a large fraction of the water supply of Santiago is provided by them. To study the influence of Santiago's contamination on the glaciers, a black carbon monitoring campaign was performed from December 2014 (summer) until July 2015 (winter). Four monitors were placed between the city and the glaciers in the mountain along with meteorological stations. An analysis of the measurements indicates a direct transport of black carbon between Santiago de Chile and the Andes Mountains with a travel time of about 11 h in summer and 9 h in winter. Black carbon concentration at the mountain (La Parva) is higher in summer and lower in winter, a trend that is opposite to any other city in Chile. This is the only town in Chile in which transport, not local emissions, is mostly responsible for the BC observed. The fraction of BC in La Parva compared to Las Condes in the eastern part of Santiago changes from 14% in December to 2% in July. Model simulations of black carbon using high resolution meteorological data generated by a regional climate model confirms the difference in summertime and wintertime transport of black carbon from Santiago to La Parva. In December (summer) emissions from Santiago are estimated to contribute with 51% to the concentrations in La Parva while nearby sources from mining activities and long distance transport from other sources in central Chile contributes with 37 and 12% respectively. In July (winter) simulated contributions are dominated by long range transport from other sources with a 50% contribution while simulated contributions from sources in Santiago and from mining are both 25%. The contribution from mining activities is uncertain due to inaccuracies in simulated wind speed and direction in the mountains and too coarse model resolution and therefore warrants further investigation.
 Camilla Andersson合作论文数23
 Magnuz Engardt合作论文数Swedish Meteorological and Hydrological Institute22
 K. S. Law合作论文数15
 Robert Bergström合作论文数Meteorological Research Unit, Swedish Meteorological and Hydrological Institute;Research Department, Swedish Meteorological and Hydrological Institute14
 Steve R. Arnold合作论文数School of Earth and Environment, Faculty of Environment, University of Leeds13
 Maria Sand合作论文数CICERO Ctr Int Climate & Environm Res10
 Jesper H. Christensen合作论文数University of Copenhagen;National Environmental Research Institute;University of Aarhus;University of Copenhagen, University of Aarhus10
 S. Tsyro合作论文数9
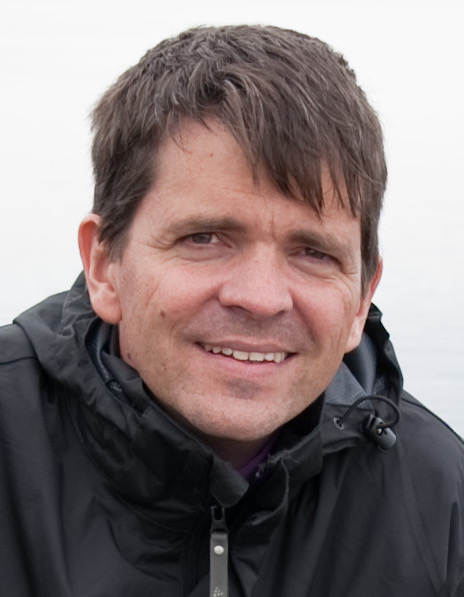 Michael Gauss合作论文数Department of Research and Development, Norwegian Meteorological Institute9Lennart Robertson合作论文数9
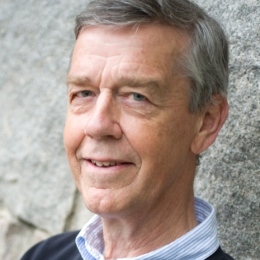 Henning Rodhe合作论文数Department of Meteorology, Stockholm University9
 Jean-Christophe Raut合作论文数Laboratoire Atmosphères, Milieux, Observations Spatiales, Sorbonne Université9
 Mark Flanner合作论文数Department of Climate and Space Sciences and Engineering, College of Engineering, University of Michigan8Christer Persson合作论文数Division of Transport and Systems Analysis, Department of Urban Planning and Environment, School of Architecture and the Built Environment, KTH Royal Institute of Technology8Naga Oshima合作论文数7
 Cynthia Whaley合作论文数Department of Physics, Faculty of Arts and Science, University of Toronto7
 Henrik Skov合作论文数7
 Manu Anna Thomas合作论文数7David A. Plummer合作论文数Canadian Centre for Climate Modelling and Analysis, Environment and Climate Change Canada;Canadian Meteorological Centre, Environment and Climate Change Canada;Climate Research Division, Environment and Climate Change Canada7
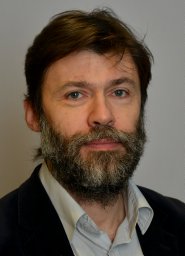 Mikhail Sofiev合作论文数Finnish Meteorological Institute7
 Joana Soares合作论文数7
 Terje Koren Berntsen合作论文数Department of Geosciences, The Faculty of Mathematics and Natural Sciences, University of Oslo7
 Håkan Pleijel合作论文数Inst f Biol o Miljovet, Goteborgs Universitet7
 Knut von Salzen合作论文数Canadian Centre for Climate Modelling and Analysis, Environment Canada;Department of Atmospheric and Climate Science, University of Washington;School of Earth and Ocean Sciences (SEOS), University of Victoria7Tatsuo Onishi合作论文数6
 Jan H. Christensen合作论文数Department of Plant and Environmental Sciences, Exercise and Sports, Faculty of Science, University of Copenhagen6
 Louis Marelle合作论文数UVSQ, Sorbonne Univ6
 Luca Pozzoli合作论文数Eurasia Institute of Earth Sciences, Istanbul Technical University6
 Lars Gidhagen合作论文数Gidhagen Consulting AB6
 Jens Hjorth合作论文数Department of Environmental Science, Aarhus University6
 Joshua S. Fu合作论文数Department of Civil and Environmental Engineering, University of Tennessee;Bredesen Center for Interdisciplinary Research and Graduate Education, University of Tennessee;Computational Sciences and Engineering Division, Oak Ridge National Laboratory6
 Annica Ekman合作论文数Department of Meteorology, Stockholm University6
 Camilla Geels合作论文数Department of Atmospheric Environment, NERI6Peter Wind合作论文数6Hans-Christen Hansson合作论文数Department of Nuclear Physics, Lund Institute of Science and Technology6Rong-You Chien合作论文数5
 Alexander A. Baklanov合作论文数Niels Bohr Institute, University of Copenhagen;Research Department, World Meteorological Organization;Science and Innovation Department, World Meteorological Organization5
 Steven Turnock合作论文数5
 Xinyi Dong (董新奕)合作论文数School of Atmospheric Sciences, Nanjing University5
 David Simpson合作论文数Norwegian Meteorological Institute5
 Jørgen Brandt合作论文数Department of Environmental Science, Faculty of Technical Sciences, Aarhus University5
 Rashed Mahmood合作论文数Chinese Academy of Sciences, Institute of Atmospheric Physics Chinese Academy of Sciences5
 Bertil Forsberg合作论文数Karolinska Institutet, National Institute of Environmental Medicine5Wanmin Gong合作论文数5
 Sarah Anne Monks合作论文数Department of Chemistry;University of Leicester;Department of Chemistry, University of Leicester5
 Johannes Flemming合作论文数European Centre of Medium-Range Weather Forecasts (ECMWF), Shinfield Park, Reading RG2 9AX, UK5
 Bertrand Bessagnet合作论文数4Stephen Beagley合作论文数4marcus reckermann合作论文数4




