The Sub-Mesoscale Ocean Dynamics Experiment (S-MODE) is a NASA Earth Ventures Suborbital investigation designed to test the hypothesis that oceanic frontogenesis and the kilometer-scale ("submesoscale") instabilities that accompany it make important contributions to vertical exchange of climate and biological variables in the upper ocean. These processes have been difficult to resolve in observations, making model validation challenging. A necessary step toward testing the hypothesis was to make accurate measurements of upper-ocean velocity fields over a broad range of scales and to relate them to the observed variability of vertical transport and surface forcing. A further goal was to examine the relationship between surface velocity, temperature, and chlorophyll measured by remote sensing and their depth-dependent distributions, within and beneath the surface boundary layer. To achieve these goals, we used aircraft-based remote sensing, satellite remote sensing, ships, drifter deployments, and a fleet of autonomous vehicles. The observational component of S-MODE consisted of three campaigns, all conducted in the Pacific Ocean approximately 100-km west of San Francisco during 2021-23 fall and spring. S-MODE was enabled by recent developments in remote sensing technology that allowed operational airborne observation of ocean surface velocity fields and by advances in autonomous instrumentation that allowed coordinated sampling with dozens of uncrewed vehicles at sea. The coordinated use of remote sensing measurements from three aircraft with arrays of remotely operated vehicles and other in situ measurements is a major novelty of S-MODE. All S-MODE data are freely available, and their use is encouraged.
The 10th Surface Water and Ocean Topography (SWOT) Applications Meeting, held one year after the satellite's launch, highlighted significant milestones in mission progress and showcased the innovative work of SWOT Early Adopters (EA) using mission data products. Over 100 participants from diverse sectors convened to discuss operational applications leveraging SWOT's unprecedented water surface measurements. The meeting emphasized applied science efforts to enhance hydrology and oceanographic models. This summary highlights the breadth of operational and private‐sector uses of SWOT data, emphasizing its potential to drive new innovations and deliver societal benefits, such as improved water resource management, flood prediction, and climate resilience.
Ocean-surface vector winds, currents, and their interaction play critical roles in shaping many aspects of the Earth’s environment (e.g., weather, climate, marine ecosystems, and ocean health), affecting human safety and wellbeing both on land and at sea. However, there are significant capability gaps in observing winds, currents, and their interaction. At present, global gridded products of surface currents have coarse (~150 km) feature resolutions and rely on theoretical assumptions that break down near the equator. Moreover, there is no satellite that provides simultaneous wind-current measurements that are important for studying wind-current coupling and its impact on weather and climate. The “Ocean DYnamics and Surface Exchange with the Atmosphere” (ODYSEA) satellite mission concept is designed to alleviate these capability gaps. ODYSEA, proposed to NASA’s Earth System Explorers program in mid-2023, aims to provide the first-ever global measurements of total surface currents and simultaneous winds with 5-km data postings and near-daily coverage of the global ocean. ODYSEA builds on NASA’s heritage of scatterometry and the success of the airborne Doppler scatterometer flown as part of the Sub-Mesoscale Ocean Dynamics Experiment (S-MODE), NASA’s Earth Venture Suborbital-3 (EVS-3) mission. ODYSEA also leverages strong domestic and international partnerships. Here we present ODYSEA’s objectives, anticipated capabilities, and expected contributions to advance the understanding of surface current dynamics and air-sea interaction.
The Surface Water and Ocean Topography (SWOT) observatory is a complex system and contains unique systematic errors not in historical nadir altimeter observations. The errors contain expected shapes in the cross-track direction, and functional coefficients describing the shapes are correlated in the along-track direction. Existing nadir altimeter observations enable comparison to the SWOT observations. In the approach here, the SWOT error power spectral density in the along-track direction indicates the SWOT residual systematic errors are larger than nadir observed signal down to scales of 1,430 km in the PIC data and 2,500 km in the PGC data. The results guide considerations in SWOT processing and error removal.
The Sub-Mesoscale Ocean Dynamics Experiment (S-MODE) is a NASA Earth Ventures Suborbital Investigation designed to test the hypothesis that oceanic frontogenesis and the kilometer-scale ("submesoscale") instabilities that accompany it make important contributions to vertical exchange of climate and biological variables in the upper ocean. These processes have been difficult to resolve in observations and models. A necessary step toward testing the hypothesis was to make accurate measurements of upper-ocean velocity fields over a broad range of scales and to relate them to the observed variability of vertical transport and surface forcing. To achieve that, we used aircraft-based remote sensing, satellite remote sensing, ships, drifter deployments, and a fleet of autonomous vehicles. This paper will provide a brief overview of the S-MODE measurements, with a special focus on surface current measurements.
Numerical ocean circulation forecasts diverge from reality due to non-deterministic processes. Through data assimilation, ocean forecasting systems routinely make corrections to scalar ocean variables of temperature and salinity derived from ocean observations. Velocity observations, however, are vector quantities that require different processing. To assimilate existing ocean velocity observations, which generally are depth limited, vertical error covariances are needed to relate the velocity errors throughout the water column. In this paper we show a velocity assimilation approach that relies on historical observations and geostrophy to relate velocity, temperature, and salinity. Geopotential calculations transform temperature and salinity covariances into corresponding geopotential covariances. This paper describes the methods and examines details of the solution process for ocean velocity data assimilation. The approach employs two separate three-dimensional variational (3DVAR) analyses combined to create one set of initial conditions during each daily forecast cycle. The first 3DVAR analysis utilizes temperature, salinity, and sea surface height anomaly data and reduces the background error variance based on these observations. The second 3DVAR analysis uses the reduced error variance and performs velocity data assimilation using surface drifter data, and these observations further reduce the error variance of temperature and salinity for the next cycle. The second 3DVAR analysis for velocity data assimilation utilizes the new full depth error covariances. We show diagnostic results from a Gulf of Mexico simulation during extensive drifter deployments in the summer of 2020. Results reveal that the two-step data assimilation cycle applies vector velocity innovations to create increments that correct the background field towards a geostrophic balance in temperature and salinity.
Ocean surface currents are critical not only to ocean dynamics, but also to marine ecosystems, maritime navigation and safety, search and rescue, monitoring and mitigation of marine pollution including oil spills, plastic, and debris. Wind-current coupling impacts both the ocean and the atmosphere, thereby influencing weather and climate. Recent modeling studies underscore the importance of submeoscale-to-mesoscale surface currents in ocean dynamics, marine ecosystems, and air-sea interactions. However, the present observing system is inadequate in observing these currents, posing major challenges in understanding their impacts. Moreover, many operational oceanography applications require measurements of these small-scale currents over the global ocean. To reduce these knowledge and capability gaps, here we present a satellite mission concept “Ocean Dynamics and Surface Exchange with the Atmosphere” (ODYSEA) that is being proposed as a NASA Earth System Explorers satellite through a strong partnership with CNES. The mission will provide the first-ever measurements of total (geostrophic+ageostrophic) surface currents in the global ocean along with simultaneous measurements of ocean-surface vector winds. ODYSEA is designed to have a 1700-km wide swath, providing approximately daily coverage of the global ocean with 5-km postings. These measurements will provide an unprecedented opportunity to unravel the physical processes underlying small-scale ocean dynamics and air-sea interactions. ODYSEA’s near real-time data will support key operational needs such as weather and ocean forecasting, search and rescue, and seafaring.
A large deployment of drifters conducted during August-December, 2020 in the Gulf of Mexico offers a test bed for a data assimilation system developed specifically to include velocity observations. This updated Navy Coupled Ocean Data Assimilation system employs the three-dimensional variational approach and is described in part one of this two-part paper (Helber et al, 2023). In this paper, we examine the impact of velocity data assimilation on the ensuing forecasts of the ocean state including not only velocity but also temperature and salinity fields below the surface. Two high-resolution (1 km) experiments were performed in the Gulf of Mexico; one with velocity data assimilation and the other without. The resulting 48 h forecasts of temperature, salinity, and velocity are examined and compared relative to the observations being assimilated (including the inferred velocities from the drifters) and unassimilated observations of temperature, salinity, and velocity from two gliders near the drifters. In addition, we assess eddy positioning and Lagrangian trajectory separation. Comparisons of these two experiments, with and without velocity data assimilation, suggest that adding velocity observations to the assimilation increases skill in predicting velocity and the subsurface temperature and salinity.
Temperature inversions are a local vertical minimum in temperature located at a shallower depth than a local maximum. In the Northeast Pacific, several water masses are present as well as multiple mechanisms for transforming or adverting ocean temperature (cold air events, upwelling, river discharge, cross-shelf eddy transport), thus creating favorable conditions for the presence of temperature inversions. For these reasons, modeling temperature inversions is challenging. This work analyzes observations from 2020 and 2021 to characterize real inversions in the Northeast Pacific and then compares observations and model results from the U.S. Navy's Global Ocean Forecast System version 3.1 (GOFS 3.1) and two instances of the Navy Coastal Ocean Model (both with 3 km-50 level configurations and either with or without data assimilation). Temperature inversions are observed to be present in about 45% of profiles with temperature minimums between 50–150 m, temperature maximums between 75–175 m, and inversion thickness almost entirely less than 40 m. Modeled temperature inversions are present in about 5% of model-observations comparisons, with modeled minimums shallower than 50 m, modeled maximum shallower than 100 m, and inversion thickness broadly distributed between 20 m and 60 m. The models' vertical grid have coarse resolution at the depths where inversions occur. The assimilation process also low-pass filters temperature, making inversions weaker. Additional work is identified to test the impact of vertical grids on modeled inversions.
To advance predictive skill, ocean forecast systems must exploit local high resolution observations. The recent Sub-Mesoscale Ocean Dynamics Experiment (S-MODE) provides an opportunity to examine the data assimilation issues that can limit predictive skill. A unique swarm control system guided nine ocean gliders accounting for all satellite and in situ data to provide high resolution observations for three ocean forecast experiments: 1) no glider data assimilated, 2) assimilation with glider data through a previous assimilation approach, and 3) adaptive assimilation of the glider data in which smaller scales are corrected in the vicinity of the local high resolution observations. The assimilation adaptation used a spatially varying horizontal decorrelation scale enabling corrections at smaller scales where high resolution in situ data are concentrated. When measured by spatial scales along the glider paths, skill in temperature advances from scales larger than about 220 km wavelength when utilizing the glider data with prior assimilation down to scales larger than 80 km wavelength with the adaptive assimilation. Skill in salinity advances from scales of approximately 300 km to scales of 200 km, and skill in steric height advances from 140 km to 63 km. Additionally, conductivity, temperature, and depth observations from an EcoCTD instrument provide independent data for confirmation. The results imply that as ocean observing systems advance, ocean forecast systems must adapt to use local high resolution observations.
We present observation and model estimates of temperature and salinity depth‐depth cross‐correlations in two different horizontal scale regimes. Glider data from the 2021 S‐MODE pilot campaign were assimilated into an ocean simulation using a three dimensional variational algorithm. We map the glider time series into distance allowing a Fourier analysis of model errors in wavenumber space. Power spectra indicate model error variance is less than the observed variance at scales larger than approximately 250 km. Based on this result, a Gaussian filter partitions the glider and model data into larger and smaller scale series at each depth. The larger and smaller scale temperature and salinity cross‐correlations between depths are compared and contrasted. Glider and model cross‐correlations are found to be similar, implying that the model physics at scales not constrained by the observations are similar to the true world.
Current state‐of‐the art procedures for studying modeled submesoscale oceanographic features have made a strong assumption of independence between features identified at different times. Therefore, all submesoscale eddies identified in a time series were studied in aggregate. Statistics from these methods are illuminating but oversample identified features and cannot determine the lifetime evolution of the transient submesoscale processes. To this end, the authors apply the Topological Feature Tracking (TFT) algorithm to the problem of identifying and tracking submesoscale eddies over time. TFT identifies critical points on a set of time‐ordered scalar fields and associates those points between consecutive timesteps. The procedure yields tracklets which represent spatio‐temporal displacement of eddies. In this way we study the time‐dependent behavior of submesoscale eddies, which are generated by a 1‐km resolution submesoscale‐permitting model. We summarize the submesoscale eddy data set produced by TFT, which yields unique, time‐varying statistics.
Estuarine and coastal geomorphology, biogeochemistry, water quality, and coastal food webs in river-dominated shelves of the Gulf of Mexico (GoM) are modulated by transport processes associated with river inputs, winds, waves, tides, and deep-ocean/continental shelf interactions. For instance, transport processes control the fate of river-borne sediments, which in turn affect coastal land loss. Similarly, transport of freshwater, nutrients, and carbon control the dynamics of eutrophication, hypoxia, harmful algal blooms, and coastal acidification. Further, freshwater inflow transports pesticides, herbicides, heavy metals, and oil into receiving estuaries and coastal systems. Lastly, transport processes along the continuum from the rivers and estuaries to coastal and shelf areas and adjacent open ocean (abbreviated herein as “river-estuary-shelf-ocean”) regulate the movements of organisms, including the spatial distributions of individuals and the exchange of genetic information between distinct subpopulations. The Gulf of Mexico Research Initiative (GoMRI) provided unprecedented opportunities to study transport processes along the river-estuary-shelf-ocean continuum in the GoM. The understanding of transport at multiple spatial and temporal scales in this topographically and dynamically complex marginal sea was improved, allowing for more accurate forecasting of the fate of oil and other constituents. For this review, we focus on five specific transport themes: (i) wetland, estuary, and shelf exchanges; (ii) river-estuary coupling; (iii) nearshore and inlet processes; (iv) open ocean transport processes; and (v) river-induced fronts and cross-basin transport. We then discuss the relevancy of GoMRI findings on the transport processes for ecological connectivity and oil transport and fate. We also examine the implications of new findings for informing the response to future oil spills, and the management of coastal resources and ecosystems. Lastly, we summarize the research gaps identified in the many studies and offer recommendations for continuing the momentum of the research provided by the GoMRI effort. A number of uncertainties were identified that occurred in multiple settings. These include the quantification of sediment, carbon, dissolved gasses and nutrient fluxes during storms, consistent specification of the various external forcings used in analyses, methods for smooth integration of multiscale advection mechanisms across different flow regimes, dynamic coupling of the atmosphere with sub-mesoscale and mesoscale phenomena, and methods for simulating finer-scale dynamics over long time periods. Addressing these uncertainties would allow the scientific community to be better prepared to predict the fate of hydrocarbons and their impacts to the coastal ocean, rivers, and marshes in the event of another spill in the GoM.
Mesoscale eddies dominate energetics of the ocean, modify mass, heat and freshwater transport and primary production in the upper ocean. However, the forecast skill horizon for ocean mesoscales in current operational models is shorter than 10 days: eddy-resolving ocean models, with horizontal resolution finer than 10 km in mid-latitudes, represent mesoscale dynamics, but mesoscale initial conditions are hard to constrain with available observations. Here we analyze a suite of ocean model simulations at high (1/25°) and lower (1/12.5°) resolution and compare with an ensemble of lower-resolution simulations. We show that the ensemble forecast significantly extends the predictability of the ocean mesoscales to between 20 and 40 days. We find that the lack of predictive skill in data assimilative deterministic ocean models is due to high uncertainty in the initial location and forecast of mesoscale features. Ensemble simulations account for this uncertainty and filter-out unconstrained scales. We suggest that advancements in ensemble analysis and forecasting should complement the current focus on high-resolution modeling of the ocean.
In the aftermath of the Deepwater Horizon event, GoMRI-funded research consortia carried out several field campaigns in the northern Gulf of Mexico with the objectives of understanding physical processes that influence transport of oil in the ocean and evaluating the accuracy of current-generation ocean models. A variety of new instruments were created to achieve unprecedented levels of dense and overlapping datasets that span five orders of magnitude of spatial and temporal scales. The observational programs: GLAD (DeSoto Canyon, Summer 2012), SCOPE (Destin inner shelf, Winter 2013 14), LASER (DeSoto Canyon, Winter 2016) and SPLASH (Louisiana shelf, Spring 2017) were designed to capture transport by ocean currents that are not presently well resolved by operational models. The overarching objective of these experiments was to collect data from a variety of sensors (drifting, aerial and ship-board) to document the circulation and near-surface variability of fronts, where much of the surface oil tends to be concentrated. Two state-of-the-art models were also run in real-time during all the experiments; a multiply-nested Navy Coastal Ocean Model with horizontal resolutions ranging from 1 km in the outer nest down to 100 m, as well as a fully coupled atmosphere-wave-ocean model. The purpose of this submission is to summarize the advances made in both understanding and modeling the near-surface transport in the Gulf of Mexico.
We must reconcile ocean modeling capability growing exponentially while ocean observation density has not maintained pace (1) leading to seemingly degraded forecast skill when model resolution is increased (2). Ocean forecasting skill requires satellite and in situ observations continually correcting numerical model conditions(3). Observations constrain positions of larger ocean model features, while smaller features are unconstrained. We show the separation of constrained and unconstrained features as a function of spatial scale and demonstrate observation density controls the boundary between scales. Constrained scales have deterministic skill in predictions, and unconstrained scales provide skill in predicting areas of higher expected errors. Separating scales allows us to reconcile the issue.
Coordinate and resolution dependence of three second moment turbulent closure models are studied using one-dimensional Navy Coastal Ocean Model (NCOM) experiments and large eddy simulations at Ocean Station Papa. Our results suggest that finer resolution near the base of the mixed layer is critical for better model performance. A mixed layer enhanced vertical grid is proposed that outperforms both the uniform and the stretched grids with significantly fewer vertical layers used. For the new grid, the model accuracy is strongly dependent on the resolution near the base of the mixed layer, and not affected much by the total number of vertical layers used. However, given the success of the new grid, the lack of representation for the near inertial gravity waves below the mixed layer has hampered the ability of second moment turbulent closure models on accurate representation of turbulent mixing in the water column. While both the Langmuir circulation and the variation of surface heat fluxes are shown to be able to significantly change the strength of the near inertial waves, they have negligible effect on the eddy viscosity in the transition layer.
Observation space-time resolution limits the scales at which ocean forecast systems provide skillful information. The ocean processes of concern are mesoscale instabilities for which an ocean forecast system requires regular corrections of initial conditions to maintain skillful forecasts, and the observations considered are the regular satellite and in situ. Predominantly, the satellite altimeter constellation is the main observing system for this problem. We define constrained scales as those in which the forecast system has skill. The constrained scales are determined by successively filtering small-scale variability from 1 km resolution assimilative model experiments to reach a minimum error relative to ground truth data. Independent observations are from the LAgrangian Submesoscale ExpeRiment (LASER) consisting of over 1000 surface drifters persisting for three months in the Gulf of Mexico. We also vary the decorrelation scale of the assimilation system to determine the decorrelation scale that produces the smallest forecast trajectory errors. In present ocean forecast systems using regular observations, the constrained scales are larger than defined by a Gaussian filter with e-folding scale of 58 km or 1/4 power point of 220 km. The decorrelation scale of 36 km used in the assimilation second order auto-regressive correlation function provides lowest trajectory errors. Filtering unconstrained variability from the model solutions reduces trajectory errors by 20%. Published by Elsevier Ltd on behalf of COSPAR.
The Sub-Mesoscale Ocean Dynamics Experiment (S-MODE) is a NASA Earth Ventures Suborbital Investigation designed to test the hypothesis that kilometer-scale ("submesoscale") ocean eddies make important contributions to vertical exchange of climate and biological variables in the upper ocean. To test this hypothesis, S-MODE will employ a combination of aircraft-based remote sensing measurements of the ocean surface, measurements from ships, measurements from a variety of autonomous oceanographic platforms, and numerical modeling. The field campaign will consist of two month-long intensive operating periods (IOPs) that will be preceded by a smaller-scale pilot experiment to test and improve operational readiness and to compare measurements made from different platforms. The pilot experiment was delayed because of the 2020 coronavirus pandemic, and it is currently planned for October-November 2020.
 William J Teague合作论文数Naval Research Laboratory;Stennis Space Center;Naval Research Laboratory, Stennis Space Center19Scott Smith合作论文数16
 Clark David Rowley合作论文数Naval Research Laboratory, Stennis Space Center16
 Charlie N. Barron合作论文数Department of Oceanography, Texas A & M University16
 Joseph M. D'Addezio合作论文数Naval Res Lab, Sters Space Ctr14Hans E. Ngodock合作论文数14
 Tamay M. Özgökmen合作论文数Ocean Sciences Department, Rosenstiel School of Marine and Atmospheric Science, University of Miami14Angelique C. Haza合作论文数13Helga Huntley合作论文数13Andrew Poje合作论文数Division of Applied Mathematics, Brown University12
 Guillaume Novelli合作论文数Rosenstiel School of Marine and Atmospheric Sciences, University of Miami;Rosenstiel School of Marine and Atmospheric Sciences, University of Miami11A. D. Kirwan合作论文数11
 Matthew J. Carrier合作论文数11
 Brian K. Haus合作论文数Rosenstiel School of Marine and Atmospheric Science, University of Miami11
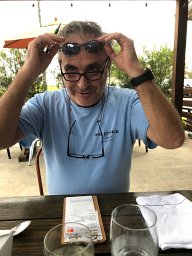 Emanuel F Coelho合作论文数10Harley Hurlburt合作论文数The University of Southern Mississippi;Florida State University;United States Naval Research Laboratory10
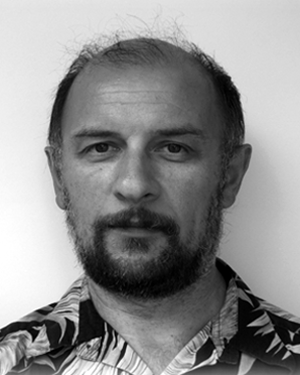 Max Yaremchuk合作论文数International Pacific Research Center;University of Hawaii;International Pacific Research Center, University of Hawaii10Robert W. Helber合作论文数10
 Mustafa Kemal Cambazoglu合作论文数9
 Edward H. Ryan合作论文数Rosenstiel School of Marine and Atmospheric Science, University of Miami9Brent Bartels合作论文数8peter l spence合作论文数8B. L. Lipphardt合作论文数8
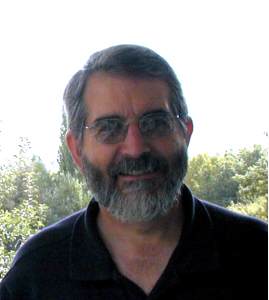 James G. Richman合作论文数Center for Ocean-Atmospheric Prediction Studies, Florida State University8
 Paul Hwang合作论文数Remote Sensing Division, United States Naval Research Laboratory
Retired8E. Joseph Metzger合作论文数Naval Research Laboratory;Stennis Space Center;Naval Research Laboratory, Stennis Space Center8
Paul Hwang合作论文数Remote Sensing Division, United States Naval Research Laboratory
Retired8E. Joseph Metzger合作论文数Naval Research Laboratory;Stennis Space Center;Naval Research Laboratory, Stennis Space Center8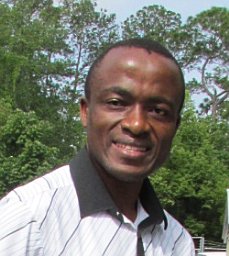 Innocent Souopgui合作论文数Universit,e Joseph Fourier7
 Annalisa Griffa合作论文数Consiglio Nazionale Delle Ricerche7
 Ad J.H.M. Reniers合作论文数Environmental Fluid Mechanics, Department of Hydraulic Engineering, Faculty of Architecture and the Built Environment, Delft University of Technology6
 Arthur J. Mariano合作论文数Rosenstiel School of Marine and Atmospheric Science, University of Miami6Pierre-Yves Le Traon合作论文数6
 I. Soto合作论文数College of Marine Science, University of South Florida6
 Andrey Shcherbina合作论文数Scripps Institution of Oceanography, University of California6
 Maria Olascoaga合作论文数Division of Applied Marine Physics;School of Marine & Atmospheric Science;University of Miami;School of Marine & Atmospheric Science, University of Miami6
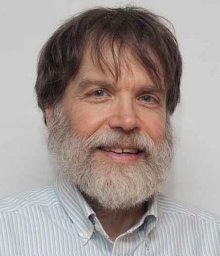 Eric A. D'Asaro合作论文数Applied Physics Laboratory and School of Oceanography,University of Washington6
 Robert Arnone合作论文数6
 Stephan Howden合作论文数Earth System Science Interdisciplinary Center, University of Maryland6
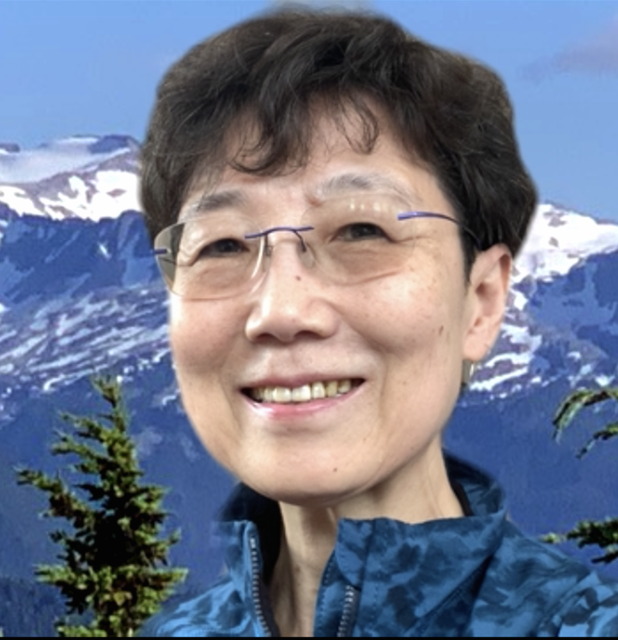 Shuyi S. Chen合作论文数Department of Atmospheric Sciences, College of the Environment, University of Washington6P. J. Hogan合作论文数5
 Milan Curcic合作论文数Univ Miami, Rosenstiel Sch Marine & Atmospher Sci, Coral Gables, FL 33124 USA5
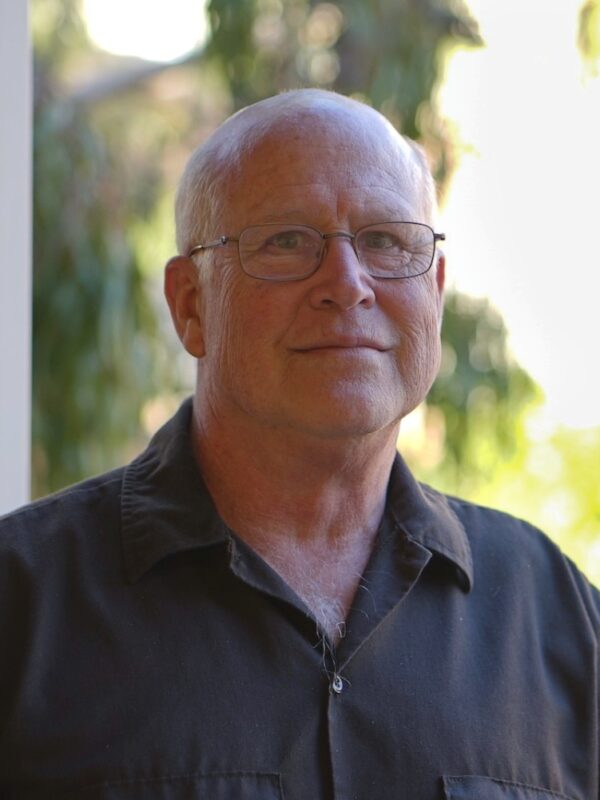 James C. McWilliams合作论文数Institute of the Environment & Sustainability, University of California, Los Angeles;Department of Atmospheric and Oceanic Sciences, University of California, Los Angeles;Nanjing University of Information Science & Technology5
 Jeroen Molemaker合作论文数Department of Atmospheric and Oceanic Sciences, College of Physical Sciences, University of California, Los Angeles5
 Arnoldo Valle-Levinson合作论文数Department of Civil & Coastal Engineering, Engineering School of Sustainable Infrastructure & Environment, University of Florida5Ernesto Rodriguez合作论文数Jet Propulsion Laboratory, California Institute of Technology5
 Nathan J. M. Laxague合作论文数5P. Hogan合作论文数5
 Jeffrey W. Book合作论文数Naval Research Laboratory, Stennis Space Center5
 David Wang合作论文数Department of Electrical and Computer Engineering, University of Waterloo5
 Mohamed Iskandarani合作论文数University of Miami5




