Growing concerns over climate change and grid reliability have led to widespread adoption of energy efficiency (EE) and demand response (DR) programs at utilities. Despite such adoption, numerous questions exist regarding the interactions between EE and DR. In this paper, we empirically examine the impact a building’s EE level (quantified by traditional EE benchmarking metrics) has on its DR capabilities (quantified by a building’s normalized load shed) for commercial buildings in California, USA. We find no evidence that a building’s EE level has an impact on DR load shed capabilities and thus demonstrate the need to reevaluate the notion that EE cannibalizes a building’s DR potential. We expand our analysis by proposing Data-Driven Operational Flexibility and Efficiency ( DOFE ) metrics that provide an alternative quantification of a building’s grid-interactive efficiency (i.e., a building’s ability to provide efficient demand-side management services to the grid). Our proposed DOFE metrics reveal statistically significant evidence that more operationally flexible buildings have higher load sheds during DR events. Our results shed light on the interactions between EE and DR in buildings and demonstrates the potential of achieving Grid-Interactive Efficient Buildings (GEB) in which improving operational flexibility and DR capabilities in buildings have synergistic benefits.
As new grid edge technologies emerge-such as rooftop solar panels, battery storage, and controllable water heaters-quantifying the uncertainties of building load forecasts is becoming more critical. The recent adoption of smart meter infrastructures provided new granular data streams, largely unavailable just ten years ago, that can be utilized to better forecast building-level demand. This paper uses Bayesian Structural Time Series for probabilistic load forecasting at the residential building level to capture uncertainties in forecasting. We use sub-hourly electrical submeter data from 120 residential apartments in Singapore that were part of a behavioral intervention study. The proposed model addresses several fundamental limitations through its flexibility to handle univariate and multivariate scenarios, perform feature selection, and include either static or dynamic effects, as well as its inherent applicability for measurement and verification. We highlight the benefits of this process in three main application areas: (1) Probabilistic Load Forecasting for Apartment-Level Hourly Loads; (2) Submeter Load Forecasting and Segmentation; (3) Measurement and Verification for Behavioral Demand Response. Results show the model achieves a similar performance to ARIMA, another popular time series model, when predicting individual apartment loads, and superior performance when predicting aggregate loads. Furthermore, we show that the model robustly captures uncertainties in the forecasts while providing interpretable results, indicating the importance of, for example, temperature data in its predictions. Finally, our estimates for a behavioral demand response program indicate that it achieved energy savings; however, the confidence interval provided by the probabilistic model is wide. Overall, this probabilistic forecasting model accurately measures uncertainties in forecasts and provides interpretable results that can support building managers and policymakers with the goal of reducing energy use.
Cities officials are increasingly interested in understanding spatial and temporal energy patterns of the built environment to facilitate their city's transition to a low-carbon future. In this paper, a new Augmented-Urban Building Energy Model (A-UBEM) is proposed that combines data-driven and physics-based simulation methods to produce synthetic hourly load curve estimates for every building within a city-similar to data an hourly smart meter would measure. By using only publicly available data, a generalizable two-step process is implemented-that other cities with similar available data can replicate-using New York City as a case study. Step (1) estimates the annual energy use for every building in the city using supervised machine learning algorithms. Step (2) extends these results and leverages physics-based simulation models through a convex optimization formulation that minimizes the squared difference between the aggregated building demand and the observed city-wide hourly electricity demand. Results from step (1) show that the Random Forest algorithm performs best with a mean log squared error of 0.293, while the convex optimization in step (2) results in a mean training error of 6.11% mean absolute percentage error (MAPE). To validate the stability of the produced load curves, Monte Carlo simulations are conducted, using random subsets of buildings from the city , which produce an out-of-sample error averaging 6.41% MAPE across each simulation . Particle swarm optimization is also explored-using the results from the Monte Carlo simulation-to assess if the model could be improved by relaxing certain constraints, but marginal error reductions are found, further proving the stability of the proposed model. Overall, A-UBEM is a first step towards creating highly granular urban-scale synthetic hourly load curves solely using open data. Such load curves are integral for planning sustainable cities and accelerating the adoption of low-carbon distributed energy resources (DERs) and district energy systems.
Buildings are by far the largest source of urban energy consumption. In an effort to reduce energy use, cities are mandating that buildings undergo energy benchmarking—the process of measuring building energy performance in order to identify buildings that are inefficient. In this paper, we examine the feasibility of using city-specific, public open data sources in two benchmarking models and compare the results to the same models when using the Commercial Building Energy Consumption Survey (CBECS) dataset, the basis for Energy Star. The two benchmarking models use datasets containing building characteristics and annual energy use from ten major cities. To examine the difference in performance between linear and non-linear models, we use random forest and lasso regression. Results demonstrate that benchmarking models using open data outperform models based solely on the CBECS dataset. Additionally, our results indicate that building area, property type, conditioned area, and water usage are the most important variables for cities to collect. Having demonstrated the benefits of using open data, we recommend two changes to current benchmarking practices: (1) new guidelines that support a data-driven benchmarking framework relying on open data and a transparent modeling process and (2) supporting policies that publicize benchmarking results and incentivize energy savings.
Energy management information systems (EMIS) play a critical role in providing actionable insights into building operations, timely feedback, and-ultimately-large energy savings. Current EMIS technologies often focus on industrial applications or require large upfront investments and trained operators, therefore greatly limiting its penetration into existing buildings. This paper integrates methods from social, building, and data sciences to understand limitations of current EMIS systems and inform the design of a new Multitiered Energy Management Performance Indicators (MEMPI) framework for characterizing the energy performance of buildings. Specifically, we employed a mixed methods research approach in which we first conduct in-depth qualitative interviews of 10 facility managers and energy consultants. We utilize the insights from our interviews to inform the design of the MEMPI framework, which harnesses highly granular data from already installed advanced metering infrastructure (AMI) (i.e., smart meters). The MEMPI framework employs quantile regression to first benchmark the energy performance of buildings to each other and generate key performance indicators (KPIs). We apply the MEMPI framework to real data from 569 public school buildings in California and measure their energy performance across multiple time scales (e.g., daily, monthly, yearly). Finally, we conduct case studies to compare insights from the MEMPI framework to the perceptions of facility managers overseeing 8 schools through a mixed methods qualitative and quantitative post-interview survey. Results from the case study show that facility managers' perceptions of the performance of their schools were largely accurate, yet the poor energy performance from certain pieces of building equipment and operating schedules was overlooked by building managers. Overall, the MEMPI framework aims to bridge the gap between data-driven energy management models and qualitative domain knowledge held by facility managers to provide more comprehensive insights into the energy performance of buildings.
In late 2019, ASHRAE hosted the Great Energy Predictor III (GEPIII) machine learning competition on the Kaggle platform. This launch marked the third energy prediction competition from ASHRAE and the first since the mid-1990s. In this updated version, the competitors were provided with over 20 million points of training data from 2,380 energy meters collected for 1,448 buildings from 16 sources. This competition’s overall objective was to find the most accurate modeling solutions for the prediction of over 41 million private and public test data points. The competition had 4,370 participants, split across 3,614 teams from 94 countries who submitted 39,403 predictions. In addition to the top five winning workflows, the competitors publicly shared 415 reproducible online machine learning workflow examples (notebooks), including over 40 additional, full solutions. This paper gives a high-level overview of the competition preparation and dataset, competitors and their discussions, machine learning workflows and models generated, winners and their submissions, discussion of lessons learned, and competition outputs and next steps. The most popular and accurate machine learning workflows used large ensembles of mostly gradient boosting tree models, such as LightGBM. Similar to the first predictor competition, preprocessing of the data sets emerged as a key differentiator.
Understanding the spatial and temporal distribution of energy consumption in cities is critical to facilitate the identification of potential energy saving opportunities and planning of new renewable and integrated district energy systems. Previous work analyzing urban building energy usage has been largely limited to either modeling of individual buildings at granular temporal scales (i.e., hourly or less) or an entire stock of urban buildings at the yearly temporal scale. While such analyses are valuable, their lack of both spatial and temporal granular modeling limits their applicability in planning and design of integrated district energy systems. This paper proposes a new urban building energy model that produces hourly demand profiles for the building stock of New York City (NYC) using only open publicly available data. First, we utilize a machine learning model to predict annual energy consumption of NYC's entire building stock from a subset of buildings that have publicly available annual energy usage data. We validate this part of the model using city-wide electricity data from New York Independent System Operator (NYISO). Results show that random forests have the best building-level prediction accuracy with a mean log squared error of 0.293. Next, we apply a novel optimization algorithm to construct temporal granular hourly profiles using the Department of Energy's commercial and residential simulation building reference sets, and the predicted annual energy values from the random forests model. Results indicate that we are able to achieve an error rate of similar to 10% (MAPE) in comparison to the overall hourly electricity profile of NYC. Moreover, we found that our iterative approach demonstrates that error rates diminish as buildings are added to the aggregated profile, which underscores the merits of applying our proposed method to model the entire building stock of a city rather than an individual building. In the end, our proposed method takes the first step of large-scale spatial and highly granular temporal characterization of urban building energy usage.
New and emerging data streams, from public databases to smart meter infrastructure, contain valuable information that presents an opportunity to develop more robust data-driven models for benchmarking energy use in buildings. In this paper, we propose a new Data-driven, Multi-metric, and Time-varying (DMT) energy benchmarking framework that utilizes these new data streams to benchmark building energy use across multiple metrics at the daily time scale. High fidelity data from smart meters enables the DMT benchmarking framework to produce daily benchmarking scores and use daily weather data to understand seasonally adjusted performance. Intra-day building efficiency is also investigated by benchmarking buildings across several metrics (e.g., total energy usage, operational energy usage, non-operational energy usage) thereby enabling deeper insights into building operations than traditional yearly benchmarking models. By using quantile regression modeling, the DMT framework can differentiate and understand the main drivers of energy consumption between low and high performing buildings and between building operational states. To illustrate the insights that can be gleaned from the proposed DMT framework, we apply the framework to understand building performance for over 500 schools throughout the state of California. The DMT framework provided insights into how various drivers impacted energy usage for both high and low performing buildings, and results indicated that schools had consistent drivers of energy usage. Overall the DMT framework was designed to be highly interpretable such that it could help bridge the gap between data science and engineering methods thus enabling better decision-making in respect to energy efficiency.
We propose a new building energy use benchmarking system to rank buildings via quantile regression. This methodology addresses several leading issues with current benchmarking practices by constructing a data-driven probabilistic model of performance, reducing outlier-effects, determining the varying effect of inputs across the distribution, and creating a theoretical maximum performance-level for each building. Influence plots constructed to examine a variable's effect on the conditional distribution can identify main drivers of energy consumption at each quantile, visually displaying any nonlinear effects on energy consumption. The methodology produces a score for each building based on efficiency, compares buildings with their constructed distribution of scores, and extracts the strongest indicators of energy use. To illustrate the model's effectiveness, we analyzed electricity consumption from a dataset containing ∼1000 buildings and found that cooling degree days and the presence of gyms, spas, and elevators were large drivers of energy use. Additionally, the number of employees per unit area had a larger effect on total energy consumption for poor performing buildings as compared to top performers. This more robust and standardized benchmarking model may improve resource allocation for energy-efficient programs, encourage competition between buildings, put pressure on poor performers, and provide insight into building energy drivers.
With the world rapidly urbanizing, addressing the energy intensive urban built environment is becoming increasingly important. Cities across the United States and the world are turning to energy benchmarking as a means of understanding the relative energy efficiency of their building stock and identifying potential opportunities to reduce energy usage. Benchmarking utilizes building characteristics and energy use data to measure a building's energy consumption against a performance baseline and derive a level of energy efficiency. Over twenty cities in the United States and many others across the world have passed laws mandating the collection and disclosure of energy use data to enable benchmarking and pinpoint potential energy saving opportunities. However, municipalities are struggling to convert this data into actionable insights and identify which buildings are prime candidates for energy efficiency interventions. Although an extensive body of work exists on benchmarking building energy performance, previous works are limited in their ability to leverage such emerging data streams and conduct analysis at the city scale. Moreover, previous methods are largely based on black-box models that limit the interpretability of results and in turn hinder the ability of policy-makers to employ such models in their policy design and decision-making processes. In this paper, we propose DUE-B, a new Data-driven Urban Energy Benchmarking methodology based on recursive partitioning and stochastic frontier analysis. To test DUE-B, we evaluate its performance using real energy and building data from over 10,000 buildings in New York City, and we compare the results to other common benchmarking models using the Kendall tau-b correlation coefficient. Results indicate that DUE-B is more robust than conventional benchmarking methods in respect to identifying subsets of efficient and inefficient buildings. Furthermore, we highlight how results from DUE-B can be utilized by municipal officials and other policy-makers to target inefficient buildings for energy efficiency interventions, incentives, and programs. Specifically, we indicate how DUE-B can be utilized by municipalities to target the most inefficient buildings for subsidized onsite energy audits and less inefficient buildings for less capital-intensive energy efficiency strategies such as incentives and educational programs. In the end, more robust benchmarking methods like DUE-B have the potential to enhance the efficacy of municipal energy efficiency programs and help transition cities to a more sustainable energy future. (C) 2018 Elsevier B.V. All rights reserved.
Cities across the country (20 to date) are rapidly passing laws to mandate the collection and disclosure of energy usage data with the hopes that such data could be utilized to benchmark building energy performance and provide a basis for designing and deploying efficiency measures. However, numerous municipalities are struggling to translate such data into actionable insights on which buildings are the best candidates for energy efficiency interventions. Current studies are limited in their ability to compare energy efficiency of buildings at the city scale and maintain interpretability necessary to result in effective decision making that can facilitate municipal policy and program design. In this paper, we present an integrated data-driven method based on recursive partitioning and stochastic frontier analysis to benchmark energy performance of building stock across an entire city. We implement the proposed method on a dataset of over 10,000 buildings in New York City. The preliminary results begin to quantify the potential for building energy efficiency and give further support to city officials for examining effects of possible interventions. We aim to establish a robust methodology that provides a standard way to benchmark building energy performance at the city scale, which can be easily applied to other cities across the country.
Cities across the country (20 to date) are rapidly passing laws to mandate the collection and disclosure of energy usage data with the hopes that such data could be utilized to benchmark building energy performance and provide a basis for designing and deploying efficiency measures. We present an integrated data-driven method based on recursive partitioning and stochastic frontier analysis to benchmark energy performance of the building stock across an entire city. We implement the proposed method to over 10,000 buildings in New York City. The preliminary results quantify the potential for building energy efficiency and support policymakers for further examining effects of interventions.
We experimentally demonstrate a novel four-channel wavelength division multiplexing transmitter operating at 1.3 μm wavelength employing heterogeneously integrated III-V/Si photonic circuit co-packaged with low-power 32-nm SOI CMOS driver integrated circuits (ICs). Error-free operation (BER <; 10 -12 ) has been achieved across all four channels for back-to-back, 2 and 10 km single-mode fiber transmission at 25 Gb/s per each channel, targeting intra-and inter-data-center interconnect applications. Power consumption as low as 19.2 mW for four CMOS driver ICs has been recorded, which yields 0.19 pJ/bit energy efficiency.
A four-channel WDM silicon photonic transmitter with integrated lasers and modulators driven by low-power 32nm CMOS drivers, is demonstrated to operate at a data rate of 4×28Gb/s with BER<10−12 and power consumption of 10.0pJ/bit.
Aurrion heterogeneous platform combines best-in-class active III-V materials for lasers, modulators and photodetectors with advanced passive components on a single chip. By leveraging existing silicon industry infrastructure for manufacturing and packaging, low-cost photonics can be closely integrated with electronics in system-in-package solutions. Such solutions are well suited to meet the demands of next generation optical interconnects.
We present a silicon photonics optical link utilizing heterogeneously integrated photonic devices driven by low-power advanced 32-nm CMOS integrated circuits. The photonic components include a quantum-confined Stark effect electroabsorption modulator and an edge-coupled waveguide photodetector, both made of III-V material wafer bonded on silicon-on-insulator wafers. The photonic devices are wire bonded to the CMOS chips and mounted on a custom PCB card for testing. We demonstrate an error-free operation at data rates up to 30 Gb/s and transmission over 10 km at 25 Gb/s with no measured sensitivity penalty and a timing margin penalty of 0.2 UI.
A four-channel electro-absorption-modulator array, driven by 32-nm CMOS drivers providing 2-V peak-to-peak output swing, operates with BER <; 10-12 at a data rate of 4 × 32 Gb/s and dissipates 170 mW of power.
 David Miller合作论文数Department of Applied Physics, Stanford University26
 Gregory Alan Fish合作论文数14
 Rebecca K. Schaevitz合作论文数11
 Brian R. Koch合作论文数11
 Rishee K. Jain合作论文数Civil & Environmental Engineering Department, Stanford University10
 James S. Harris合作论文数Department of Electrical Engineering, Stanford University;Department of Materials Science & Engineering, Stanford University;Department of Applied Physics, Stanford University10Anand Ramaswamy合作论文数Department of Electrical and Computer Engineering;University of California , Santa Barbara;Department of Electrical and Computer Engineering, University of California , Santa Barbara10
 Onur Fidaner合作论文数10Daniel K. Sparacin合作论文数Aurrion Inc8
 Joseph A. Izatt合作论文数Department of Biomedical Engineering, Duke University7
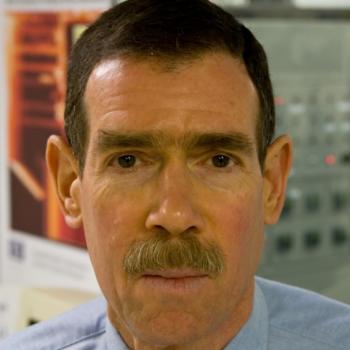 Theodore Kamins合作论文数Department of Electrical Engineering, Stanford University;Hansen Experimental Physics Laboratory, Stanford University7Robert S. Guzzon合作论文数7
 Alexander Rylyakov合作论文数Nokia6Erik Norberg合作论文数6
 Andrew Rollins合作论文数Department of Biomedical Engineering, School of Medicine, Case Western Reserve University;Center for Engineering Action, Case School of Engineering, Case Western Reserve University;Center for Imaging Research, School of Medicine, Case Western Reserve University6
 Clint Schow合作论文数Department of Electrical and Computer Engineering, College of Engineering, University of California Santa Barbara6
 Shen Ren合作论文数Solid State and Photonics Laboratory;Stanford University;Solid State and Photonics Laboratory, Stanford University6
 Jonathan Proesel合作论文数6
 Yu-Hsuan Kuo合作论文数6
 Renato Rimolo-Donadio合作论文数Rydev Inc.;Tecnológico de Costa Rica6
 Benjamin G. Lee合作论文数NVIDIA5
 Christian Baks合作论文数5
 Elizabeth H Edwards合作论文数5
 David Bour合作论文数Google;Apple5S Radhakrishnan合作论文数4V Westphal合作论文数4Ds Bardenstein合作论文数3Jh Lass合作论文数3
 Clayton Miller合作论文数Department of Building, School of Design and Environment, National University of Singapore3
 Stephanie A. Claussen合作论文数3Tasyurek Emel合作论文数3
 Zheng Yang合作论文数Sonny Astani Department of Civil & Environmental Engineering, University of Southern California3Diana Reeves合作论文数3
 Yangsi Ge合作论文数3
 Dmitry V. Dylov合作论文数Computational Imaging Lab, Skolkovo Institute of Science and Technology3
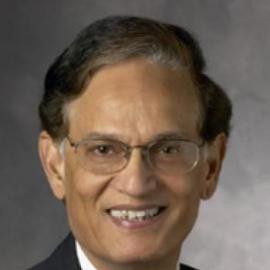 Krishna Saraswat合作论文数School of Engineering, Stanford University;Department of Electrical Engineering, Stanford University3
 Yong-Kyu Lee合作论文数3
 Ali K. Okyay合作论文数Department of Electrical Engineering;Stanford University;Department of Electrical Engineering, Stanford University3Ja Kozak合作论文数2
 Hatice Altug合作论文数Institute of Bioengineering, Ecole Polytechnique Federal de Lausanne2
 Luke Theogarajan合作论文数Department of Electrical and Computer Engineering, College of Engineering, University of California, Santa Barbara2Jacob-Mitos, Matt合作论文数2
 Nicolas Dupuis合作论文数IBM T.J.Watson Res. Center;c;IBM T.J.Watson Res. Center2
 John Bowers合作论文数Department of Electrical and Computer Engineering, College of Engineering, University of California, Santa Barbara2
 Mark Horowitz合作论文数Department of Electrical Engineering, Stanford University;Department of Computer Science, School of Engineering, Stanford University2
 Sam Palermo合作论文数Department of Electrical & Computer Engineering, College of Engineering, Texas A&M University2
 Noah C. Helman合作论文数2
 Jae-Hyuk Shin合作论文数Hallym University Sacred Heart Hospital, Hallym University2
 Alexander W. Fang合作论文数Aurrion Inc.2




