OBJECTIVE:Radiologists often face challenges in differentiating benign from malignant sacral bone lesions due to their similar imaging characteristics. This study aimed to develop an ensemble deep learning (DL) model that can preoperatively distinguish between benign and malignant sacral tumors using noncontrast computed tomography images. MATERIALS AND METHODS:Preoperative sacral CT scans from 569 patients with confirmed sacral lesions were analyzed. Data from Center 1 were utilized in model development and internal test via fivefold cross-validation, and those from Centers 2 and 3 were employed in external test. Various ensemble models combining human-readable interpretation and DL were developed. The diagnostic performance of the models and radiologists was assessed using metrics such as precision, recall, accuracy, area under the curve (AUC), F1 score, and confusion matrix. Furthermore, the clinical benefits derived from radiologists' interpretations and supported by the DL model were evaluated. RESULTS:The ensemble model, which integrates 3D-DenseNet121 with human interpretation, exhibited the most robust performance. The ensemble model demonstrated high performance on the internal and external test sets and achieved AUCs of 0.9139 and 0.8713, F1 scores of 0.9054 and 0.8571, precision of 0.9041 and 0.8824, recall of 0.9136 and 0.8333, and accuracy of 0.8630 and 0.8182, respectively. Across the external test cohort, all radiologists experienced improvements in AUC, accuracy, sensitivity, and specificity. Notably, junior radiologists demonstrated significant improvements compared with senior radiologists. CONCLUSION:The potential clinical application of the DL model lies in its capacity to considerably enhance the diagnostic efficiency of radiologists. CRITICAL RELEVANCE STATEMENT:This study presents the first ensemble deep learning model integrating 3D-DenseNet121 with radiologists' interpretation for preoperative differentiation of sacral tumors on noncontrast CT that improved diagnostic performance across all experience levels, particularly for junior radiologists. KEY POINTS:First artificial intelligence-radiologist ensemble for noncontrast computed tomography (NCCT)-based sacral tumor classification. Boosts all radiologists' performance, with the greatest gains for juniors, potentially reducing referrals. Enables reliable NCCT diagnosis, overcoming contrast/magnetic resonance imaging dependency in musculoskeletal oncology.
This study aimed to investigate the application of T2-based MRI delta-radiomics as a novel predictive tool for neoadjuvant chemotherapy (NACT) response in patients with osteosarcoma. We retrospectively analyzed data from 152 patients with pathologically confirmed osteosarcoma who underwent NACT at our institution. Axial T2-weighted MRI sequences were acquired both at baseline (pre-NACT) and after NACT (post-NACT). After image segmentation and preprocessing, 1158 radiomic features were extracted from the T2-weighted images. We developed and compared four models: the conventional quantitative imaging features-based model (CQIF model), the pre-NACT radiomics model, the post-NACT radiomics model, and the Delta-Radiomics model. Model performance was assessed using the area under the receiver operating characteristic curve (AUC) and accuracy (ACC). Based on histopathological assessment, patients were divided into two groups: good responders (n = 57) and poor responders (n = 95). Significant differences in change rates for tumor diameter and volume were observed between the two groups (P < 0.001). The Delta-Radiomics model demonstrated superior predictive performance compared to other models, achieving an AUC of 0.796, ACC of 0.756, sensitivity of 0.529, specificity of 0.893, PPV of 0.750, and NPV of 0.758 in the test set. However, the Delong test revealed no significant differences among these models, except between the Post-NACT and Delta-Radiomics models (P < 0.05). T2-based MRI delta-radiomics showed strong predictive value for NACT response in patients with osteosarcoma. This model holds potential for guiding clinical decision-making and improving patient management by identifying responders early in the treatment course.
To develop and evaluate an automated CT liver lesion-tracking algorithm that matches lesions over time, detects new metastases, and reports per‑lesion confidence to support response assessment. The study included 87 adults with unresectable colorectal liver metastases (CRLM) who had baseline and 8-week follow-up contrast-enhanced CT. Three radiologists generated a consensus reference. We developed a machine learning-driven, automated model-based lesion tracking (Auto-MBT) that provides per-lesion matching confidence. Performance was compared with: (1) deformable registration + overlap; (2) deformable registration + Auto-MBT; and (3) affine registration + Auto-MBT. Analyses were stratified by lesion size (< 1 cm, 1–3 cm, overall) and count (≤ 5, 6–10, > 10 per scan), and the triage utility of confidence scores was assessed by blinded adjudication. A publicly available melanoma dataset was used for external testing. On the CRLM test set (35 pairs), affine + Auto-MBT matched 458/464 lesions (precision/recall 99
Cancer segmentation models can fail silently, generating plausible but incorrect masks that risk missed findings or unnecessary biopsies. A critical question arises: Do AI models "know" when they are wrong, and if so, can we use the signal to predict their own failures? Humans do have a "Feeling of Error" (FOE): a spontaneous sense of unease that flags a potential error during thinking. We investigate whether cancer segmentation models exhibit an analogous internal signal. Unlike output-level cues (e.g., prediction confidence or uncertainty), which offer no insight into why a failure occurs and suffer from a sensitivity-quality tradeoff where high detection sensitivity could degrade overall segmentation quality. We instead propose to capture the model's FOE from its inner workings. Using mechanistic interpretability tools, specifically Sparse Autoencoders, we decompose internal neural activations into a dictionary of human-interpretable concepts and show that failure cases exhibit a distinct latent signature: fewer active concepts with lower activation magnitudes compared to successful segmentation. By training a classifier on these concept activations, we achieve accurate failure detection along with explanations for the model's mistakes. Experiments on prostate, pancreatic, and brain cancer segmentation demonstrate that our approach outperforms output-based methods in failure detection while preserving segmentation quality.
BACKGROUND AND PURPOSE:Radiomics extracts imaging features that may not be detectable through conventional volumetric analyses. Given their role in multiple sclerosis (MS), we applied radiomics to thalamic nuclei and examined their associations with cognitive performance. METHODS:A total of 601 individuals were included (342 people with MS [PwMS] from two cohorts and 259 healthy controls [HC]). Radiomic features (RF) and volumes were extracted from the whole thalamus, five thalamic nuclei, and the putamen segmented on three-dimensional T1-weighted images. Cognitive performance was assessed using the Symbol Digit Modalities Test (SDMT) and Paced Auditory Serial Addition Test (PASAT) in PwMS and the Digit Symbol Substitution Test (DSST) in HC. In the first MS cohort, multivariate linear regression in a discovery set (N = 103) identified thalamus-derived RF associated with SDMT, which were retested in a replication set (N = 63). Their associations with PASAT in a second MS cohort (N = 176) and DSST in HC were also evaluated. We then tested whether the same RFs, when extracted from the putamen, was associated with SDMT. Least Absolute Shrinkage and Selection Operator (LASSO) models assessed the combined predictive value of RF and volumes. RESULTS:Twenty-eight RF-region of interest (ROI) pairs were associated with SDMT in the replication set (false discovery rate [FDR] < 0.05). Of these, 24 were also associated with PASAT (FDR ≤ 0.03), and 2 with DSST. Only ventral nuclei volume showed replicated associations among volumetrics. Only four putamen-derived pairs were associated with SDMT (FDR = 0.04). LASSO results confirmed RF outperformed volumes. CONCLUSION:RF extracted from the thalamus is strongly associated with cognitive performance in PwMS, outperforming volumetric measures and supporting their potential as sensitive imaging biomarkers.
Objectives: Accurate kidney and tumor segmentation of computed tomography (CT) scans is vital for diagnosis and treatment, but manual methods are time-consuming and inconsistent, highlighting the value of AI automation. This study develops a fully automated AI model using vision transformers (ViTs) and convolutional neural networks (CNNs) to detect and segment kidneys and kidney tumors in Contrast-Enhanced (CECT) scans, with a focus on improving sensitivity for small, indistinct tumors. Methods: The segmentation framework employs a ViT-based model for the kidney organ, followed by a 3D UNet model with enhanced connections and attention mechanisms for tumor detection and segmentation. Two CECT datasets were used: a public dataset (KiTS23: 489 scans) and a private institutional dataset (Private: 592 scans). The AI model was trained on 389 public scans, with validation performed on the remaining 100 scans and external validation performed on all 592 private scans. Tumors were categorized by TNM staging as small (≤4 cm) (KiTS23: 54%, Private: 41%), medium (>4 cm to ≤7 cm) (KiTS23: 24%, Private: 35%), and large (>7 cm) (KiTS23: 22%, Private: 24%) for detailed evaluation. Results: Kidney and kidney tumor segmentations were evaluated against manual annotations as the reference standard. The model achieved a Dice score of 0.97 ± 0.02 for kidney organ segmentation. For tumor detection and segmentation on the KiTS23 dataset, the sensitivities and average false-positive rates per patient were as follows: 0.90 and 0.23 for small tumors, 1.0 and 0.08 for medium tumors, and 0.96 and 0.04 for large tumors. The corresponding Dice scores were 0.84 ± 0.11, 0.89 ± 0.07, and 0.91 ± 0.06, respectively. External validation on the private data confirmed the model’s effectiveness, achieving the following sensitivities and average false-positive rates per patient: 0.89 and 0.15 for small tumors, 0.99 and 0.03 for medium tumors, and 1.0 and 0.01 for large tumors. The corresponding Dice scores were 0.84 ± 0.08, 0.89 ± 0.08, and 0.92 ± 0.06. Conclusions: The proposed model demonstrates consistent and robust performance in segmenting kidneys and kidney tumors of various sizes, with effective generalization to unseen data. This underscores the model’s significant potential for clinical integration, offering enhanced diagnostic precision and reliability in radiological assessments.
This study aims to develop an end-to-end deep learning (DL) model to predict neoadjuvant chemotherapy (NACT) response in osteosarcoma (OS) patients using routine magnetic resonance imaging (MRI). We retrospectively analyzed data from 112 patients with histologically confirmed OS who underwent NACT prior to surgery. Multi-sequence MRI data (including T2-weighted and contrast-enhanced T1-weighted images) and physician annotations were utilized to construct an end-to-end DL model. The model integrates ResUNet for automatic tumor segmentation and 3D-ResNet-18 for predicting NACT efficacy. Model performance was assessed using area under the curve (AUC) and accuracy (ACC). Among the 112 patients, 51 exhibited a good NACT response, while 61 showed a poor response. No statistically significant differences were found in age, sex, alkaline phosphatase levels, tumor size, or location between these groups (P > 0.05). The ResUNet model achieved robust performance, with an average Dice coefficient of 0.579 and average Intersection over Union (IoU) of 0.463. The T2-weighted 3D-ResNet-18 classification model demonstrated superior performance in the test set with an AUC of 0.902 (95
BACKGROUND:Gut bacteria critically influence digestion, facilitate the breakdown of complex food substances, aid in essential nutrient synthesis, and contribute to immune system balance. However, current knowledge regarding intestinal bacteria remains insufficient. OBJECTIVE:This study aims to discover essential differences for different intestinal bacteria. METHODS:This study was conducted by investigating a total of 1478 gut bacterial samples comprising 235 Actinobacteria, 447 Bacteroidetes, and 796 Firmicutes, by utilizing sophisticated machine learning algorithms. By building on the dataset provided by Chen et al., we engaged sophisticated machine learning techniques to further investigate and analyze the gut bacterial samples. Each sample in the dataset was described by 993 unique features associated with gut bacteria, including 342 features annotated by the Antibiotic Resistance Genes Database, Comprehensive Antibiotic Research Database, Kyoto Encyclopedia of Genes and Genomes, and Virulence Factors of Pathogenic Bacteria. We employed incremental feature selection methods within a computational framework to identify the optimal features for classification. RESULTS:Eleven feature ranking algorithms selected several key features as pivotal to the characteristics and functions of gut bacteria. These features appear to facilitate the identification of specific gut bacterial species. Additionally, we established quantitative rules for identifying Actinobacteria, Bacteroidetes, and Firmicutes. CONCLUSION:This research underscores the significant potential of machine learning in studying gut microbes and enhances our understanding of the multifaceted roles of gut bacteria.
Medical AI models excel at tumor detection and segmentation. However, their latent representations often lack explicit ties to clinical semantics, producing outputs less trusted in clinical practice. Most of the existing models generate either segmentation masks/labels (localizing where without why) or textual justifications (explaining why without where), failing to ground clinical concepts in spatially localized evidence. To bridge this gap, we propose to develop models that can justify the segmentation or detection using clinically relevant terms and point to visual evidence. We address two core challenges: First, we curate a rationale dataset to tackle the lack of paired images, annotations, and textual rationales for training. The dataset includes 180K image-mask-rationale triples with quality evaluated by expert radiologists. Second, we design rationale-informed optimization that disentangles and localizes fine-grained clinical concepts in a self-supervised manner without requiring pixel-level concept annotations. Experiments across medical benchmarks show our model demonstrates superior performance in segmentation, detection, and beyond. The code is available at https://github.com/deep-real/MedRationale.
Contrast-enhanced computed tomography scans (CECT) are routinely used in the evaluation of different clinical scenarios, including the detection and characterization of hepatocellular carcinoma (HCC). Quantitative medical image analysis has been an exponentially growing scientific field. A number of studies reported on the effects of variations in the contrast enhancement phase on the reproducibility of quantitative imaging features extracted from CT scans. The identification and labeling of phase enhancement is a time-consuming task, with a current need for an accurate automated labeling algorithm to identify the enhancement phase of CT scans. In this study, we investigated the ability of machine learning algorithms to label the phases in a dataset of 59 HCC patients scanned with a dynamic contrast-enhanced CT protocol. The ground truth labels were provided by expert radiologists. Regions of interest were defined within the aorta, the portal vein, and the liver. Mean density values were extracted from those regions of interest and used for machine learning modeling. Models were evaluated using accuracy, the area under the curve (AUC), and Matthew's correlation coefficient (MCC). We tested the algorithms on an external dataset (76 patients). Our results indicate that several supervised learning algorithms (logistic regression, random forest, etc.) performed similarly, and our developed algorithms can accurately classify the phase of contrast enhancement.
BackgroundData collected from hospitals are usually partially annotated by radiologists due to time constraints. Developing and evaluating deep learning models on these data may result in over or under estimationPurposeWe aimed to quantitatively investigate how the percentage of annotated lesions in CT images will influence the performance of universal lesion detection (ULD) algorithms.MethodsWe trained a multi-view feature pyramid network with position-aware attention (MVP-Net) to perform ULD. Three versions of the DeepLesion dataset were created for training MVP-Net. Original DeepLesion Dataset (OriginalDL) is the publicly available, widely studied DeepLesion dataset that includes 32 735 lesions in 4427 patients which were partially labeled during routine clinical practice. Enriched DeepLesion Dataset (EnrichedDL) is an enhanced dataset that features fully labeled at one or more time points for 4145 patients with 34 317 lesions. UnionDL is the union of the OriginalDL and EnrichedDL with 54 510 labeled lesions in 4427 patients. Each dataset was used separately to train MVP-Net, resulting in the following models: OriginalCNN (replicating the original result), EnrichedCNN (testing the effect of increased annotation), and UnionCNN (featuring the greatest number of annotations).ResultsAlthough the reported mean sensitivity of OriginalCNN was 84.3% using the OriginalDL testing set, the performance fell sharply when tested on the EnrichedDL testing set, yielding mean sensitivities of 56.1%, 66.0%, and 67.8% for OriginalCNN, EnrichedCNN, and UnionCNN, respectively. We also found that increasing the percentage of annotated lesions in the training set increased sensitivity, but the margin of increase in performance gradually diminished according to the power law.ConclusionsWe expanded and improved the existing DeepLesion dataset by annotating additional 21 775 lesions, and we demonstrated that using fully labeled CT images avoided overestimation of MVP-Net's performance while increasing the algorithm's sensitivity, which may have a huge impact to the future CT lesion detection research. The annotated lesions are at .
As COVID-19 develops, dynamic changes occur in the patient's immune system. Changes in molecular levels in different immune cells can reflect the course of COVID-19. This study aims to uncover the molecular characteristics of different immune cell subpopulations at different stages of COVID-19. We designed a machine learning workflow to analyze scRNA-seq data of three immune cell types (B, T, and myeloid cells) in four levels of COVID-19 severity/outcome. The datasets for three cell types included 403,700 B-cell, 634,595 T-cell, and 346,547 myeloid cell samples. Each cell subtype was divided into four groups, control, convalescence, progression mild/moderate, and progression severe/critical, and each immune cell contained 27,943 gene features. A feature analysis procedure was applied to the data of each cell type. Irrelevant features were first excluded according to their relevance to the target variable measured by mutual information. Then, four ranking algorithms (last absolute shrinkage and selection operator, light gradient boosting machine, Monte Carlo feature selection, and max-relevance and min-redundancy) were adopted to analyze the remaining features, resulting in four feature lists. These lists were fed into the incremental feature selection, incorporating three classification algorithms (decision tree, k-nearest neighbor, and random forest) to extract key gene features and construct classifiers with superior performance. The results confirmed that genes such as PFN1, RPS26, and FTH1 played important roles in SARS-CoV-2 infection. These findings provide a useful reference for the understanding of the ongoing effect of COVID-19 development on the immune system.
Protein is very important for almost all living creatures because it participates in most complicated and essential biological processes. Determining the functions of given proteins is one of the most essential problems in protein science. Such determination can be conducted through traditional experiments. However, the experimental methods are always time-consuming and of high costs. In recent years, computational methods give useful aids for identification of protein functions. This study presented a new multi-label classifier for identifying functions of mouse proteins. Due to the number of functional types, which were termed as labels in the classification procedure, a label space partition method was employed to divide labels into some partitions. On each partition, a multi-label classifier was constructed. The classifiers based on all partitions were integrated in the proposed classifier. The cross-validation results proved that the proposed classifier was of good performance. Classifiers with label partition were superior to those without label partition or with random label partition.
Background & aims: Quantitative analysis of computed tomography (CT) scans of patients with metastatic colorectal cancer (mCRC) can identify imaging signatures that predict overall survival (OS). Methods: We retrospectively analysed CT images from 1584 mCRC patients on two phase III trials evaluating FOLFOX f panitumumab (n = 331, 350) and FOLFIRI f aflibercept (n = 437, 466). In the training set (n = 720), an algorithm was trained to predict OS land -marked from month 2; the output was a signature value on a scale from 0 to 1 (most to least favourable predicted OS). In the validation set (n = 864), hazard ratios (HRs) evaluated the association of the signature with OS using RECIST1.1 as a benchmark of comparison.Results: In the training set, the selected signature combined three features -change in tumour volume, change in tumour spatial heterogeneity, and tumour volume -to predict OS. In the validation set, RECIST1.1 classified patients in three categories: response (n = 166, 19.2%), stable disease (n = 636, 73.6%), and progression (n = 62, 7.2%). The HR was 3.93 (2.79 -5.54). Using the same distribution for the signature, the HR was 21.04 (14.88-30.58), showing an incremental prognostic separation. Stable disease by RECIST1.1 was reclassified by the signature along a continuum where patients belonging to the most and least favourable signature quartiles had a median OS of 40.73 (28.49 to NA) months (n = 94) and 7.03 (5.66 -7.89) months (n = 166), respectively.Conclusions: A signature combining three imaging features provides early prognostic information that can improve treatment decisions for individual patients and clinical trial analyses.(C) 2021 Elsevier Ltd. All rights reserved.
IMPORTANCE Existing criteria to estimate the benefit of a therapy in patients with cancer rely almost exclusively on tumor size, an approach that was not designed to estimate survival benefit and is challenged by the unique properties of immunotherapy. More accurate prediction of survival by treatment could enhance treatment decisions. OBJECTIVE To validate, using radiomics and machine learning, the performance of a signature of quantitative computed tomography (CT) imaging features for estimating overall survival (OS) in patients with advanced melanoma treated with immunotherapy. DESIGN, SETTING, AND PARTICIPANTS This prognostic study used radiomics and machine learning to retrospectively analyze CT images obtained at baseline and first follow-up and their associated clinical metadata. Data were prospectively collected in the KEYNOTE-002 (Study of Pembrolizumab [MK-3475] Versus Chemotherapy in Participants With Advanced Melanoma; 2017 analysis) and KEYNOTE-006 (Study to Evaluate the Safety and Efficacy of Two Different Dosing Schedules of Pembrolizumab [MK-3475] Compared to Ipilimumab in Participants With Advanced Melanoma; 2016 analysis) multicenter clinical trials. Participants included 575 patients with a diagnosis of advanced melanoma who were randomly assigned to training and validation sets. Data for the present study were collected from November 20, 2012, to June 3, 2019, and analyzed from July 1, 2019, to September 15, 2021. INTERVENTIONS KEYNOTE-002 featured trial groups testing intravenous pembrolizumab, 2 mg/kg or 10mg/kg every 2 or every 3 weeks based on randomization, or investigator-choice chemotherapy; KEYNOTE-006 featured trial groups testing intravenous ipilimumab, 3mg/kg every 3 weeks and intravenous pembrolizumab, 10mg/kg every 2 or 3 weeks based on randomization. MAIN OUTCOMES AND MEASURES The performance of the signature CT imaging features for estimating OS at the month 6 posttreatment landmark in patients who received pembrolizumab was measured using an area under the time-dependent receiver operating characteristics curve (AUC). RESULTS A random forest model combined 25 imaging features extracted from tumors segmented on CT images to identify the combination (signature) that best estimated OS with pembrolizumab in 575 patients. The signature combined 4 imaging features, 2 related to tumor size and 2 reflecting changes in tumor imaging phenotype. In the validation set (287 patients treated with pembrolizumab), the signature reached an AUC for estimation of OS status of 0.92 (95% CI, 0.89-0.95). The standard method, Response Evaluation Criteria in Solid Tumors 1.1, achieved an AUC of 0.80 (95% CI, 0.75-0.84) and classified tumor outcomes as partial or complete response (93 of 287 [32.4%]), stable disease (90 of 287 [31.3%]), or progressive disease (104 of 287 [36.2%]). CONCLUSIONS AND RELEVANCE The findings of this prognostic study suggest that the radiomic signature discerned from conventional CT images at baseline and on first follow-up may be used in clinical settings to provide an accurate early readout of future OS probability in patients with melanoma treated with single-agent programmed cell death 1 blockade.
Radiomics, one of the potential methods for developing clinical biomarker, is one of the exponentially growing research fields. In addition to its potential, several limitations have been identified in this field, and most importantly the effects of variations in imaging parameters on radiomic features (RFs). In this study, we investigate the potential of RFs to predict overall survival in patients with clear cell renal cell carcinoma, as well as the impact of ComBat harmonization on the performance of RF models. We assessed the robustness of the results by performing the analyses a thousand times. Publicly available CT scans of 179 patients were retrospectively collected and analyzed. The scans were acquired using different imaging vendors and parameters in different medical centers. The performance was calculated by averaging the metrics over all runs. On average, the clinical model significantly outperformed the radiomic models. The use of ComBat harmonization, on average, did not significantly improve the performance of radiomic models. Hence, the variability in image acquisition and reconstruction parameters significantly affect the performance of radiomic models. The development of radiomic specific harmonization techniques remain a necessity for the advancement of the field.
In mammals, the cerebellum plays an important role in movement control. Cellular research reveals that the cerebellum involves a variety of sub-cell types, including Golgi, granule, interneuron, and unipolar brush cells. The functional characteristics of cerebellar cells exhibit considerable differences among diverse mammalian species, reflecting a potential development and evolution of nervous system. In this study, we aimed to recognize the transcriptional differences between human and mouse cerebellum in four cerebellar sub-cell types by using single-cell sequencing data and machine learning methods. A total of 321,387 single-cell sequencing data were used. The 321,387 cells included 4 cell types, i.e., Golgi (5,048, 1.57%), granule (250,307, 77.88%), interneuron (60,526, 18.83%), and unipolar brush (5,506, 1.72%) cells. Our results showed that by using gene expression profiles as features, the optimal classification model could achieve very high even perfect performance for Golgi, granule, interneuron, and unipolar brush cells, respectively, suggesting a remarkable difference between the genomic profiles of human and mouse. Furthermore, a group of related genes and rules contributing to the classification was identified, which might provide helpful information for deepening the understanding of cerebellar cell heterogeneity and evolution.
 Binsheng Zhao合作论文数Department of Biomedical Engineering, The Fu Foundation School of Engineering and Applied Science, Columbia University in the City of New York45
 Lawrence H. Schwartz合作论文数Department of Radiology, Memorial Sloan-Kettering Cancer Center;Department of Radiology, Columbia University in the City of New York;Columbia MR Research Center, Columbia University in the City of New York39
 Yudong Cai (蔡煜东)合作论文数School of Life Sciences, Shanghai University23
 Hao Yang合作论文数22
 Jun Zhao (赵俊)合作论文数School of Biomedical Engineering, Shanghai Jiao Tong University14
 Dercle Laurent合作论文数Department of Nuclear Medicine, Toulouse University Hospital13
 Lei Chen (陈磊)合作论文数College of Information Engineering, Shanghai Maritime University12
 Kai-Yan Feng合作论文数9
 Yu-Hang Zhang合作论文数7Jingchen Ma合作论文数Shanghai Jiao Tong Univ, Sch Biomed Engn, Shanghai 200240, Peoples R China7Deling Wang合作论文数7LinNing E (鄂林宁)合作论文数7
 Tao Huang (黄涛)合作论文数School of Public Health, Peking University7Yongqiang Tan合作论文数6
 Lei Li合作论文数5Zhandong Li合作论文数5
 Wencong Lu (陆文聪)合作论文数College of Sciences, Shanghai University5
 Chuanmiao Xie (谢传淼)合作论文数Sun Yat-sen University Cancer Center5Pingzhen Guo合作论文数4Shawn Sun合作论文数4
 Xiangyin Kong (孔祥银)合作论文数School of Life Science and Technology, ShanghaiTech University;Shanghai Institute of Nutrition and Health, Chinese Academy of Sciences;University of Chinese Academy of Sciences4
 Jianfeng He (何建锋)合作论文数Amazon Web Services4
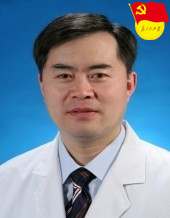 Wei Guo (郭伟)合作论文数Shanghai Ninth People’s Hospital, Shanghai Jiao Tong University School of Medicine4
 Hubert Piessevaux合作论文数Cliniques Universitaires Saint-Luc;Department of Hepato-gastroenterology, Université Catholique de Louvain4Oguz Akin合作论文数4Lyndon Luk合作论文数3
 Yixue Li (李亦学)合作论文数Hangzhou Institute for Advanced Study, University of Chinese Academy of Sciences;Guangzhou Laboratory3Philip Lichtenstein合作论文数Department of Radiology, Columbia University Medical Center3
 Korhan Buyukturkoglu合作论文数Translat Cognit Neurosci Lab, Columbia Univ3
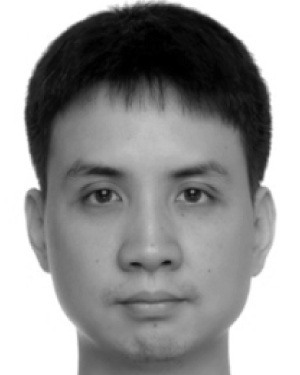 Junfeng Xiong合作论文数Tencent Health3
 Wenbing Lv合作论文数Southern Med Univ, Guangzhou, Guangdong, Peoples R China3
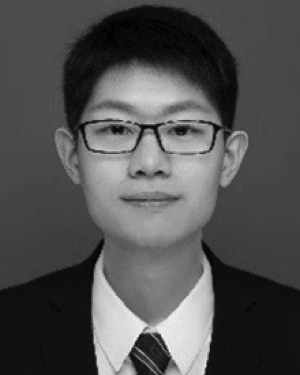 Yacheng Ren合作论文数Shanghai Jiao Tong Univ, Sch Biomed Engn, Shanghai 200240, Peoples R China3Ping Yin合作论文数3Ai-ping CHEN (陈爱萍)合作论文数3JianGuo Zhu (朱建国)合作论文数3
 Haipeng Li (李海鹏)合作论文数Shanghai Institute of Nutrition and Health, Chinese Academy of Sciences;University of Chinese Academy of Sciences3Jiarui Li (李嘉睿)合作论文数School of Life Sciences Shanghai University3
 Philip Lawrence De Jager合作论文数Taub Institute for Research on Alzheimer's Disease and the Aging Brain, Columbia University;Department of Neurology, Columbia University;Columbia University Irving Medical Center3Peter Eggleton合作论文数2
 Abdalla Ibrahim合作论文数2Tito Fojo合作论文数2Wei Lian合作论文数2
 Shiqi Zhang (张诗奇)合作论文数School of Computing, National University of Singapore2Dana E Connors合作论文数2C. Riley合作论文数Department of Neurology, Columbia University Medical Center2Heying Zhang合作论文数City Hope Natl Med Ctr, Beckman Res Inst, Dept Neurosci, Duarte, CA 91010 USA2Kairui Feng合作论文数2
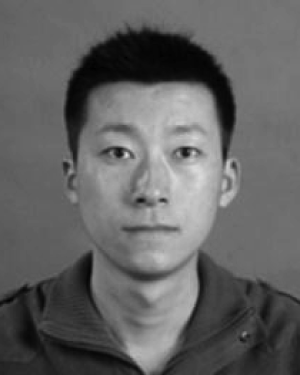 ShaoPeng Wang合作论文数2




