Table S1a: Representativeness of study participants. Table S1b: Response and MRD rates at 12 and 24 cycles of combination treatment in intention-to-treat population (N=79). Table S2: Response and MRD rates at 12 and 24 cycles of combination treatment in evaluable patients. Table S3a: Univariate analysis of factors associated with CR/CRi at the end of treatment. Table S3b: Multivariate analysis of factors associated with CR/CRi at the end of treatment. Table S3c: Univariate analysis of factors associated with the best CR/CRi response. Table S3d: Multivariate analysis of factors associated with the best CR/CRi response. Table S4a: Univariate analysis of factors associated with marrow UMRD4 at the end of treatment. Table S4b: Multivariate analysis of factors associated with marrow UMRD4 at the end of treatment. Table S4c: Univariate analysis of factors associated with the best marrow UMRD4 response. Table S4d: Multivariate analysis of factors associated with the best marrow UMRD4 response. Table S5a: Univariate analysis of factors associated with progression-free survival. Table S5b: Multivariate analysis of factors associated with progression-free survival. Table S6: Summary of dose modifications. Table S7: The common reasons for dose reductions and dose interruptions. Table S8a: Summary of patients with U-MRD4 at EOT who had CLL progression. Table S8b: Summary of patients with MRD at EOT who had CLL progression.
We explored the efficacy of the combination of ibrutinib + venetoclax in patients with relapsed and/or refractory (R/R) chronic lymphocytic leukemia (CLL). This phase II study enrolled 80 patients between July 2016 and September 2018. Patients received ibrutinib for the first 3 cycles, followed by ibrutinib + venetoclax for 24 cycles. Of the 79 treated patients, the median age was 61 years (IQR, 56-69); 65 (65/76, 86%) had unmutated IGHV and 29 (37%) had either del(17p) or a TP53 mutation. The median number of prior treatments was 1 (range, 1-3). The primary endpoint, best complete remission (CR) and CR with incomplete count recovery (CRi), was 67%, with a bone marrow undetectable measurable residual disease [10-4 sensitivity (U-MRD4)] rate of 61%. At 95.5 months of median follow-up, the estimated 7-year progression-free survival rate was 63.3%. Grade ≥3 neutropenia and thrombocytopenia occurred in 38% and 13% of patients, respectively. The 24-cycle ibrutinib + venetoclax combination led to high rates of CR/CRi and bone marrow U-MRD4 in patients with R/R CLL. SIGNIFICANCE:The 24-cycle ibrutinib + venetoclax combination led to high rates of CR/CRi and bone marrow U-MRD4 in patients with R/R CLL. Responses were durable, including in patients with high-risk genomics.
Figures S1a: Response rates at serial time points in evaluable patients. Histogram showing iwCLL 2018 response at serial study time points in evaluable patients. CR/CRi rate was 64% at the end of cycle 12 and 77% at the end of cycle 24 of combination therapy. The best CR/CRi rate was 71% at anytime during the study treatment Figure S1b: Marrow UMRD4 rates in evaluable patients. Histogram showing bone marrow UMRD4 rates at serial study time points in evaluable patients. Bone marrow UMRD4 rate was 48% at the end of cycle 12 and 71% at the end of cycle 24 of combination therapy. The best bone marrow UMRD4 rate was 64% at anytime during the study treatment. Figure S2: Time to First Bone Marrow UMRD4. Reversed Kaplan-Meier survival estimate curve for time to first bone marrow UMRD4. The analysis included all patients who had MRD assessments after 3 months of combination therapy. Figure S3: Progression-free survival and overall survival stratified by IGHV mutation status (n=76). Kaplan-Meier progression-free and overall survival estimate curves stratified by IGHV mutation status. Log-rank test was used to compare between IGHV mutated and unmutated subgroups. Figure S4: Progression-free survival and overall survival in stratified by prior chemoimmunotherapy treatment. Kaplan-Meier progression-free and overall survival estimate curves stratified by prior chemoimmunotherapy treatment status. Log-rank test was used to compare between the two subgroups. Figure S5a: Time to treatment discontinuation in all patients. Kaplan-Meier survival estimate curve for time to treatment discontinuation. Figure S5b: Time to treatment discontinuation, stratified by IGHV status. Kaplan-Meier survival estimate curve for time to treatment discontinuation stratified by IGHV mutation status. Log-rank test was used to compare between the two subgroups. Figure S5c: Time to treatment discontinuation, stratified by TP53 aberration. Kaplan-Meier survival estimate curve for time to treatment discontinuation stratified by TP53 aberration status. Log-rank test was used to compare between the two subgroups. Figure S5d: Time to treatment discontinuation, stratified by prior chemoimmunotherapy treatment. Kaplan-Meier survival estimate curve for time to treatment discontinuation stratified by prior chemoimmunotherapy treatment status. Log-rank test was used to compare between the two subgroups. Figure S6: Patient Disposition. Flowchart showing patient disposition. Figure S7: Time to MRD recurrence in peripheral blood. Reversed Kaplan-Meier survival estimate curve for time to MRD recurrence in peripheral blood. Figure S8: Time to next treatment. Kaplan-Meier survival estimate curve for time to next treatment.
Background Disparities in acute myeloid leukemia (AML) outcomes due to nonbiological factors, including socioeconomic (SE) status and race/ethnicity, have been observed in population-based studies. However, inconsistent assessment of SE status limits translation to clinical practice. Objective To evaluate the impact of neighborhood disadvantage status and race/ethnicity on AML outcomes. Methods Adult patients with newly diagnosed untreated AML, self-reported race/ethnicity, and available Area Deprivation Index (ADI) based on zip code at diagnosis were included. Primary outcome was overall survival (OS). Multivariable Cox regression analyzed factors associated with OS. Results Of 2442 patients, 2032 (83%) were non-Hispanic White, 202 (8%) were non-Hispanic Black, 109 (5%) were Hispanic, and 99 (4%) were Asian. Median ADI rank was 53 (IQR, 32-73). No differences in clinical trial participation across racial/ethnic groups were observed. Stem cell transplant rates were lower in more disadvantaged neighborhoods (higher ADI ranks, ≥ 53: 16% vs. 20%, P = .007). In multivariable analysis, clinical trial participation (HR 0.72, [95% CI, 0.63-0.81], P < .001) and transplant (HR 0.43, [95% CI, 0.36-0.51], P < .001) were associated with improved OS. Neither ADI rank nor race/ethnicity affected OS. Conclusions and Relevance In a large academic center, neighborhood disadvantage and race/ethnicity did not affect AML outcomes. Equitable access to clinical trials and novel therapies appears to mitigate SE and racial/ethnic disparities. These findings suggest academic centers can serve as models for reducing inequities through policy and clinical interventions. Prospective multicenter studies are needed to validate these findings.
Allogeneic stem cell transplantation (SCT) is a curative treatment in myelodysplastic syndromes (MDS). We performed a retrospective single center study of all patients with newly diagnosed higher risk (HR) MDS (IPSS-R > 3.5 points) between 2000 and 2023. We identified 2045 patients with HR-MDS, of which 427 (21%) underwent SCT. The median post-SCT overall survival (OS) was 23.9 months, progression-free survival (PFS) was 14.4 months, 5-year cumulative incidence (CI) of relapse was 37%, and 5-year CI of treatment-related mortality (TRM) was 25%. There were no significant differences in OS, PFS, CI of relapse, or CI of TRM between age categories. Survival improved over the observation period (median 11.8 months in 2000-2010, 28.2 months in 2011-2016, and 40.2 months in 2017-2023; p = 0.01). By multivariate analysis, TP53 status was the most important predictor of post-SCT OS. Patients with TP53-wild type MDS had an OS of 69% at 5 years (HR for death 0.32 with SCT, p < 0.001). Patients with TP53 mutations had poor outcomes, with OS of 9.1 months in monoallelic (HR for death 0.88 with SCT, p = 0.69) and 6.8 months in biallelic (HR for death 0.76 with SCT, p = 0.14). SCT can lead to excellent long-term survival in TP53-wild type HR MDS.
Introduction: Chronic myelomonocytic leukemia (CMML) is a rare myeloid neoplasm. The outcomes of patients (pts) with CMML treated with allogeneic stem cell transplantation (SCT) are incompletely understood. Methods: We evaluated a cohort of pts presenting with newly diagnosed CMML between 2000-2023 (n=855) to assess outcomes with SCT. Time-to-event endpoints were calculated from SCT day 0. Cumulative incidence (CI) analyses were performed using the Fine-Gray method with relapse and treatment-related mortality (TRM) as competing risks. Multivariate analysis (MVA) was performed using a Cox proportional hazards regression. Results: Among the cohort of 855 pts, 109 (13%) proceeded to SCT. Pts who underwent SCT had a median age of 63 years (range 27-78) and 68 (62%) were male. Thirty-three (30%), 11 (10%), and 51 (47%) had CMML-2, therapy-related CMML (t-CMML), and proliferative-type CMML (MP-CMML), respectively. RAS pathway (RASp) mutations were identified in 45/65 (69%) pts. Other high-risk mutations included: ASXL1 in 37/70 (53%) pts, RUNX1 in 18/70 (26%), SETBP1 in 6/44 (14%), IDH2 in 7/79 (9%), and DNMT3A in 12/74 (16%). CPSS score was Low in 14/107 (13%), Int-1 in 26 (24%), Int-2 in 52 (49%), and High in 15 (14%). CPSS-mol score was Low in 3/51 (6%), Int-1 in 8 (16%), Int-2 in 16 (31%), and High in 24 (47%). The median time from diagnosis to SCT was 9.3 months (m). Conditioning was MAC in 65 (60%) and RIC in 44 (40%) pts, with PTCy administered in 56 pts (51%). Compared to MAC, pts who received RIC were older (median age 64 vs 61 yrs, p=0.001) and had worse HCT-CI (median 3 vs 2, p=0.18). 28-day, 56-day, and 100-day mortality were 3%, 6%, and 10%, respectively. Acute graft-versus-host disease (GVHD) was diagnosed in 62/104 (60%) pts (9 [9%] pts with grade 3/4). Chronic GVHD was diagnosed in 28/94 (30%) pts. The median follow-up time from SCT day 0 was 54.7 m. At the time of SCT, 83/109 (76%) pts had CMML and 26/109 (24%) had transformed to secondary acute myeloid leukemia (sAML). The median OS was 57.7 m (2-yr 59%) for CMML and 12.0 m (2-yr 42%) for sAML (p=0.47). The median PFS was 13.8 m (2-yr 42%) for CMML and 9.4 m (2-yr 42%) for sAML (p=0.65). The CI of relapse at 2 years was 33% in CMML and 37% in sAML (p=0.29). The CI of TRM at 2 years was 24% in CMML and 20% in sAML (p=0.40). We next explored subsets in the pts with CMML (excluding sAML). OS was significantly longer in MAC vs RIC conditioning (median 81.3 vs 20.2 m; p=0.005). The cumulative incidence of relapse was similar between MAC and RIC (2-yr 37% vs 29%; p=0.55) but TRM was lower in MAC vs RIC (2-yr 12% vs 41%; p=0.013). Causes of TRM (n=14) in RIC were infections in 6/14 (43%), GVHD in 5/14 (36%), and other in 3/14 (21%). The median OS was 38 m (2-yr 55%) in the pts with RASp mutations vs not reached (NR) (2-yr 87%) in those without (p=0.069). The median OS was 60.8 m (2-yr 77%) in pts with ASXL1 mutations (n=33) vs not reached (NR) (2-yr 62%) in those without (n=25, p=0.88). The median OS was 38.0 m (2-yr 66%) in pts with RAS pathway + ASXL1 mutations (n=22) vs NR (2-yr 80%) in those without any (n=11; p=0.39). The median OS was NR (2-yr 80%) in pts with RAS pathway + RUNX1 mutations (n=10). There were no significant differences in OS by CMML type (median 57.7 m [2-yr 57%] with MD-CMML vs 43.9 m [2-yr 62%] with MP-CMML; p=0.70). The median OS was 57.7 m (2-yr 60%) in CMML-1, 43.9 m (2-yr 60%) in CMML-2, and 41.4 m (2-yr 50%) in t-CMML (p=0.89). By CPSS, the median OS was 57.7 m (2-yr 59%) in Low/Int-1 and 43.9 m (2-yr 62%) in Int-2/High (p=0.60). By CPSS-mol, the median OS was 57.7 m (2-yr 90%) in Low/Int-1 and 81.3 m (2-yr 70%) in Int-2/High (p=0.28). By MVA considering age, HCT-CI, conditioning intensity, CMML type (MD vs MP), RASp mutations, and CPSS, only RASp mutated status was significantly associated with adverse OS (HR 5.34, p=0.039) and PFS (HR 5.61, p=0.013). By landmark analysis compared to non-transplanted pts, both RASp mutated (median OS from diagnosis 63.1 m with SCT vs 30.3 m without, p=0.003) and RASp unmutated pts (median OS from diagnosis NR with SCT vs 37.3 m without, p=0.02) appeared to benefit from SCT. Conclusions: SCT provides durable disease control in a significant proportion of pts with CMML. Outcomes were inferior with RIC regimens, possibly related to pt age and comorbidities. RAS pathway mutations were associated with shorter post-SCT OS, but these patients still appear to benefit from SCT.
BACKGROUND:IDH1 mutations correlate with poor prognosis in acute myeloid leukemia (AML) and myelodysplastic syndromes (MDS), though this has evolved with targeted therapy. Olutasidenib, a selective oral IDH1 inhibitor, was approved for relapsed/refractory (R/R) AML in 2022. METHODS:We investigated a single-institution experience with olutasidenib regimens in IDH1-mutated AML and MDS. RESULTS:The study included 24 patients (19 AML, 5 MDS), with median age 75 years and 15 (62%) males. Fifteen patients (79%) had adverse-risk AML; 5 (100%) higher-risk MDS; and 9 (47%) secondary AML. The AML and MDS groups each included 2 previously untreated patients. The 17 R/R AML patients received a median of 3 prior therapies, including ivosidenib and/or venetoclax. Patients received olutasidenib monotherapy (n = 8) or combination therapy (n = 16). All 4 previously untreated patients responded. Overall response rates were 35% in R/R AML and 33% in R/R MDS. Two AML patients in complete remission remain on olutasidenib 5 to 7 years later, and 2 underwent allogeneic stem cell transplant. In the R/R patients, median overall survival was 3.3 months in AML and 14.0 months in MDS. Prior ivosidenib or venetoclax exposure did not impact survival. CONCLUSION:Olutasidenib-based therapy demonstrated 100% response rates in previously untreated IDH1-mutated AML and MDS and modest efficacy in heavily pretreated R/R AML and MDS. Durable remissions occurred in select responders and with stem cell transplant. Further evaluation of olutasidenib as frontline therapy in IDH1-mutated AML or MDS and as a bridge to transplant is warranted.
Myelodysplastic syndromes (MDS) and chronic myelomonocytic leukemia (CMML) are hematologic malignancies characterized by bone marrow (BM) dysplasia and ineffective hematopoiesis. Therapies are limited and survival outcomes dismal, especially once all standard-of-care options are exhausted. Clinical trial enrollment is paramount, though many barriers have resulted in disparate participation. Here, we sought to evaluate the impact of clinical trial enrollment on survival outcomes and identify barriers to clinical trial participation. We retrospectively evaluated all screening instances of patients with MDS or CMML at a tertiary cancer center from February 2023 through April 2024. Clinical patient characteristics and BM data were assessed at the time of screening. Overall survival (OS) was analyzed using Kaplan-Meier method and compared using log-rank test. Multivariable analysis (MVA) was performed using Cox proportional hazards model. A total of 593 patients were screened for clinical trial enrollment, with 233 (39%) treated on protocol and 360 (61%) screen failures. Patients enrolled on clinical trials were older (74 vs 72 years, p=0.031); resided in metropolitan areas (Rural-Urban Commuting Area codes 1 vs 1, p=0.038); and had higher BM blasts (8 vs 4%, p<0.001), less neutrophils (absolute neutrophil count [ANC] 1.26 vs 1.77 x10⁹/L, p=0.019), higher-risk disease by both International Prognostic Scoring System (IPSS; p<0.001) and Revised IPSS (IPSS-R; p<0.001), and had more often failed hypomethylating agent (HMA) therapy (52 vs 32%, p<0.001). Median OS was 67.4 months (95% confidence interval [CI]: 56.6, 110.0) from diagnosis and 17.9 months (95% CI: 16.3, not estimable [NE]) from the time of screening. There were no differences in OS from the time of diagnosis or screening by clinical trial enrollment (p=0.821 and p=0.242, respectively). By MVA, increasing age (p=0.020), higher BM blasts (p=0.004), lower hemoglobin levels (p=0.002), thrombocytopenia (p=0.026), higher ANC (p=0.041), more adverse cytogenetics (p<0.001), and HMA failure (p<0.001) predicted for inferior OS. When including only untreated patients (n=351), OS was not reached (NR; 95% CI: 134, NE) from diagnosis and NR (95% CI: NE, NE) from screening. There were no differences in median OS by clinical trial enrollment (from diagnosis: p=0.108, from screening: p=0.181). However, when evaluating only patients with HMA failure (n=235), patients treated on a clinical trial had improved OS than those who were not (67.4 [95% CI: 44.4, 122.3] vs 38.1 months [95% CI: 33.1, 57.9], p=0.013). From the time of screening, median OS was 9.7 months (95% CI: 8.3, 14.2) for those treated on clinical trials and 7.7 months (95% CI: 4.9, 12.4) for those on standard therapies. By MVA, increasing age (p=0.009), higher BM blasts (0.026), thrombocytopenia (p=0.018), poorer risk cytogenetics (p<0.001), and treating off protocol (p=0.017) predicted for inferior survival. Reasons for screen failure included patient/physician decision in 224 (62%), comorbid conditions in 69 (19%), and trial logistics in 61 (17%). Six patients (2%) passed away prior to any treatment on or off a clinical trial and are subsequently excluded. Median OS from time of screening was NR, 14.2 (95% CI: 8.1, NE), and 17.2 months (95% CI: 12.4, NE) in the patient/physician decision, comorbidity, and logistics subgroups, respectively (p=0.009). In frontline screen failures, median OS was NR (95% CI: NE, NE) in both patient/physician decision and logistics subgroups and NR (95% CI: 11.2, NE) in the comorbidity subgroup (p=0.016). In those with HMA failure treated off protocol, median OS was also more inferior in those with comorbidities (patient/physician decision: 12.1 [95% CI: 6.8, NR], comorbidity: 4.9 [95% CI: 2.7, NR], logistics: 9.9 [95% CI: 1.5, NR]; p=0.070). Clinical trial enrollment was more prevalent in older patients with MDS with higher-risk disease who resided in metropolitan areas and had already received HMA. Treating on investigative therapies resulted in better survival outcomes in patients with HMA failure MDS. Though comorbidities accounted for only 19% of screen fails, those patients had inferior survival than others who were not enrolled on clinical trials due to patient/physician decision or logistical issues. Therefore, less restrictive eligibility criteria in clinical trials are warranted for consideration in future investigative efforts.
Ontogeny of acute myeloid leukemia (AML) provides prognostic information, however closer interrogation with respect to AML characteristics, genomics, and various treatments are warranted. We defined untreated clinical secondary (CS) AML as AML with a diagnosis of antecedent myelodysplastic syndrome (MDS) or MDS/myeloproliferative neoplasm (MDS-MPN) without exposure to hypomethylating agents or chemotherapy; genomic secondary (GS) AML included patients with myelodysplasia related cytogenetics (MRC) or myelodysplasia related mutations (MRM) without a known antecedent myeloid neoplasm or prior chemo-radiotherapy for non-myeloid neoplasms. Among newly diagnosed AML patients classified as untreated CS-AML ( n = 133) or GS-AML ( n = 389), median relapse-free survival (RFS) (11.9 vs. 12.4 months, p = 0.36) and overall survival (OS) (11.6 vs. 14.4 months, p = 0.75) were similar. No difference in RFS and OS between these groups treated with low-intensity therapy (LIT) and venetoclax regimens was seen, but both were inferior to de novo (DN) AML without secondary-type genomics (pure DN-AML). GS-AML defined by the presence of only MRM had superior OS compared with MRM ± MRC with LIT+ venetoclax therapy (RFS 19.5 vs. 6.8 months [ p < 0.01] and OS 29.6 vs. 8.4 [ p < 0.01]) and had similar RFS (29.8 months, p = 0.48) and OS (32.0 months, p = 0.48) to pure DN-AML treated with LIT+ venetoclax. On multivariate analysis in patients treated with LIT+ venetoclax, untreated CS-AML (vs. GS-AML), adverse cytogenetics and ELN 2024 adverse-risk disease (mutated TP53 ) were associated with higher hazard of death. Adverse cytogenetics was the strongest prognostic variable predicting survival. Mutation-driven genomic ontogeny of newly diagnosed AML with MRM appears less prognostic than cytogenetic-driven ontogeny with venetoclax-based therapy.
Background: Adolescents and young adults (AYAs, age 15-39 years) with acute myeloid leukemia (AML) experience disparities in outcomes, partly driven by socioeconomic factors and limited participation in cancer clinical trials. Our group previously reported that receipt of induction therapy in a clinical trial was associated with improved overall survival among AYAs with AML (Hill et al. JCO 2025). Here, we describe overall clinical trial participation rates in this population and characterize the barriers that prevented trial enrollment among AYAs with AML treated at a large cancer center with a robust AML trial portfolio. Methods: We retrospectively reviewed all AYAs with AML treated at MD Anderson Cancer Center between March 2013-2023. Patient sociodemographic and clinic data were abstracted from the electronic medical record. The reasons for non-enrollment on a clinical trial were captured from research study and treating physician notes and categorized as follows: 1) disease-related (e.g., myeloid sarcoma, progressive disease needing urgent treatment initiation, lack of lower-intensity clinical trial options due to TP53-mutated disease); 2) insurance or financial barriers (lack of insurance, insurance denial, patient's financial constraints); 3) ineligibility due to patient factors (e.g., comorbidities, organ impairment, concomitant malignancy or prior chemotherapy); 4) patient or treating physician preference; and 5) unknown. Results: Among 190 AYAs with AML (median age 31 years, range 17-39 years, 43% had adverse risk by ELN 2022), 135 (71%) were enrolled in a clinical trial. There was no difference in the rates of clinical trial enrollment among patients from low versus high Area Deprivation Index (ADI) national (67 and 68 patients) or state (69 and 66 patients) ranks. Of the 55 patients (29%) treated outside of a clinical trial, the most common barriers were – insurance/ financial constraint (33%), ineligibility due to patient factors (22%), disease-related factors (18%), unknown reasons (16%), and patient/treating physician choice (11%). Treatment on a clinical trial was independently associated with a significantly lower hazard of death compared to patients treated outside of clinical trial (HR-0.46, 95% CI 0.29-0.72, p=0.001) in a multivariate analysis. Conclusion: In a large academic cancer center with a robust portfolio of AML clinical trials available, most AYAs with AML participated in a trial, demonstrating the feasibility of enrolling this historically underrepresented population. However, insurance/financial barriers and patient eligibility factors remain substantial barriers to enrollment. Expanding eligibility criteria and enhancing patient financial support and navigation may further improve AYA' access to and participation in cancer clinical trials.
 Tapan M. Kadia合作论文数Department of Leukemia, Division of Cancer Medicine, M.D. Anderson Cancer Center60
 Guillermo Garcia-Manero合作论文数Section of Myelodysplastic Syndromes, Department of Leukemia, Division of Cancer Medicine, The University of Texas MD Anderson Cancer Center;UTHealth Houston Graduate School of Biomedical Sciences56
 Gautam Borthakur合作论文数Department of Leukemia, Division of Cancer Medicine, The University of Texas MD Anderson Cancer Center56
 Naval G. Daver合作论文数Department of Leukemia, Division of Cancer Medicine, The University of Texas MD Anderson Cancer Center54
 Elias Jabbour合作论文数Department of Leukemia, Division of Cancer Medicine, MD Anderson Cancer Center, University of Texas49
 Koji Sasaki合作论文数48
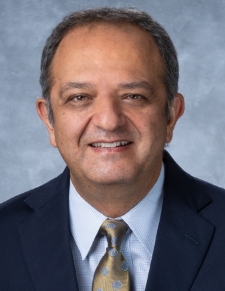 Farhad Ravandi-Kashani合作论文数Section of Developmental Therapeutics, Department of Leukemia, The University of Texas MD Anderson Cancer Center;Division of Cancer Medicine, The University of Texas MD Anderson Cancer Center43
 Danielle Hammond合作论文数41
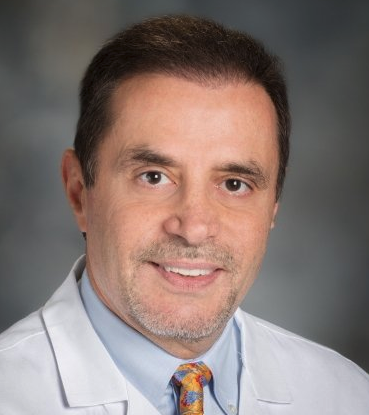 Hagop M. Kantarjian合作论文数Department of Leukemia, Division of Cancer Medicine, The University of Texas MD Anderson Cancer Center37
 Courtney DiNardo合作论文数Department of Leukemia, The University of Texas MD Anderson Cancer Center36
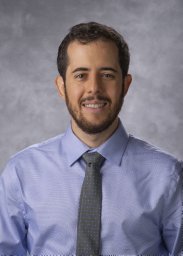 Alex Bataller合作论文数Dept Leukemia, Univ Texas MD Anderson Canc Ctr34
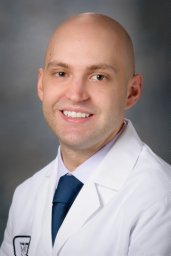 Nicholas Short合作论文数Department of Cellular and Structural Biology, University of Texas Health Science Center at San Antonio30
 Naveen Pemmaraju合作论文数Department of Leukemia, The University of Texas MD Anderson Cancer Center29
 Koichi Takahashi合作论文数29
 Rashmi Kanagal Shamanna合作论文数Molecular Diagnostic Laboratory, Department of Hematopathology, Division of Pathology and Laboratory Medicine, The University of Texas MD Anderson Cancer Center;Leukemia Planning Clinic, Department of Hematopathology, Division of Pathology and Laboratory Medicine, The University of Texas MD Anderson Cancer Center28Alessandra Ferrajoli合作论文数27
 Alexandre Bazinet合作论文数25Kelly S Chien合作论文数23Guillermo Montalban Bravo合作论文数21
 Jan Burger合作论文数Department of Leukemia, Division of Cancer Medicine, The University of Texas MD Anderson Cancer Center;Graduate School of Biomedical Sciences, University of Texas-Houston Health Science Center;School of Medicine, Albert-Ludwigs University21
 Nitin Jain合作论文数Qorvo, Inc.21
 Prithviraj Bose合作论文数20
 Stephanie Pierce合作论文数Western Governors University20
 Musa Yilmaz合作论文数Department of Leukemia, MD Anderson Cancer Center19
 William G. Wierda合作论文数Department of Leukemia, Division of Cancer Medicine, The University of Texas MD Anderson Cancer Center19Yesid Alvarado合作论文数18
 Loghavi Sanam合作论文数Dept Hematopathol, Univ Texas MD Anderson Canc Ctr18Ohanian Maro合作论文数17
 Maiti Abhishek合作论文数Department of Critical Care Medicine, West Bank Hospital17
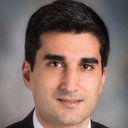 Ghayas C Issa合作论文数17Qiao Wei合作论文数16naveen pemmaraju合作论文数14Naveen Garg合作论文数13
 Hyunsoo Hwang合作论文数Dept Biostat, Univ Texas MD Anderson Canc Ctr12elias jabbour合作论文数11
 Uday R Popat合作论文数Department of Stem Cell Transplantation, Division of Cancer Medicine, The University of Texas MD Anderson Cancer Center;Department of Stem Cell Transplant Fellowship, The University of Texas MD Anderson Cancer Center11
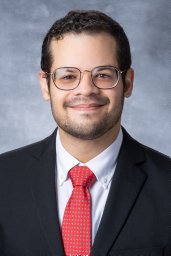 Samuel Urrutia合作论文数Department of Cancer Medicine, University of Texas MD Anderson Cancer Center10Xuelin Huang合作论文数10
 Varsha Gandhi合作论文数Department of Experimental Therapeutics, Division of Cancer Medicine, The University of Texas MD Anderson Cancer Center;Department of Leukemia, Division of Cancer Medicine, The University of Texas MD Anderson Cancer Center;Department of Translational Molecular Pathology, Division of Pathology-Lab Medicine, The University of Texas MD Anderson Cancer Center10
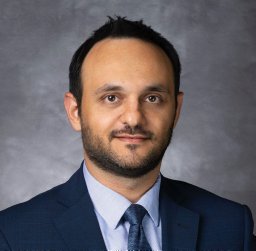 Abbas Hussein A合作论文数Department of Molecular and Cellular Oncology, University of Texas M. D. Anderson Cancer Center10
 Ziyi Li (李子义)合作论文数The First Hospital of Jilin University10Ana Ayala合作论文数9
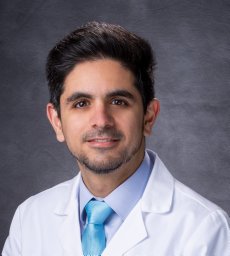 Fadi G Haddad合作论文数Dept Leukemia, Univ Texas MD Anderson Canc Ctr9
 Steven M. Kornblau合作论文数Department of Leukemia, Division of Cancer Medicine, University of Texas MD Anderson Cancer Center;Department of Stem Cell Transplantation, Division of Cancer Medicine, The University of Texas MD Anderson Cancer Center9
 Michael J. Keating合作论文数University of Texas MD Anderson Cancer Center9
 Marina Konopleva合作论文数Department of Oncology, Albert Einstein College of Medicine;Department of Molecular Pharmacology, Albert Einstein College of Medicine9Masarova Lucia合作论文数9
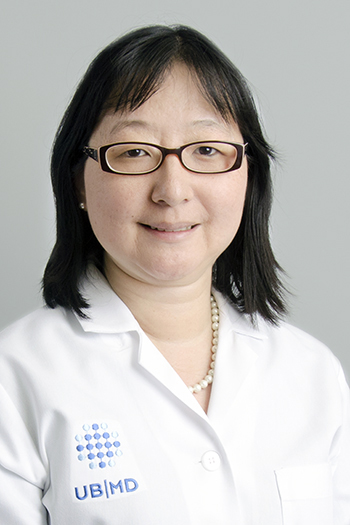 Eunice S. Wang合作论文数Department of Medicine, Jacobs School of Medicine & Biomedical Sciences, University at Buffalo;Roswell Park Comprehensive Cancer Center, Jacobs School of Medicine & Biomedical Sciences, University at Buffalo;Department of Tumor Immunology, Roswell Park Cancer Institute9




