Although nitrogen fixation has recently been recognized in the Arctic Ocean, the biogeographical patterns of diazotrophs in this region remain poorly resolved, leaving a critical gap in understanding of environmental nitrogen inputs. To address these uncertainties, we examined diazotrophic and overall prokaryotic communities in first-year land-fast sea ice, seawater, and sediments of the Pacific Arctic to identify habitat-specific patterns. Diazotrophic communities in sea ice and sediments exhibited stable structures across all samples, with both habitats consistently dominated by the anaerobic phylum Thermodesulfobacteriota (particularly Desulfuromonadia) and other sulfate-reducing lineages. In contrast, seawater communities were spatially heterogeneous, with some samples showing elevated abundances of Thermodesulfobacteriota. Prokaryotic communities showed marked differences among habitats, with Thermodesulfobacteriota representing a major group in sediments. β-diversity and amplicon sequence variant (ASV)-sharing analyses revealed extensive overlap between sea ice and sediment diazotrophs. Given that sea ice is a transient habitat, these findings suggest that diazotrophs in sea ice originate from underlying sediments. Moreover, the Thermodesulfobacteriota ASVs detected in seawater were identical to those in sediments, indicating likely resuspension. Collectively, our results highlight sediments as key reservoirs of diazotrophs in the Pacific Arctic, particularly on the continental shelf.
The Multidisciplinary Observatory for Study of the Arctic Climate (MOSAiC) expedition consisted of a year-long drifting survey of the Central Arctic Ocean. The ecosystems component of MOSAiC included the sampling of molecular data, with metagenomes collected from a diverse range of environments. The generation of metagenome-assembled-genomes (MAGs) from metagenomes are a starting point for genome-resolved analyses. This dataset presents a catalogue of MAGs recovered from a set of 73 samples from MOSAiC, including 2407 prokaryotic and 56 eukaryotic MAGs, as well as annotations of a near complete eukaryotic MAG using the Joint Genome Institute (JGI) annotation pipeline. The metagenomic samples are from the surface ocean, chlorophyll maximum, mesopelagic and bathypelagic, within leads and under-ice ocean, as well as melt ponds, ice ridges, and first- and second-year sea ice. This set of MAGs can be used to benchmark microbial biodiversity in the Central Arctic Ocean, compare individual strains across space and time, and to study changes in Arctic microbial communities from the winter to summer, at a genomic level.
Sea ice is a crucial, yet declining, habitat in high latitude ecosystems. Here we present a high-temporal resolution amplicon sequence data set collected during the spring ice-algal bloom near Utqiaġvik, Alaska in 2021 to study sea-ice microbial dynamics. The ice-algal bloom peaked on May 8th, reaching 46.6 mg chlorophyll a m-2 and thereafter became limited by nitrate availability. A massive bloom of the oil-degrading bacterium, Oleispira (> 80% relative abundance), coincided with the algal bloom raising questions about hydrocarbon exposure. The sea-ice algal bloom was dominated by diatoms, particularly, Nitzschia spp. and transitioned into a flagellate-dominated postbloom community which aligned with melt-associated changes to the physicochemical environment. We explored the relationship between putative parasitoids, Chytridiomycetes, Thecofilosea (Cercozoa), Oomycetes, Syndiniales (Dinoflagellata) and Labyrinthulomycetes (Bigyra) and potential microalgal hosts. Chytrids peaked periodically suggesting synchronised infections and Cryothecomonas (Thecofilosea) was observed parasitizing Nitzschia spp. for the first time in Arctic sea ice. Co-occurrence analysis suggested that diatoms, especially Nitzschia, were the primary hosts of Pacific-Arctic parasitoids and that top-down parasitoid control may dramatically alter community composition over short timescales, such as days. These results provide important insights into the drivers of spring bloom timing and maintenance of microalgal diversity in sea ice.
Sea-ice algae account for a substantial part of annual primary production in ice-covered waters and are an important component of the Arctic marine food web. With climate-induced changes to snow and sea-ice cover and their impact on the surface ocean, such as earlier melt, thinner ice, and increased upper-ocean stratification, a shift toward earlier and more extensive nutrient limitation on ice algal growth can be expected. Therefore, increasing our understanding of the processes governing nutrient supply and uptake by sea-ice algae is essential. Here, we compiled a pan-Arctic dataset of concentrations of sea-ice and sub-ice nutrients and sea-ice chlorophyll a (chl a) to assess their regional and seasonal variability, as well as the relationship of sea-ice algae and nutrient dynamics in the Arctic Ocean. This dataset indicates that bottom sea-ice nutrient and chl a concentrations were highest in the central Canadian Arctic Archipelago (Resolute Passage) due to tidal-driven mixing at the ocean-ice interface, and lowest in the Arctic Ocean basins. At the regional scale, Pacific and Atlantic Water influence variability in sea-ice and sub-ice nutrient concentrations. Significant positive relationships of bottom sea-ice nutrient versus chl a concentrations were ubiquitous across the Arctic during the ice algal bloom, suggesting intracellular nutrient storage as an important mechanism to support ice algal growth. This relationship in turn alters nutrient ratios within the sea ice relative to sub-ice waters, decreasing NOx:PO4 ratios, while increasing NOx:Si(OH)4 ratios. In contrast, bottom sea-ice nutrient-chl a relationships were less common and sometimes negative when nutrient concentrations were low, likely reflecting nutrient limitation. In conclusion, we have demonstrated a pan-Arctic, yet regionally specific, influence of the ice algal community on bottom sea-ice nutrient concentrations.
Snow and ice topography impact and are impacted by fluxes of mass, energy, and momentum in Arctic sea ice. We measured the topography on approximately a 0.5 km 2 drifting parcel of Arctic sea ice on 42 separate days from 18 October 2019 to 9 May 2020 via Terrestrial Laser Scanning (TLS). These data are aligned into an ice-fixed, lagrangian reference frame such that topographic changes (e.g., snow accumulation) can be observed for time periods of up to six months. Using in-situ measurements, we have validated the vertical accuracy of the alignment to ± 0.011 m. This data collection and processing workflow is the culmination of several prior measurement campaigns and may be generally applied for repeat TLS measurements on drifting sea ice. We present a description of the data, a software package written to process and align these data, and the philosophy of the data processing. These data can be used to investigate snow accumulation and redistribution, ice dynamics, surface roughness, and they can provide valuable context for co-located measurements.
The international and interdisciplinary sea-ice drift expedition "The Multidisciplinary drifting Observatory for the Study of Arctic Climate" (MOSAiC) was conducted from October 2019 to September 2020. The aim of MOSAiC was to study the interconnected physical, chemical, and biological characteristics and processes from the atmosphere to the deep sea of the central Arctic system. The ecosystem team addressed current knowledge gaps and explored unknown biological properties over a complete seasonal cycle focusing on three major research areas: biodiversity, biogeochemical cycles, and linkages to the environment. In addition to the measurements of core properties along a complete seasonal cycle, dedicated projects covered specific processes and habitats, or organisms on higher taxonomic or temporal resolution in specific time windows. A wide range of sampling instruments and approaches, including sea-ice coring, lead sampling with pumps, rosette-based water sampling, plankton nets, remotely operated vehicles, and acoustic buoys, was applied to address the science objectives. Further, a broad range of process-related measurements to address, for example, productivity patterns, seasonal migrations, and diversity shifts, were made both in situ and onboard RV Polarstern. . This article provides a detailed overview of the sampling approaches used to address the three main science objectives. It highlights the core sampling program and provides examples of habitat- or process-specific sampling. The initial results presented include high biological activities in wintertime and the discovery of biological hotspots in underexplored habitats. The unique interconnectivity of the coordinated sampling efforts also revealed insights into cross-disciplinary interactions like the impact of biota on Arctic cloud formation. This overview further presents both lessons learned from conducting such a demanding field campaign and an outlook on spin-off projects to be conducted over the next years.
Snow plays an essential role in the Arctic as the interface between the sea ice and the atmosphere. Optical properties, thermal conductivity and mass distribution are critical to understanding the complex Arctic sea ice system's energy balance and mass distribution. By conducting measurements from October 2019 to September 2020 on the Multidisciplinary drifting Observatory for the Study of Arctic Climate (MOSAiC) expedition, we have produced a dataset capturing the year-long evolution of the physical properties of the snow and surface scattering layer, a highly porous surface layer on Arctic sea ice that evolves due to preferential melt at the ice grain boundaries. The dataset includes measurements of snow during MOSAiC. Measurements included profiles of depth, density, temperature, snow water equivalent, penetration resistance, stable water isotope, salinity and microcomputer tomography samples. Most snowpit sites were visited and measured weekly to capture the temporal evolution of the physical properties of snow. The compiled dataset includes 576 snowpits and describes snow conditions during the MOSAiC expedition.
Repeated transects have become the backbone of spatially distributed ice and snow thickness measurements crucial for understanding of ice mass balance. Here we detail the transects at the Multidisciplinary drifting Observatory for the Study of Arctic Climate (MOSAiC) 2019–2020, which represent the first such measurements collected across an entire season. Compared with similar historical transects, the snow at MOSAiC was thin (mean depths of approximately 0.1–0.3 m), while the sea ice was relatively thick first-year ice (FYI) and second-year ice (SYI). SYI was of two distinct types: relatively thin level ice formed from surfaces with extensive melt pond cover, and relatively thick deformed ice. On level SYI, spatial signatures of refrozen melt ponds remained detectable in January. At the beginning of winter the thinnest ice also had the thinnest snow, with winter growth rates of thin ice (0.33 m month−1 for FYI, 0.24 m month−1 for previously ponded SYI) exceeding that of thick ice (0.2 m month−1). By January, FYI already had a greater modal ice thickness (1.1 m) than previously ponded SYI (0.9 m). By February, modal thickness of all SYI and FYI became indistinguishable at about 1.4 m. The largest modal thicknesses were measured in May at 1.7 m. Transects included deformed ice, where largest volumes of snow accumulated by April. The remaining snow on level ice exhibited typical spatial heterogeneity in the form of snow dunes. Spatial correlation length scales for snow and sea ice ranged from 20 to 40 m or 60 to 90 m, depending on the sampling direction, which suggests that the known anisotropy of snow dunes also manifests in spatial patterns in sea ice thickness. The diverse snow and ice thickness data obtained from the MOSAiC transects represent an invaluable resource for model and remote sensing product development.
Abstract Snow depth on sea ice is an Essential Climate Variable and a major source of uncertainty in satellite altimetry‐derived sea ice thickness. During winter of the MOSAiC Expedition, the “KuKa” dual‐frequency, fully polarized Ku‐ and Ka‐band radar was deployed in “stare” nadir‐looking mode to investigate the possibility of combining these two frequencies to retrieve snow depth. Three approaches were investigated: dual‐frequency, dual‐polarization and waveform shape, and compared to independent snow depth measurements. Novel dual‐polarization approaches yielded r2 values up to 0.77. Mean snow depths agreed within 1 cm, even for data sub‐banded to CryoSat‐2 SIRAL and SARAL AltiKa bandwidths. Snow depths from co‐polarized dual‐frequency approaches were at least a factor of four too small and had a r2 0.15 or lower. r2 for waveform shape techniques reached 0.72 but depths were underestimated. Snow depth retrievals using polarimetric information or waveform shape may therefore be possible from airborne/satellite radar altimeters.
Low-salinity meltwater from Arctic sea ice and its snow cover accumulates and creates under-ice meltwater layers below sea ice. These meltwater layers can result in the formation of new ice layers, or false bottoms, at the interface of this low-salinity meltwater and colder seawater. As part of the Multidisciplinary drifting Observatory for the Study of the Arctic Climate (MOSAiC), we used a combination of sea ice coring, temperature profiles from thermistor strings and underwater multibeam sonar surveys with a remotely operated vehicle (ROV) to study the areal coverage and temporal evolution of under-ice meltwater layers and false bottoms during the summer melt season from mid-June until late July. ROV surveys indicated that the areal coverage of false bottoms for a part of the MOSAiC Central Observatory (350 by 200 m2) was 21%. Presence of false bottoms reduced bottom ice melt by 7–8% due to the local decrease in the ocean heat flux, which can be described by a thermodynamic model. Under-ice meltwater layer thickness was larger below first-year ice and thinner below thicker second-year ice. We also found that thick ice and ridge keels confined the areas in which under-ice meltwater accumulated, preventing its mixing with underlying seawater. While a thermodynamic model could reproduce false bottom growth and melt, it could not describe the observed bottom melt rates of the ice above false bottoms. We also show that the evolution of under-ice meltwater-layer salinity below first-year ice is linked to brine flushing from the above sea ice and accumulating in the meltwater layer above the false bottom. The results of this study aid in estimating the contribution of under-ice meltwater layers and false bottoms to the mass balance and salt budget for Arctic summer sea ice.
A ground-based ultra-wideband radiometer operating at 540, 900, 1380, and 1740 MHz was used to measure microwave thermal emissions from an Arctic sea ice floe as part of the Multidisciplinary drifting Observatory for the Study of Arctic Climate (MOSAiC) Expedition. The instrument was deployed on a drifting ice floe near 86 degrees N, 120 degrees E in leg 1 of the expedition (December 2019) and observed second-year ice (potentially with refrozen melt ponds) that experienced new ice growth at its base over a ten-day period. Measured circularly polarized brightness temperatures were compared with the predictions of a radiative transfer (RT) model for a layered medium consisting of ocean, growing new ice, desalinated remnant second-year ice/refrozen melt pond, and snow layers. Characteristics of the sea ice composition used in the model were determined from in-situ measurements. Comparisons of the measured and modeled wideband brightness temperatures showed good agreement consistently over the observation period and for various off-nadir observation angles. The results demonstrate the capabilities of 0.5-2 GHz microwave radiometry for observing sea ice properties and also show the impact of a saline ice layer at the ice bottom on the measured brightness temperature.
Abstract Sea-ice pore microstructure constrains ice transport properties, affecting fluid flow relevant to oil-in-ice transport and biogeochemical processes. Motivated by a lack of pore microstructural data, in particular for granular ice and across the seasonal cycle, throat size, tortuosity, connectivity, and other microstructural variables were derived from X-ray computed tomography for brine-filled pores in seasonal landfast ice off northern Alaska. Data were obtained for granular and columnar ice during the ice growth, transition, and melt season. While granular ice exhibits a more heterogeneous pore space than columnar ice, pore and throat size distributions are comparable. The greater tortuosity of pores in granular (1.2 < τg < 1.7) compared to columnar ice (1.0 < τc < 1.1) compounded with a less interconnected pore space translates into lower permeability for granular ice during the growth season for a given porosity. The microstructural data explain findings of granular ice hindering vertical oil-in-ice transport during ice growth and transition stage. With granular ice more frequent in the changing Arctic, data from studies such as this are needed to inform improved modeling of porosity-permeability relationships.
The sub-kilometre scale distribution of snow depth on Arctic sea ice impacts atmosphere-ice fluxes of energy and mass, and is of importance for satellite estimates of sea ice thickness from both radar and lidar altimeters. While information about the mean of this distribution is increasingly available from modelling and remote sensing, the full distribution cannot yet be resolved. We analyse 33539 snow depth measurements from 499 transects taken at Soviet drifting stations between 1955 and 1991 and derive a simple statistical distribution for snow depth over multi-year ice as a function of only the mean snow depth. We then evaluate this snow depth distribution against snow depth transects that span first-year ice to multiyear ice from the MOSAiC, SHEBA and AMSR-Ice field campaigns. Because the distribution can be generated using only the mean snow depth, it can be used in the downscaling of several existing snow depth products for use in flux modelling and altimetry studies.
The increased fraction of first year ice (FYI) at the expense of old ice (second-year ice (SYI) and multi-year ice (MYI)) likely affects the permeability of the Arctic ice cover. This in turn influences the pathways of gases circulating therein and the exchange at interfaces with the atmosphere and ocean. We present sea ice temperature and salinity time series from different ice types relevant to temporal development of sea ice permeability and brine drainage efficiency from freeze-up in October to the onset of spring warming in May. Our study is based on a dataset collected during the Multidisciplinary drifting Observatory for the Study of Arctic Climate (MOSAiC) Expedition in 2019 and 2020. These physical properties were used to derive sea ice permeability and Rayleigh numbers. The main sites included FYI and SYI. The latter was composed of an upper layer of residual ice that had desalinated but survived the previous summer melt and became SYI. Below this ice a layer of new first-year ice formed. As the layer of new first-year ice has no direct contact with the atmosphere, we call it insulated first-year ice (IFYI). The residual/SYI-layer also contained refrozen melt ponds in some areas. During the freezing season, the residual/SYI-layer was consistently impermeable, acting as barrier for gas exchange between the atmosphere and ocean. While both FYI and SYI temperatures responded similarly to atmospheric warming events, SYI was more resilient to brine volume fraction changes because of its low salinity ( < 2). Furthermore, later bottom ice growth during spring warming was observed for SYI in comparison to FYI. The projected increase in the fraction of more permeable FYI in autumn and spring in the coming decades may favor gas exchange at the atmosphere-ice interface when sea ice acts as a source relative to the atmosphere. While the areal extent of old ice is decreasing, so is its thickness at the onset of freeze-up. Our study sets the foundation for studies on gas dynamics within the ice column and the gas exchange at both ice interfaces, i.e. with the atmosphere and the ocean.
Data from the Multidisciplinary drifting Observatory for the Study of Arctic Climate (MOSAiC) expedition allowed us to investigate the temporal dynamics of snowfall, snow accumulation and erosion in great detail for almost the whole accumulation season (November 2019 to May 2020). We computed cumulative snow water equivalent (SWE) over the sea ice based on snow depth and density retrievals from a SnowMicroPen and approximately weekly measured snow depths along fixed transect paths. We used the derived SWE from the snow cover to compare with precipitation sensors installed during MOSAiC. The data were also compared with ERA5 reanalysis snowfall rates for the drift track. We found an accumulated snow mass of 38 mm SWE between the end of October 2019 and end of April 2020. The initial SWE over first-year ice relative to second-year ice increased from 50 % to 90 % by end of the investigation period. Further, we found that the Vaisala Present Weather Detector 22, an optical precipitation sensor, and installed on a railing on the top deck of research vessel Polarstern, was least affected by blowing snow and showed good agreements with SWE retrievals along the transect. On the contrary, the OTT Pluvio2 pluviometer and the OTT Parsivel2 laser disdrometer were largely affected by wind and blowing snow, leading to too high measured precipitation rates. These are largely reduced when eliminating drifting snow periods in the comparison. ERA5 reveals good timing of the snowfall events and good agreement with ground measurements with an overestimation tendency. Retrieved snowfall from the ship-based Ka-band ARM zenith radar shows good agreements with SWE of the snow cover and differences comparable to those of ERA5. Based on the results, we suggest the Ka-band radar-derived snowfall as an upper limit and the present weather detector on RV Polarstern as a lower limit of a cumulative snowfall range. Based on these findings, we suggest a cumulative snowfall of 72 to 107 mm and a precipitation mass loss of the snow cover due to erosion and sublimation as between 47 % and 68 %, for the time period between 31 October 2019 and 26 April 2020. Extending this period beyond available snow cover measurements, we suggest a cumulative snowfall of 98–114 mm.
Oil production in Arctic ice-covered areas poses a risk for pollution of the ecosystem including that within the brine channel network of sea ice. Sea-ice autotrophs contribute substantially to Arctic primary production, but are inherently difficult to test for oil exposure responses in situ. This study had two objectives, first, we developed a suitable lab-based mesocosm system, second, we tested oil effects on sea-ice algae. Specifically, we investigated if Alaska North Slope crude oil exposure reduces ice algal abundance, biomass and concentration of extracellular polymeric substances (EPS) using indoor ice tanks over a 10-day exposure period. Six tanks in one cold room were used in pairs for the following treatments: (1) control, (2) oil release as a layer under ice and (3) release of dispersed oil. All tanks were inoculated with sea-ice microbial communities collected from Utqiaġvik, Alaska. After 10 days of exposure, the abundance of algae, dominated by the pennate diatom genus Nitzschia, and the concentrations of EPS and chlorophyll a were significantly lower in the oiled treatments compared to the control. We suggest light attenuation by the oil, reduced algal mobility, and oil toxicity as causes for this reduction. Observed changes in cell fluorescence characteristics based on DNA staining could be linked to the oil exposure and could provide a new tool for assessment of toxicity in microalgae.
Sea ice affects the exchange of energy and matter between the atmosphere and the ocean from local to hemispheric scales. Salt fluxes across the ice-ocean interface that drive thermohaline mixing beneath growing sea ice are important elements of upper ocean nutrient and carbon exchange. Sea-ice melt releases freshwater into the upper ocean and results in formation of melt ponds that affect gas and energy transfer across the atmosphere-ice interface. The Multidisciplinary drifting Observatory for the Study of Arctic Climate (MOSAiC) provided an opportunity to follow sea-ice evolution and exchange processes over a full seasonal cycle in a rapidly changing ice cover. To this end, approximately 25 sea-ice cores were collected at 2 distinct sites, representing first-year and multi-year ice, to monitor physical, biological and geochemical processes relevant to atmosphere-ice-ocean exchange processes. Here we compare the growth and decay of first-year ice in the Central Arctic during the winter 2019-2020 to that of landfast first-year ice at Utqiaġvik, Alaska, from 1998 to 2016. Ice stratigraphy was similar at both sites with about 15 cm of granular ice on top of columnar ice, with a comparable growth history with a similar maximum ice thickness of 1.6-1.7 m. We aggregated the sea-ice bulk salinity and temperature profiles using a degree-day approach, and examined brine and freshwater fluxes at lower and upper interfaces of the ice, respectively. Preliminary results show lower sea-ice bulk salinity during the growth season and greater desalination at the ice surface during the melt season at the MOSAiC floe in comparison to Utqiaġvik.
Sea ice plays a critical role in the Arctic climate system, regulating much of the energy transfer between the ocean and the atmosphere. Repeat measurements of ice mass balance at discrete points allow us to determine the direct response of sea ice mass to environmental conditions. We installed a network of mass balance measurement sites across the MOSAiC Central Observatories, distributed over a diverse range of ice types and features. The sites were composed of gridded arrays of 9-17 hotwire thickness gauges, each paired with a surface ablation stake. Seven sites were installed on first year ice, and seven on second or multi year ice, with a total of 120+ individual measurement stations. The sites were operational over different periods throughout the year; several were destroyed or became inaccessible during ridging events. Initial ice thicknesses ranged from 0.13-3.50 m. We made measurements of ice and snow interfaces and thicknesses with 1 cm precision at each station, at intervals of 2-3 weeks during the growth season and as few as 1-2 days during the melt season. From these measurements, we infer ice growth, ice bottom melt, ice surface melt, snow deposition, snow erosion, and snow melt. The time series spans October 2019–September 2020, with a five-week measurement gap beginning mid-May 2020. We present an overview of the measurements and preliminary analysis, partitioning results by ice type and comparing mass balance to concurrent atmosphere and ocean measurements. We identify trends in the seasonal evolution of different ice types, and give particular attention to notable events in the time series. As true point-measurements, the data are especially relevant in improving one-dimensional thermodynamic sea ice models. The results also provide validation for satellite and electromagnetic induction ice-thickness measurements made during MOSAiC, which offer higher areal coverage but lower measurement- and spatial-precision.
Abstract. Data from the Multidisciplinary drifting Observatory for the Study of Arctic Climate (MOSAiC) expedition allowed us to investigate the temporal dynamics of snowfall, snow accumulation, and erosion in great detail for almost the whole accumulation season (November 2019 to May 2020). We computed cumulative snow water equivalent (SWE) over the sea ice based on snow depth (HS) and density retrievals from a SnowMicroPen (SMP) and approximately weekly-measured snow depths along fixed transect paths. Hence, the computed SWE considers surface heterogeneities over an average path length of 1469 m. We used the SWE from the snow cover to compare with precipitation sensors installed during MOSAiC. The data were compared with ERA5 reanalysis snowfall rates for the drift track. Our study shows that the simple fitted HS-SWE function can well be used to compute SWE along a transect path based on SMP SWE retrievals and snow-depth measurements. We found an accumulated snow mass of 34 mm SWE until 26 April 2020. Further, we found that the Vaisala Present Weather Detector 22 (PWD22), installed on a railing on the top deck of research vessel Polarstern was least affected by blowing snow and showed good agreements with SWE retrievals along the transect, however, it also systematically underestimated snowfall. The OTT Pluvio2 and the OTT Parsivel2 were largely affected by wind and blowing snow, leading to higher measured precipitation rates, but when eliminating drifting snow periods, especially the OTT Pluvio2 shows good agreements with ground measurements. A comparison with ERA5 snowfall data reveals a good timing of the snowfall events and good agreement with ground measurements but also a tendency towards overestimation. Retrieved snowfall from the ship-based Ka-band ARM Zenith Radar (KAZR) shows good agreements with SWE of the snow cover and comparable differences as ERA5. Assuming the KAZR derived snowfall as an upper limit and PWD22 as a lower limit of a cumulative snowfall range, we estimate 72 to 107 mm measured between 31 October 2019 and 26 April 2020. For the same period, we estimate the precipitation mass loss along the transect due to erosion and sublimation as between 53 and 68 %. Until 7 May 2020, we suggest a cumulative snowfall of 98–114 mm.
Due to logistical challenges, snowfall in the high Arctic has rarely been measured, which is particularly valid for longer time-spans and the polar night. When estimating snowfall with precipitation gauges, a snowfall reference and detailed knowledge of how the precipitated snow accumulated or eroded is required. To overcome snowfall uncertainties and to improve accumulated and eroded snow estimates, we used data from precipitation gauges, snow particle counters (SPCs) and a Ka-Band ARM Zenith Radar (KAZR) installed on and around research vessel (RV) Polarstern during the snow accumulation season of MOSAiC (October 2019 - May 2020). In addition to this, direct snow water equivalent (SWE) measurements were conducted and SWE estimates were retrieved from SnowMicroPen (SMP) measurements distributed all over the floe. The evolution of accumulated snow mass was finally computed by applying a simple fitted z-SWE function to snow depths that were measured approximately weekly along a fixed transect path with a Magnaprobe. The transects paths were along two distinct ice types: predominantly level remnant ice that at the start of the winter had large refrozen melt ponds, and predominantly deformed thick second year ice (SYI). We could show that at least 34 mm of snow has accumulated and approximately 9 kg m-2 of snow mass was eroded between 31 October 2019 and 26 April 2020. In the beginning of the winter, the total estimated SWE on level remnant ice was only 42 % of SWE on deformed SYI. By end of April 2020 the values almost equalized as the snow mass on remnant ice reached almost 90 % of the snow mass over deformed SYI. Based on the SWE evolution of the snowpack, we validated precipitation sensors and the reanalysis ERA5 for their capability to estimate snowfall. Eroded snow mass, among other processes, led to a discrepancy of precipitation- sensor estimated snowfall and computed SWE of the snow cover from 20 February 2020 on. However, for the time period before the first net erosion could be observed we found best agreements of cumulated snowfall and SWE for the Vaisala Present Weather Detector (PWD22) installed on the vessel (RMSE = 2 mm) and for snowfall retrievals from the KAZR (RMSE = 4 mm). Other sensors largely overestimated snowfall (corrected OTT Pluvio2: 14 mm; Vaisala PWD22 on the ice: 26 mm, OTT Parsivel2 on RV Polarstern: 51 mm). ERA5 overestimates snowfall too, with 13 mm and an increasing positive bias from March 2020 on. With horizontal snow mass fluxes derived from SPCs we could show that the Vaisala PWD22 on RV Polarstern was effectively protected against blowing snow. This, however, greatly affected snowfall measurements of instruments collocated on the ice. Further, we investigated a high-wind event in February 2020 resulting in high blowing snow mass fluxes and an average eroded snow mass of 5.5 kg m-2. The lifted blowing snow particles from the surface led to strong overestimation of snowfall from instruments installed on the ice which cannot be corrected with conventional correction methods.
 Polona Itkin合作论文数Dept Phys & Technol, UiT Arctic Univ Norway14
 Ian Raphael合作论文数Thayer Sch Engn, Dartmouth Coll12
 Matthias Jaggi合作论文数Spallation Neutron Source Division, Paul Scherrer Institut12
 Hajo Eicken合作论文数International Arctic Research Center, University of Alaska Fairbanks11
 Stefan Hendricks合作论文数Alfred Wegener Inst Polar & Marine Res11
 Martin Schneebeli合作论文数WSL Institute for Snow;Avalanche Research;WSL Institute for Snow|Avalanche Research11David Nicholas Wagner合作论文数WSL Inst Snow & Avalanche Res SLF10
 Marcel Nicolaus合作论文数Norwegian Polar Institute9
 Amy R. Macfarlane合作论文数WSL Inst Snow & Avalanche Res SLF8Steven Fons合作论文数College Pk, Univ Maryland8Julia Regnery合作论文数8
 Stefanie Arndt合作论文数Helmholtz Zentrum Polar & Meeresforsch, Alfred Wegener Inst8
 Robert Ricker合作论文数8
 Ilkka Seppo Olavi Matero合作论文数Helsingin Yliopisto, University of Helsinki8
 Mats A. Granskog合作论文数Division of Geophysics, University of Helsinki8
 Daniela Krampe合作论文数7
 Don Perovich合作论文数Thayer School of Engineering, Dartmouth College7
 Glen E. Liston合作论文数Cooperative Institute for Research in the Atmosphere, Colorado State University7David Clemens-Sewall合作论文数6Allison Fong合作论文数6
 Michael Lehning合作论文数School of Architecture, Civil and Environmental Engineering, École Polytechnique Fédérale de Lausanne6
 Polashenski Chris M合作论文数Dartmouth Coll6
 Knut Vilhelm Høyland合作论文数Department of Civil and Environmental Engineering, Norwegian University of Science and Technology5Nikolai Kolabutin合作论文数5Melinda Webster合作论文数Univ Alaska Fairbanks5
 Julienne Stroeve合作论文数Centre for Polar Observation and Modelling, University College London5
 Amelie Kirchgaessner合作论文数5Oguz Demir合作论文数4
 Arttu Jutila合作论文数4
 Jeremy Wilkinson合作论文数4
 Dmitry Divine合作论文数Scientific Research Department, Norwegian Polar Institute4
 Markus M. Frey合作论文数University of Arizona, University of California4
 Matthew Shupe合作论文数NOAA Physical Sciences Laboratory;Cooperative Institute for Research in Environmental Sciences, University of Colorado4a sigg合作论文数3k startchev合作论文数3Egor Shimanchuk合作论文数3Thomas Newman合作论文数3
 Evgenii Salganik合作论文数Norwegian Univ Sci & Technol3
 Robbie Mallett合作论文数UCL, Ctr Polar Observat & Modelling3guillaume bonnier合作论文数3
 Vishnu Nandan合作论文数University of Calgary3
 Adam Ulfsbo合作论文数Dept Marine Sci, Univ Gothenburg3
 Mario Hoppmann合作论文数Helmholtz Ctr Polar & Marine Res, Alfred Wegener Inst3
 Meibing Jin (金梅兵)合作论文数Nanjing University of Information Science & Technology3Mark Sawley合作论文数School of Engineering, École Polytechnique Fédérale de Lausanne3
 Mohamed Farhat合作论文数School of Engineering, École Polytechnique Fédérale de Lausanne3Rosemary Willatt合作论文数Earth Sciences, Faculty of Mathematical & Physical Sciences, University College London3
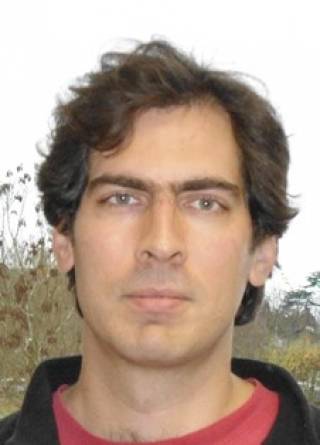 Michel Tsamados合作论文数Earth Sciences, Faculty of Mathematical & Physical Sciences, University College London3
 Christian Katlein合作论文数Helmholtz Center for Polar and Marine Research, Alfred Wegener Institute3




