Biomass combustion is a major biogeochemical process, but uncertain in magnitude. We examined multiple levels of organization (twigs, branches, trees, stands, and landscapes) in large, severe forest fires to see how combustion rates for live aboveground woody parts varied with tree species, size, and fire severity in Ponderosa pine (Pinus ponderosa Dougl. ex Laws.) and mixed conifer-dominated forests of the Sierra Nevada, California, USA. In high severity fire patches, most combustion loss was from branches < 2 cm diameter; in low to moderate severity patches, most was from bole charring. Combustion rates decreased as fire severity declined and with increasing tree size. Pinus species had little branch combustion, leading them to have ≈50% the combustion rate of other taxa. Combustion rates could be 100% for small branch segments and up to 57% for small tree aboveground woody biomass in high severity fire patches. However, combustion rates are very low overall at the stand (0.1%–3.2%) and landscape level (0.6%–1.8%), because large trees with low combustion rates comprise the majority of biomass, and high severity fire patches are less than half of the area burned. Our findings of low live wood combustion rates have important implications for policies related to wildfire emissions and forest management.
Rising temperatures could increase forest ecosystem disturbance frequency and severity, transferring large amounts of live biomass to coarse woody debris (CWD) pools that emit carbon (C). The type of disturbance-created CWD influences the rate, amount, and duration of this C emission. We studied the effect of a large-scale disturbance on CWD dynamics in spruce-dominated forests of the Kenai Peninsula, Alaska, by determining CWD decomposition rate constants (k) using the chronosequence and decomposition-vectors methods and by modeling the hypothetical CWD dynamics occurring after a bark beetle outbreak versus a windthrow. Chronosequence-based k’s for mass ranged between 0.020 and 0.022 year −1 for logs and between 0.000 and 0.003 year −1 for snags. Decomposition-vectors-based k’s for log mass ranged between 0.022 and 0.045 year −1 among three decomposition phases and between 0.014 and 0.048 year −1 among five decay classes. Our analysis showed that snag-generating disturbances delayed C flux from CWD to the atmosphere, produced a smaller magnitude of C flux, and had the potential to store 10% to 66% more C in the system over time than disturbances generating logs. Thus, landscapes affected by disturbances creating snags (versus logs) may revert faster to C neutrality, suggesting forest management practices should reflect these differences.
Woody detritus (WD), created by mortality of trees and their associated parts, is an important component of forested ecosystems with roles in energy flow, hydrologic and geomorphologic processes as well as in carbon and nutrient cycling. Although likely to be increasingly important as forest systems respond to climatic and other human induced changes, WD-related science is just beginning relative to other aspects of forested ecosystems. WD differs from other litter forms and soil in key ways (i.e., size range, rigidity, and heterogeneity) that limit the application of many paradigms currently used in studying and modeling decomposition. Thus, while temperature and concentrations of lignin and nitrogen are important controls, others factors related to moisture and its interaction with canopy openness, WD size, position relative to the soil surface, and decomposers need to be better understood. Moreover, the unique attributes of WD decomposers need to be acknowledged as they have evolved over hundreds of millions of years to efficiently process this high lignin, low nutrient substrate. Given the heterogeneity within and among WD entities, WD behavior can be extremely non-linear, often resulting in cascades of activity rather than all or nothing behavior. Substantial improvements in understanding and modeling the respiration, fragmentation, leaching, and burial involved during WD decomposition are required to accurately assess the impact of global increases in tree mortality. Additionally understanding how the perception of WD-related processes changes with scale and organizational level is required to fully understand WD’s role in past, present, and future biogeochemical cycling.
Abstract Ecosystem structure and processes of coastal temperate rainforests of the Pacific Northwest are thought to be strongly influenced by herbivory primarily of Roosevelt elk (Cervus elaphus roosevelti) and secondarily of Columbian black‐tailed deer (Odocoileus hemionus columbianus). Two large (0.5‐ha) exclosures were built in old‐growth coniferous rainforest communities in Olympic National Park, Washington, during 1979 to study these effects. Cover of shrubs, ferns, herbs, and graminoids and numbers of tree seedlings were described over 36 yr. Results show a sequence following ungulate exclusion of early release of shrubs, ferns, and herbs followed by eventual dominance of shrubs as other vegetation layers become shaded. Short‐term responses of individual species reflected functional traits related to ability to avoid or tolerate herbivory. Over the longer term, effects reflected changing competitive relationships among vegetation layers and other ecosystem dynamics such as the provision of fallen trees in the appropriate decay class to serve as establishment substrate for tree seedlings. In aggregate, vegetation composition shifted after 36 yr from a system dominated by herbaceous cover with a major graminoid component to one dominated by shrubs (5‐ to 6‐fold absolute increase) and ferns (5–7% increase in absolute cover), less absolute herb cover (15–20% loss), and almost no graminoids (<1.5% cover remaining in any plot) after 36 yr. These changes represented a substantial loss in plant community diversity with a loss of 46 of 74 species. Elk abundance outside of the exclosures began to decline in the 1990s leading to parallel changes in plant community trajectories outside of exclosures to those initially seen inside. While this suggests plant community responses inside the exclosures were also driven by elk exclusion, the strength of this response depends on elk abundance.
Sporocarps of wood decay fungi contain functional information about how different taxa partition carbon and nitrogen resources from wood. We combined carbon and nitrogen concentrations, isotopic ratios (13C:12C, 15N:14N, and 14C:12C, expressed as δ13C, δ15N, and Δ14C values), and compositional patterns in wood, cellulose, and sporocarps to investigate functional and isotopic differences in six taxa of decay fungi during log decomposition. Radiocarbon (Δ14C) measurements separated fungi into heartwood colonizers (Fomitopsis and Hericium, ~30+-year-old carbon) and sapwood colonizers (Mycena, Hypholoma, and Trametes, 1-12-year-old carbon). Decay modes influenced δ13C, with Hericium, a selective white-rot fungus, higher in δ13C than nonselective white-rot fungi because Hericium preferentially assimilated 13C-enriched hemicellulose rather than cellulose. Fungal δ15N was lower in heartwood colonizers than in sapwood colonizers, presumably reflecting greater N turnover and 15N enrichment in sapwood than in heartwood. Sporocarp δ15N correlated with sporocarp %N and with the relative proportion of protein in N-containing pyrolysis products because fungal protein was 4–5‰ higher in δ15N (and 3–4‰ higher in δ13C) than non-protein. From these measurements, we improved the quantitative and conceptual understanding of how sources, composition and metabolic processing determined isotopic composition of fungi.
Abstract Background Recent increases in forest tree mortality should increase the abundance coarse woody detritus (CWD) and ultimately lead to increased atmospheric carbon dioxide. However, the time course of carbon release from CWD is not well understood. We compiled CWD decomposition rate-constants (i.e., k) to examine how tree species, piece diameter, position (i.e., standing versus downed), canopy openness, and macroclimate influenced k. To illustrate their implications we modeled the effect of species and position on estimates of decomposition-related carbon flux. We examined a subset of currently used models to determine if their structure accounted for these factors. Results Globally k of downed CWD varied at least 244-fold with interspecies variation at individual sites up to 76-fold. While k generally decreased with increasing piece diameter, under open canopies the opposite occurred. Standing CWD sometimes exhibited little decomposition, but sometimes had k values up to 3 times faster than downed CWD. There was a clear response of k to mean annual temperature of ≈ 2.6 times per 10 ℃; however, there was considerable variation for a given mean annual temperature related to species, diameter, and position. A key feature of carbon release from CWD after disturbance was the “evolution” of the ecosystem-level k value as positions and species mixtures of the remaining CWD changed. Variations in decomposition caused by disturbance (e.g., changes in species, positions, sizes, and microclimate) had the potential to cause net carbon fluxes to the atmosphere to be highly nonlinear. While several models currently being used for carbon accounting and assessing land-use/climate change would potentially capture some of these post disturbance changes in fluxes and carbon balances, many would not. Conclusions While much has been learned in the last 5 decades about CWD decomposition, to fully understand the time course of carbon release from increased mortality and other aspects of global change a new phase of global CWD research that is more systematic, experimental, and replicated needs to be initiated. If our findings are to be fully applied in modeling, an approach acknowledging how the rate of carbon release evolves over time should be implemented.
Mortality of trees is an important ecological process altering forest structure and function as well as influencing forest management decisions. Recent observations suggest that the overall rate of tree mortality is increasing at local to global scales. While more data on mortality is needed to document these changes, key concepts are also needed to guide the collection, interpretation, and use of this information. Mortality can be considered as a general process that includes all forms of tree-related death ranging from parts of trees to large-scale disturbances. Viewing mortality as a continuum allows one to examine how the lifespan of trees and their parts (e.g., branches), as well as multiple disturbances, influence ecosystem structure and function. Statistically, mortality does not follow the law of large numbers because, regardless of the scale analyzed, consequential, infrequent episodes can occur. This causes mortality to occur in irregular pulses. While the causes of mortality are indeed complex, this stems from the fact many processes, each with its own set of controls, can lead to mortality. By analyzing and predicting mortality using a chain of events influenced by specific mechanisms, a clearer understanding of this process should develop, leading to a more science-based and less reactive forest management.
Substitution of wood for more fossil carbon intensive building materials has been projected to result in major climate mitigation benefits often exceeding those of the forests themselves. A reexamination of the fundamental assumptions underlying these projections indicates long-term mitigation benefits related to product substitution may have been overestimated 2- to 100-fold. This suggests that while product substitution has limited climate mitigation benefits, to be effective the value and duration of the fossil carbon displacement, the longevity of buildings, and the nature of the forest supplying building materials must be considered.
Wind is an important disturbance in many forested regions, but research has largely focused on immediate to short-term (<10 years) effects on species composition and structure of stands and landscapes. We used a set of ten, 0.4-ha plots established in 1935 and measured every 5–13 years to examine the cumulative effects of multiple wind disturbance events in the coastal forests of Oregon. Since 1935 there have been ten documented wind events in coastal Oregon with hurricane-force winds. Most of the eight windstorms since 1962 noticeably influenced at least one plot; however, no individual storm clearly influenced all plots. Net rate of biomass accumulation of plots was negative when biomass mortality exceeded 29–41 Mg/ha per 5-year period (or 3.4%–5.8% per 5 years). In contrast, wind disturbance did not clearly reduce NPP (Net Primary Production) in any plot until biomass mortality exceeded 50%. Major wind-related mortality episodes in individual plots did not necessarily strongly influence the average loss of biomass across all plots. For example, a biomass loss of 88% in one plot resulted in an average loss of only 3.4% across all plots. In contrast, the cumulative effect of multiple plots with repeated wind-related mortality did decrease biomass at the multi-plot level. Depending on the plot, wind caused 16%–59% of the total mortality over time, and the proportion of wind-related mortality has increased 5- to 8-fold since 1940. The majority (80%) of wind-related mortality was “immediate”, but some trees survived up to 35 years after being significantly wind damaged. Despite western hemlock having a wind-related mortality rate that was at least twice that of Sitka spruce, the number of stems of the former species increased over time. This trend may be related to the predominant recovery mechanism which was the release of existing small trees and the fact that the majority of ingrowth was western hemlock. This study suggests that wind disturbance is a heterogeneous, gradual process and that while individual events have a detectable impact on structure and function, the largest impacts, at least in systems where it reoccurs each decade, are cumulative.
Abstract Downed coarse woody debris, also known as coarse woody detritus or downed dead wood, is challenging to estimate for many reasons, including irregular shapes, multiple stages of decay, and the difficulty of identifying species. In addition, some properties are commonly not measured, such as wood density and carbon concentration. As a result, there have been few previous evaluations of uncertainty in estimates of downed coarse woody debris, which are necessary for analysis and interpretation of the data. To address this shortcoming, we quantified uncertainties in estimates of downed coarse woody debris volume and carbon storage using data collected from permanent forest inventory plots in the northeastern United States by the Forest Inventory and Analysis program of the USDA Forest Service. Quality assurance data collected from blind remeasurement audits were used to quantify error in diameter measurements, hollowness of logs, species identification, and decay class determination. Uncertainty estimates for density, collapse ratio, and carbon concentration were taken from the literature. Estimates of individual sources of uncertainty were combined using Monte Carlo methods. Volume estimates were more reliable than carbon storage, with an average 95% confidence interval of 15.9 m3/ha across the 79 plots evaluated, which was less than the mean of 31.2 m3/ha. Estimates of carbon storage (and mass) were more uncertain, due to poorly constrained estimates of the density of wood. For carbon storage, the average 95% confidence interval was 11.1 Mg C/ha, which was larger than the mean of 4.6 Mg C/ha. Accounting for the collapse of dead wood as it decomposes would improve estimates of both volume and carbon storage. On the other hand, our analyses suggest that consideration of the hollowness of downed coarse woody debris pieces could be eliminated in this region, with little effect. This study demonstrates how uncertainty analysis can be used to quantify confidence in estimates and to help identify where best to allocate resources to improve monitoring designs.
Atmospheric greenhouse gases (GHGs) must be reduced to avoid an unsustainable climate. Because carbon dioxide is removed from the atmosphere and sequestered in forests and wood products, mitigation strategies to sustain and increase forest carbon sequestration are being developed. These strategies require full accounting of forest sector GHG budgets. Here, we describe a rigorous approach using over one million observations from forest inventory data and a regionally calibrated life-cycle assessment for calculating cradle-to-grave forest sector emissions and sequestration. We find that Western US forests are net sinks because there is a positive net balance of forest carbon uptake exceeding losses due to harvesting, wood product use, and combustion by wildfire. However, over 100 years of wood product usage is reducing the potential annual sink by an average of 21%, suggesting forest carbon storage can become more effective in climate mitigation through reduction in harvest, longer rotations, or more efficient wood product usage. Of the similar to 10 700 million metric tonnes of carbon dioxide equivalents removed from west coast forests since 1900, 81% of it has been returned to the atmosphere or deposited in landfills. Moreover, state and federal reporting have erroneously excluded some product-related emissions, resulting in 25%-55% underestimation of state total CO2 emissions. For states seeking to reach GHG reduction mandates by 2030, it is important that state CO2 budgets are effectively determined or claimed reductions will be insufficient to mitigate climate change.
Forests provide significant long-term carbon (C) storage, but have the potential to increase future C emissions with a changing climate. Aboveground biomass, C stores, and the effect of disturbance were examined using forest inventory data collected across all ownerships on 6.2 million ha in Coastal Alaska. We modelled six C pools using empirical data, estimated two others using the literature, and quantified estimate uncertainty. The average (+/- SE) aboveground live (218.9 +/- 4.6 Mg/ha) and log (28.1 +/- 1.8 Mg/ha) biomass in the Alaskan Temperate ecoregion were among the lowest in the Pacific Northwest, whereas snag biomass (30.5 +/- 1.0 Mg/ha) was among the highest. In the Alaskan Boreal ecoregion, on the Kenai Peninsula, coarse woody debris (CWD) biomass comprised almost 50% of the regional average of aboveground woody biomass (76.7 +/- 3.8 Mg/ha) with bark beetle damaged stands containing 82% of the total CWD biomass. In contrast, in the Temperate ecoregion, CWD comprised 20% of the regional aboveground woody average (277.5 +/- 5.4 Mg/ha) with 76% of total CWD biomass in undisturbed stands. Total C stores estimates in Coastal Alaska forests ranged between 1523.6 and 1892.8 Tg with the highest contribution from soils. The largest potential reductions in uncertainty are related to the tree and soils C pools. Disturbance determined total biomass amounts in the system and controlled the ratio between live and dead biomass pools and thus has the ability to shift forest stands into a C source to the atmosphere.
Motivation: The BioTIME database contains raw data on species identities and abundances in ecological assemblages through time. These data enable users to calculate temporal trends in biodiversity within and amongst assemblages using a broad range of metrics. BioTIME is being developed as a community-led open-source database of biodiversity time series. Our goal is to accelerate and facilitate quantitative analysis of temporal patterns of biodiversity in the Anthropocene.Main types of variables included: The database contains 8,777,413 species abundance records, from assemblages consistently sampled for a minimum of 2 years, which need not necessarily be consecutive. In addition, the database contains metadata relating to sampling methodology and contextual information about each record.Spatial location and grain: BioTIME is a global database of 547,161 unique sampling locations spanning the marine, freshwater and terrestrial realms. Grain size varies across datasets from 0.0000000158 km(2) (158 cm(2)) to 100 km(2) (1,000,000,000,000 cm(2)).Time period and grainBio: TIME records span from 1874 to 2016. The minimal temporal grain across all datasets in BioTIME is a year.Major taxa and level of measurement: BioTIME includes data from 44,440 species across the plant and animal kingdoms, ranging from plants, plankton and terrestrial invertebrates to small and large vertebrates.
Strategies to mitigate carbon dioxide emissions through forestry activities have been proposed, but ecosystem process-based integration of climate change, enhanced CO2, disturbance from fire, and management actions at regional scales are extremely limited. Here, we examine the relative merits of afforestation, reforestation, management changes, and harvest residue bioenergy use in the Pacific Northwest. This region represents some of the highest carbon density forests in the world, which can store carbon in trees for 800 y or more. Oregon's net ecosystem carbon balance (NECB) was equivalent to 72% of total emissions in 2011-2015. By 2100, simulations show increased net carbon uptake with little change in wildfires. Reforestation, afforestation, lengthened harvest cycles on private lands, and restricting harvest on public lands increase NECB 56% by 2100, with the latter two actions contributing the most. Resultant cobenefits included water availability and biodiversity, primarily from increased forest area, age, and species diversity. Converting 127,000 ha of irrigated grass crops to native forests could decrease irrigation demand by 233 billion m3⋅y-1 Utilizing harvest residues for bioenergy production instead of leaving them in forests to decompose increased emissions in the short-term (50 y), reducing mitigation effectiveness. Increasing forest carbon on public lands reduced emissions compared with storage in wood products because the residence time is more than twice that of wood products. Hence, temperate forests with high carbon densities and lower vulnerability to mortality have substantial potential for reducing forest sector emissions. Our analysis framework provides a template for assessments in other temperate regions.
Abstract Forest ecosystems are removing significant amounts of carbon from the atmosphere. Both abiotic resource availability and biotic interactions during forest succession affect C accumulation rates and maximum C stocks. However, the timing and controls on the peak and decline in C accumulation rates as stands age, trees increase in size, and canopy gaps become prevalent are not well‐understood. Our study examines measured change in live and dead woody C pools from 8767 inventory plots on 9.1 million ha of Pacific Northwest National Forest lands to determine how the balance of tree growth, mortality, and dead wood decomposition varied by stand age, plant community type, and site productivity; and to compare the contribution of different tree sizes to C accumulation. Maximum non‐mineral soil C for old‐growth stands varied significantly by productivity class within plant community types, but on average stands accumulated 75% of maximum stocks by age 127 ± 35 yr. We did not see a decline in net primary production of wood (NPPw) with age in moderate and low‐productivity classes, but found a 33% reduction in high‐productivity classes. Mortality increased with stand age such that net change in live tree biomass, and change in total woody C, was not significantly different from zero in old‐growth stands over age 400 (0.15 ± 0.64 Mg C·ha−1·yr−1 for woody C). However, significant though modest C accumulation was found in forests 200–400 yr old (0.34–0.70 Mg C·ha−1·yr−1, depending on age class). Mortality of trees >100 cm diameter exceeded or equaled NPPw, but trees were growing into the larger sizes at a high‐enough rate that a net increase in large tree C was seen across the region. Although large trees accumulated C at a faster rate than small trees on an individual basis, their contribution to C accumulation rates was smaller on an area basis, and their importance relative to small trees declined in older stands compared to younger stands. In contrast to recent syntheses, our results suggest that old‐growth and large trees are important C stocks, but they play a minor role in additional C accumulation.
Forest policymakers and managers have long sought ways to evaluate the capability of forest landscapes to jointly produce timber, habitat, and other ecosystem services in response to forest management. Currently, carbon is of particular interest as policies for increasing carbon storage on federal lands are being proposed. However, a challenge in joint production analysis of forest management is adequately representing ecological conditions and processes that influence joint production relationships. We used simulation models of vegetation structure, forest sector carbon, and potential wildlife habitat to characterize landscape-level joint production possibilities for carbon storage, timber harvest, and habitat for seven wildlife species across a range of forest management regimes. We sought to (1) characterize the general relationships of production possibilities for combinations of carbon storage, timber, and habitat, and (2) identify management variables that most influence joint production relationships. Our 160 000-ha study landscape featured environmental conditions typical of forests in the Western Cascade Mountains of Oregon (USA). Our results indicate that managing forests for carbon storage involves trade-offs among timber harvest and habitat for focal wildlife species, depending on the disturbance interval and utilization intensity followed. Joint production possibilities for wildlife species varied in shape, ranging from competitive to complementary to compound, reflecting niche breadth and habitat component needs of species examined. Managing Pacific Northwest forests to store forest sector carbon can be roughly complementary with habitat for Northern Spotted Owl, Olive-sided Flycatcher, and red tree vole. However, managing forests to increase carbon storage potentially can be competitive with timber production and habitat for Pacific marten, Pileated Woodpecker, and Western Bluebird, depending on the disturbance interval and harvest intensity chosen. Our analysis suggests that joint production possibilities under forest management regimes currently typical on industrial forest lands (e.g., 40- to 80-yr rotations with some tree retention for wildlife) represent but a small fraction of joint production outcomes possible in the region. Although the theoretical boundaries of the production possibilities sets we developed are probably unachievable in the current management environment, they arguably define the long-term potential of managing forests to produce multiple ecosystem services within and across multiple forest ownerships.
Abstract Heterotrophic respiration (HR), the aerobic and anaerobic processes mineralizing organic matter, is a key carbon flux but one impossible to measure at scales significantly larger than small experimental plots. This impedes our ability to understand carbon and nutrient cycles, benchmark models, or reliably upscale point measurements. Given that a new generation of highly mechanistic, genomic‐specific global models is not imminent, we suggest that a useful step to improve this situation would be the development of “Decomposition Functional Types” (DFTs). Analogous to plant functional types (PFTs), DFTs would abstract and capture important differences in HR metabolism and flux dynamics, allowing modelers and experimentalists to efficiently group and vary these characteristics across space and time. We argue that DFTs should be initially informed by top‐down expert opinion, but ultimately developed using bottom‐up, data‐driven analyses, and provide specific examples of potential dependent and independent variables that could be used. We present an example clustering analysis to show how annual HR can be broken into distinct groups associated with global variability in biotic and abiotic factors, and demonstrate that these groups are distinct from (but complementary to) already‐existing PFTs. A similar analysis incorporating observational data could form the basis for future DFTs. Finally, we suggest next steps and critical priorities: collection and synthesis of existing data; more in‐depth analyses combining open data with rigorous testing of analytical results; using point measurements and realistic forcing variables to constrain process‐based models; and planning by the global modeling community for decoupling decomposition from fixed site data. These are all critical steps to build a foundation for DFTs in global models, thus providing the ecological and climate change communities with robust, scalable estimates of HR.
Nutrient levels in decomposing detritus and soil can influence decomposition rates and detrital nutrient dynamics in differing ways among various detrital components of forests. We assessed whether increased phosphorus (P) levels in litter and soil influenced decomposition rates and litter nutrient dynamics of foliage, fine roots, and twigs in nitrogen (N)-rich Douglas-fir (Pseudotsuga menziesii (Mirb.) Franco) forests in the Oregon Coast Range.
 Jerry F. Franklin合作论文数School of Environmental and Forest Sciences, University of Washington10
 Jay Sexton合作论文数9Becky Fasth合作论文数9
 Carlos A. Sierra合作论文数Max-Planck-Institute for Biogeochemistry, Hans-Knöll Str. 10, 07745 Jena, Germany8
 Linda S. Heath合作论文数Northeastern Research Station7
 Thomas A Spies (Thomas Spies)合作论文数United States Department of Agriculture, Forest Service7
 Christopher W. Woodall合作论文数Forest Service Northern Research Station, U.S. Department of Agriculture7
 Michael G. Ryan合作论文数Natural Resource Ecology Laboratory, Colorado State University;USDA Forest Service, Rocky Mountain Research Station6
 Steven S. Perakis合作论文数parrmenr of Ecology, De;Cornell University;parrmenr of Ecology, Cornell University6Richard Birdsey合作论文数6
 Brian Murray合作论文数Sanford School of Public Policy, Duke University5
 Indy Burke合作论文数School of the Environment, Yale University5Morrison James F合作论文数5
 Beverly Law合作论文数Department of Forest Ecosystems & Society, Oregon State University;College of Forestry, Oregon State University5
 Diane Pataki合作论文数School of Sustainability, College of Global Futures, Arizona State University5
 Richard A. Houghton合作论文数Woodwell Climate Research Center5
 Whendee Silver合作论文数Department of Environmental Science, Policy, and Management, Rausser College of Natural Resources, University of California, Berkeley;Tierra Metrics, Inc.5
 Rob Jackson合作论文数School of Sustainability, Stanford University;Woods Institute for the Environment, Stanford University;Precourt Institute for Energy, Stanford University5Kari E. B. O'Connell合作论文数Department of Forest Science, Oregon State University5Olga N. Krankina合作论文数Department of Forest Science, Oregon State University5Duncan C. Mckinley合作论文数5
 Christian P. Giardina合作论文数Pacific Southwest Research Station, Institute of Pacific Islands Forestry5Robert J. Pabst合作论文数Department of Forest Science;Oregon State University;Department of Forest Science, Oregon State University5James B. Domingo合作论文数4
 Bill Parton合作论文数Natural Resource Ecology Laboratory, Colorado State University;Department of Forest Rangeland and Watershed Stewardship, Colorado State University4
 Kenneth E. Skog合作论文数Forest Products Laboratory, Forest Service, U.S. Department Of Agriculture4
 Ben Bond-Lamberty合作论文数Joint Global Change Research Institute, Pacific Northwest National Laboratory4
 Nathan Stephenson合作论文数Western Ecological Research Center, U.S. Geological Survey4
 Stephen C. Hart合作论文数School of Natural Sciences, University of California, Merced4
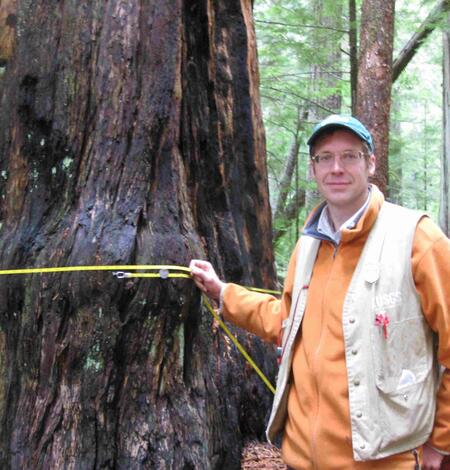 Phillip J. Van Mantgem合作论文数U. S. Geological Survey4A. Shoup合作论文数3david m schmidt合作论文数3
 Gaurang Bhaskar Yodh合作论文数3dg coyne合作论文数3Cm Hoffman合作论文数3Rl Burman合作论文数3De Alexandreas合作论文数3C Dion合作论文数3De Nagle合作论文数3Gm Dion合作论文数3
 Tirong Yang合作论文数3
 Stephen Mitchell合作论文数Department of Forest and Conservation Sciences, Faculty of Forestry, University of British Columbia3
 Peter S. White合作论文数Department of Biology, College of Arts and Sciences, The University of North Carolina at Chapel Hill3
 Warren B. Cohen合作论文数Research & Development, USDA Forest Service3R. W. Ellsworth合作论文数The Milagro Collaboration3
 Rodrigo Vargas合作论文数School of Life Sciences, Arizona State University;Department of Plant and Soil Sciences, University of Delaware3
 Spencer R. Klein合作论文数University of California, Berkeley;Nuclear Science Division, Lawrence Berkeley National Laboratory3L. A. Kelley合作论文数3
 Jordan A. Goodman合作论文数Department of Physics, College of Computer, Mathematical & Natural Sciences, University of Maryland3




