Forests in cities are important social and ecological resources that vary in spatial extent, configuration, and ownership across urban areas, yet these patterns are not well described. Using high resolution urban tree canopy maps and planimetric data from three major cities of the eastern United States (New York, NY; Philadelphia, PA; Baltimore, MD), we distinguish patches of forest from other tree canopy types. We then compare forest patch spatial characteristics and ownership across the three cities. Baltimore has the greatest citywide forest patch cover (8.3 %) and forest patch area per resident (29.5 m2/person), followed by Philadelphia (6.3 % and 13.7 m2/ person) and New York City (3.9 % and 3.5 m2/person). Baltimore's forest also has the largest median patch sizes, and the lowest citywide forest edge to core ratio. Thus, we find Baltimore's forest cover to be more concentrated and less fragmented than the other two cities. While all cities have a majority of forest patch area located on municipal property, Baltimore has the greatest amount of privately owned forest, followed by Philadelphia and then NYC. Baltimore also has the largest number of property parcels and owner types per patch compared to the other two cities. These patterns in distribution of forest cover reflect historical and present-day processes of local ecology and economic development, and have implications for effective conservation and management of forests in cities.
Comprehensive high resolution land cover and parcel data provide new abilities to map and identify discrete forest patches across different ownerships and land uses, from urban to rural settings. Mapping of forest patches can inform forest management and protection, to maintain ecological benefits for diverse populations. We use parcel data in combination with high resolution land cover to map and characterize 20,146 unique forest patches covering 581.9 km2 across urban Baltimore City and suburban and rural portions of Baltimore County. Typical of the eastern United States, initial urban development in this region gave rise to suburban expansion during the 20th century. We found size and number of forest patches, as well as the proportion of forest spanning multiple parcels, all increased when moving outward from urban to rural areas. The number of forest patches went from nearly 2000 in Baltimore City (9.7 % of land area) to 7700 forest patches within suburban Baltimore County, within the urban growth boundary (17.9 % of land area), to nearly 10,500 in the rural portion of Baltimore County (44.7 % of land area). However, ownership type and land use of forest patches, as derived from parcel data, was unique for each region: public ownership was more common within the city, and private ownership, with residential and agricultural land use, more common in suburban and rural Baltimore County, respectively. For all of the regions we considered, most of the forest area and the larger forest patches were distributed across numerous parcels and many types of ownership and land use. For each of these regions, working across parcel boundaries has the potential to expand forest conservation and management, but will involve a range of owners and land use types, including public parks, residential areas, and farmland, from urban to rural settings.
Mitigating heat is a vital ecosystem service of trees, particularly with climate change. Land surface temperature measures captured at a single time of day (in the morning) dominate the urban heat island literature. Less is known about how local tree canopy and impervious surface regulate air temperature throughout the day, and/or across many days with varied weather conditions, including cloud cover. We use bike-mounted air temperature sensors throughout the day in New Haven, Connecticut, USA, from 2019 to 2021 and generalized additive mixed models across 156 rides to estimate the daily variation in cooling benefits associated with tree canopy cover, and warming from impervious surface cover in 90 m buffers surrounding bike observations. Cooling is inferred by subtracting the bicycle-observed temperature from a reference station. The cooling benefits from tree canopy cover were strongest in the midday (11:00–14:00, −1.62 °C), afternoon (14:00–17:00, −1.19 °C), and morning (8:00–11:00, −1.15 °C) on clear days. The cooling effect was comparatively smaller on cloudy mornings −0.92 °C and afternoons −0.51 °C. Warming from impervious surfaces was most pronounced in the evening (17:00–20:00, 1.11 °C) irrespective of clouds, and during cloudy nights (20:00–23:00) and cloudy mornings 1.03 °C 95 % CI [1.03, 1.04]. Among the hottest observed days (top 25th percentile of reference station daily maxima), tree canopy was associated with lower temperatures on clear afternoons −1.78 °C [-1.78, −1.78], cloudy midday −1.17 °C [-1.19, −1.15], clear midday −1.12 °C [-1.12, −1.11]. We add a broader spectrum of weather conditions by explicitly including clouds, and greater temporal resolution by measuring throughout the day to bike-based urban heat research. Future mobile sampling campaigns may broaden the spatial extent with more environmental variation, representing an opportunity for public science and engagement.
Sediment management is an important aspect of dam removal projects, often driving costs and influencing community acceptance. For dams storing uncontaminated sediments, downstream release is often the cheapest and most practical approach and can be ecologically beneficial to downstream areas deprived of sediment for years. To employ this option, project proponents must estimate the sediment quantity to be released and, if substantial, estimate how long it will take to erode, where it will go and how long it will stay there. We investigated these issues when the Bloede Dam was removed from the Patapsco River in Maryland, USA, in 2018. The dam was about 10 m high, and its impoundment was nearly filled with an estimated 186 600 m(3) of sediment composed of 70% sand and 30% mud. After removal, using elevation surveys generated by traditional methods as well as structure-from-motion (SfM) photogrammetry at high temporal resolution, we documented rapid erosion of stored sediments in the first 6 months (similar to 60%) followed by greatly reduced erosion rates for the next two and a half years. A stable channel developed in the impoundment during the rapid erosion phase. These results were predicted by a two-phased erosion response model developed from observations at sand-filled impoundments, thus expanding its applicability to include impoundments with a sand-over-mud stratigraphy. A similar two-phase erosion response has been reported for sediment releases at other dam removals in the United States, France and Japan across a range of dam and watershed scales, indicating what practitioners and communities should expect in similar settings. Downstream, repeat surveys combined with discharge and sediment gaging showed rapid transport of eroded sediments through a 5-km reach, especially during the first year when discharges were above normal, and little overbank storage.
Headwater streams can contribute significant amounts of fine sediment to downstream waterways, especially when severely eroded and incised. Potential upstream sediment source identification is crucial for effective management of water quality, aquatic habitat, and sediment loads in a watershed. This study explored topographic openness (TO) derived from 1-m lidar for its ability to predict incision in headwater streams and to remotely detect changes in incision over time. Field surveys were conducted in one forested and two recently urbanized headwater watersheds in the Maryland Piedmont physiographic province, USA to characterize the level of stream channel incision (none, moderate, or severe) in the main stem of each watershed. Predictions of the severity of stream channel incision derived from TO were compared against the field surveys. Channel incision was detected with an overall accuracy of 67 %, with best performance in reaches with either severe or no incision (79 - 86 % accuracy). The method was also applied to repeat lidar collected over the same area to model the extent of channel incision in 2002 before urban development began and in 2008 and 2013 during active construction in the urban watersheds. Results showed increasing incision over time in all three watersheds, with similar patterns in the forested and urban watersheds. This new method of remotely measuring channel incision can be used to identify potential sediment sources across a watershed, enhance water and habitat quality predictions, and detect changes over time where multiple years of overlapping lidar are available.
Terrestrial laser scanning data can be converted to reliable woody aboveground biomass estimates, but estimation quality is influenced by growing environment, leaf condition, and variation in tree density affecting volume to mass conversion. Both rural and urban forests play an important role in terrestrial carbon cycling. Forest carbon stocks are typically estimated from models predicting the aboveground biomass (AGB) of trees. However, such models are often limited by insufficient data on tree mass, which generally requires felling and weighing parts of trees. In this study, thirty-one trees of both deciduous and evergreen species were destructively sampled in rural and urban forest conditions. Prior to felling, terrestrial laser scanning (TLS) data were used to estimate tree biomass based on volume estimates from quantitative structure models, combined with tree basic density estimates from disks sampled from stems and branches after scanning and felling trees, but also in combination with published basic density values. Reference woody AGB, main stem, and branch biomass were computed from destructive sampling. Trees were scanned in leaf-off conditions, except evergreen and some deciduous trees, to assess effects of a leaf-separation algorithm on TLS-based woody biomass estimates. We found strong agreement between TLS-based and reference woody AGB, main stem, and branch biomass values, using both measured and published basic densities to convert TLS-based volume to biomass, but use of published densities reduced accuracy. Correlations between TLS-based and reference branch biomass were stronger for urban trees, while correlations with stem mass were stronger for rural trees. TLS-based biomass estimates from leaf-off and leaf-removed point clouds strongly agreed with reference biomass data, showing the utility of the leaf-removal algorithm for enhancing AGB estimation.
Plant traits are often measured in the field or laboratory to characterize stress responses. However, direct measurements are not always cost effective for broader sampling efforts, whereas indirect approaches such as reflectance spectroscopy could offer efficient and scalable alternatives. Here, we used field spectroscopy to assess whether (1) existing vegetation indices could predict leaf trait responses to heat stress, or if (2) partial least squares regression (PLSR) spectral models could quantify these trait responses. On several warm, sunny days, we measured leaf trait responses indicative of photosynthetic mechanisms, plant water status, and morphology, including electron transport rate (ETR), photochemical quenching (qP), leaf water potential (Ψleaf), and specific leaf area (SLA) in 51 urban trees from nine species. Concurrent measures of hyperspectral leaf reflectance from the same individuals were used to calculate vegetation indices for correlation with trait responses. We found that vegetation indices predicted only SLA robustly (R2 = 0.55), while PLSR predicted all leaf trait responses of interest with modest success (R2 = 0.36 to 0.58). Using spectral band subsets corresponding to commercially available drone-mounted hyperspectral cameras, as well as those selected for use in common multispectral satellite missions, we were able to estimate ETR, qP, and SLA with reasonable accuracy, highlighting the potential for large-scale prediction of these parameters. Overall, reflectance spectroscopy and PLSR can identify wavelengths and wavelength ranges that are important for remote sensing-based modeling of important functional trait responses of trees to heat stress over broad ranges.
ContextLand use history of urban forests impacts present-day soil structure, vegetation, and ecosystem function, yet is rarely documented in a way accessible to planners and land managers.ObjectivesTo (1) summarize historical land cover of present-day forest patches in Baltimore, MD, USA across land ownership categories and (2) determine whether social-ecological characteristics vary by historical land cover trajectory.MethodsUsing land cover classification derived from 1927 and 1953 aerial imagery, we summarized present-day forest cover by three land cover sequence classes: (1) Persistent forest that has remained forested since 1927, (2) Successional forest previously cleared for non-forest vegetation (including agriculture) that has since reforested, or (3) Converted forest that has regrown on previously developed areas. We then assessed present-day ownership and average canopy height of forest patches by land cover sequence class.ResultsMore than half of Baltimore City's forest has persisted since at least 1927, 72% since 1953. About 30% has succeeded from non-forest vegetation during the past century, while 15% has reverted from previous development. A large proportion of forest converted from previous development is currently privately owned, whereas persistent and successional forest are more likely municipally-owned. Successional forest occurred on larger average parcels with the fewest number of distinct property owners per patch. Average tree canopy height was significantly greater in patches of persistent forest (mean = 18.1 m) compared to canopy height in successional and converted forest patches (16.6 m and 16.9 m, respectively).ConclusionsHistorical context is often absent from urban landscape ecology but provides information that can inform management approaches and conservation priorities with limited resources for sustaining urban natural resources. Using historical landscape analysis, urban forest patches could be further prioritized for protection by their age class and associated ecosystem characteristics.
Context Previous studies developed distance-weighted regression to describe how land use effects on aquatic systems attenuate with arrangement of source areas within catchments. Objectives We clarify and extend the conceptual foundations of this approach, enhance the spatial and statistical methods, and provide new tools to interpret the results. Methods We derive the framework from first principles to resolve conceptual issues with how weighting is applied to source area versus total area, and we formalize the requirements for an ideal weighting function. We quantify the spatial distributions of land areas in a way that integrates with model fitting. We adapt non-linear optimization to simultaneously fit regression and weighting parameters. We quantify the spatial distribution of source effects with arrangement and document how different weighting functions alter that distribution. Results To verify their utility, we applied these methods to a published analysis relating polychlorinated biphenyls in fish to developed land use in catchments. We identified a stronger distance-weighted model and more completely characterized the effects of weighting on where aquatic impacts originate. Conclusions Our methods enable more comprehensive analyses of the effects of spatial arrangement to better inform a wide range of scientific investigations and applications. Our methods can relate almost any spatially distributed source or driver to an integrated response at a point or along a boundary; and alternate hypotheses about the effects of pattern or proximity on processes can be tested with alternative weighting functions. New applications will generate additional weighting functions that enhance the general approach.
Intensive agricultural landscapes pose a challenge to wildlife managers, policymakers, and landowners hoping to increase the diversity of desired wildlife species, such as grassland birds, which require urgent conservation action. In intensive agricultural landscapes, like those of the Midwestern United States, most land area is privately owned and operated and managed primarily for production. Thus, conducting ecological research in intensive agricultural landscapes requires collaborative approaches aimed at farm owners and operators. Recent advances in acoustic data collection and high-resolution habitat mapping, including low-cost acoustic recorders and satellite remote sensing, may be well positioned to address this challenge by enabling expanded assessments and monitoring of wildlife populations and habitats across regions. This study examined fine-grained habitat characteristics and their relationship with avian biodiversity in intensive agricultural landscapes at 44 agricultural sites across the state of Iowa. Passive acoustic monitoring and manual identification of bird species allowed for measurement of vocalizing bird richness. High-resolution mapping of noncrop vegetation provided detailed information on small noncrop vegetation habitat complexes within row-crop agriculture. Measures of image texture provided characterizations of compositional heterogeneity within noncrop vegetation. General linear Poisson modeling demonstrated robust associations between noncrop vegetation and vocalizing bird richness, yet variation in grassland bird richness was not well predicted by noncrop vegetation. Noncrop vegetation texture demonstrated potential as a predictor of vocalizing bird richness, though not better than or when combined with noncrop vegetated area, indicating it may not be an independent measure of habitat quality. Passive acoustic monitoring resulted in useful data at 44 out of 60 originally selected sites, with some lost to failed recorders and/or collaboration issues. Challenges remain in detecting habitat characteristics that promote grassland birds in row crop landscapes. Working toward probabilistic research design across privately owned working landscapes and incorporating more detailed management practice information would improve the transferability of this approach to farmland management and policy.
Understanding patterns of species coexistence is a fundamental challenge in ecology. The physical environment is believed to play an important role, influencing patterns of dispersal and biotic interactions across space and time. Floodplain forest species are presumed to interact strongly with their environment, as evidenced by pronounced spatial variation in forest composition associated with flood-driven abiotic constraints. Questions of how, and to what degree, fine-scale heterogeneity interacts with broad-scale hydrogeomorphology to influence patterns of functional composition remain unresolved. We examined how functional diversity (i.e. richness and range of functional traits) and ecological strategies (i.e. functional trait combinations) of floodplain forest communities varied across regional and local gradients of flooding in a northern temperate region of the United States of America. We found functional diversity of woody overstory species varied across hydrogeomorphic settings and that different settings altered associations between functional diversity and both the relative elevation above and proximity to rivers. Ecological strategies shifted over local gradients of relative elevation and distance to channel with different magnitudes and directions depending on the broader hydrogeomorphic context. We found evidence that interactions among flood regimes and landform position impose different levels of functional constraint. These results indicate patterns of community assembly are not easily discerned from landform type or position alone, but rather from filtering that operates and interacts with biota over multiple spatial scales. Our results imply that it is important to characterize flood dynamics in ways that can be clearly linked to ecological processes and that treatment of floodplain landforms as transferable units across river-valley segments is problematic, even within a single basin.
The elevated heat of urban areas compared to their surroundings makes humid temperate cities a useful preview of future climate effects on natural forest phenology. The utility of this proxy rests on the expectation that trees in urban areas alter their phenology in response to warmer site conditions in spring and fall. However, it is possible that apparent lengthening of the growing season is instead governed by human-driven tree species selection and plant functional type (PFT; trees, shrubs, turfgrass) heterogeneity typical of managed landscapes. Absent highly spatially and temporally resolved remote sensing data, the roles of tree taxonomy and local site characteristics (e.g., impervious cover) in controlling phenology remain confounded. To understand the drivers of earlier start of season (SOS) and later end of season (EOS) among urban trees, we estimated individual tree phenology using >130 high-resolution satellite images per year (2018-2020) for ~10,000 species-labeled trees in Washington, DC. We found that species identity alone accounted for 4× more variability in the timing of SOS and EOS compared with a tree’s planting location characteristics (e.g., impervious surroundings). Additionally, the urban mix of PFTs may be more responsible for apparent advances in SOS (by between 1.8 +/- 1.3 and 3.5 +/- 1.3 days) than heat per se. The results of this study caution against associating longer growing seasons in cities—observed in moderate to coarse resolution remote sensing imagery—to within-species phenological plasticity and demonstrate the power of high-resolution satellite data for tracking tree phenology in biodiverse environments.
The elevated heat of urban areas compared to their surroundings makes humid temperate cities a useful preview of future climate effects on natural forest phenology. The utility of this proxy rests on the expectation that trees in urban areas alter their phenology in response to warmer site conditions in spring and fall. However, it is possible that apparent lengthening of the growing season is instead governed by human-driven tree species selection and plant functional type (PFT; trees, shrubs, turfgrass) heterogeneity typical of managed landscapes. Without the use of highly spatially and temporally resolved remote sensing data, the roles of tree taxonomy and local site characteristics (e.g., impervious cover) in controlling phenology remain confounded. To understand the drivers of earlier start of season (SOS) and later end of season (EOS) among urban trees, we estimated individual tree phenology using >130 high-resolution satellite images per year (2018-2020) for ~10,000 species-labeled trees in Washington, DC. We found that species identity alone accounted for 4× more variability in the timing of SOS and EOS compared with a tree's planting location characteristics. Additionally, the urban mix of PFTs may be more responsible for apparent advances in SOS (by between 1.8 ± 1.3 and 3.5 ± 1.3 days) than heat per se. The results of this study caution against associating longer growing seasons in cities-observed in moderate to coarse resolution remote sensing imagery-to within-species phenological plasticity and demonstrate the power of high-resolution satellite data for tracking tree phenology in biodiverse environments.
One mechanism proposed to explain high species diversity in tropical systems is strong negative conspecific density dependence (CDD), which reduces recruitment of juveniles in proximity to conspecific adult plants. Although evidence shows that plant-specific soil pathogens can drive negative CDD, trees also form key mutualisms with mycorrhizal fungi, which may counteract these effects. Across 43 large-scale forest plots worldwide, we tested whether ectomycorrhizal tree species exhibit weaker negative CDD than arbuscular mycorrhizal tree species. We further tested for conmycorrhizal density dependence (CMDD) to test for benefit from shared mutualists. We found that the strength of CDD varies systematically with mycorrhizal type, with ectomycorrhizal tree species exhibiting higher sapling densities with increasing adult densities than arbuscular mycorrhizal tree species. Moreover, we found evidence of positive CMDD for tree species of both mycorrhizal types. Collectively, these findings indicate that mycorrhizal interactions likely play a foundational role in global forest diversity patterns and structure.
Mitigating urban heat is a vital ecosystem services of urban trees, especially within a warming climate. Land surface temperature measures captured at a single time of day (in the morning) dominate the urban heat island literature. Less is known about how local tree canopy and impervious surface regulate air temperature throughout the day, and/or across many days with varied weather conditions, including cloud cover. We use bike-mounted air temperature sensors in New Haven, CT, from 2019 – 2021 and generalized additive mixed models across 156 rides to estimate the daily variation in cooling benefits associated with tree canopy cover, as well as warming from impervious surface cover. The cooling benefits from tree canopy cover were strongest in the mid-day (11:00-14:00, -1.62°C), afternoon (14:00-17:00, -1.19°C), and morning (8:00-11:00, -1.15°C) on clear days. The cooling effect was comparatively smaller on cloudy mornings -0.92°C and afternoons -0.51°C. Under cloudy conditions the role of trees’ shading is diminished, yet there was significant cooling, highlighting the unique contribution of evapotranspiration. The warming disservice of impervious surfaces were most pronounced in the evening (17:00-20:00, 1.11°C) on clear and cloudy rides, and during cloudy nights (20:00-23:00) and cloudy mornings 1.03C [1.03, 1.04]. Among the hottest observed days, tree canopy was associated with lower temperatures on clear afternoons -1.78C [-1.78, -1.78], cloudy mid-day -1.17C [-1.19, -1.15], clear mid-day -1.12C [-1.12, -1.11]. Future mobile sampling campaigns may broaden the spatial extent and include more sources of environmental variation, and represent an exciting opportunity for pubic science and engagement.
Sediment management is an important aspect of river reconnection projects, often driving costs and influencing community acceptance. At sites with uncontaminated sediments, downstream release is an attractive option because it is often the cheapest and most practical approach and the sediment can be ecologically beneficial to downstream areas deprived of it for years by the dam. To employ this option, project proponents must estimate the sediment quantity to be released and, if substantial, estimate how long it will take to erode, where it will go, and how long it will stay there. We investigated these issues for sediments released by the 2018 removal of Bloede Dam on the Patapsco River in Maryland, USA. The dam was about 10 m high and its impoundment filled with sand and mud. Taking the surface elevations of these sediments surveyed immediately before removal and subtracting estimates of the pre-dam valley elevations derived from 21 cores and post-removal surveys of exhumed pre-dam surfaces, we estimate there was approximately 186,600 m3 of stored sediment composed of 70% sand and 30% mud. These proportions match estimates made during pre-removal engineering studies, but our total stored sediment estimate is about 20% less. The difference between estimates reflects a real change in stored sediment quantity between 2018 and 2012 when the engineering studies were completed, additional data available to us after removal, and different estimation methods. After removal, using elevation surveys generated by traditional methods as well as UAS-based aerial imagery and structure-from-motion (SfM) at high temporal resolution, we documented rapid erosion of the stored sediments in the first six months (~60%) followed by greatly reduced erosion rates for the next couple of years. A stable channel was developed in the impoundment during the rapid erosion phase. These results are similar to a two-phased erosion response reported for sediment releases at dam removals around the world across a range of dam and watershed scales, indicating what practitioners and communities should expect when reconnecting rivers in similar settings. Downstream, repeat surveys combined with discharge and sediment gaging show rapid transport of eroded sediments through a 5 km reach, especially during the first year when discharges were above normal, and little overbank storage.
Urban forests are important components of societal interactions with nature. We focused on urban forest patches, a distinct and underexplored subset of the urban forest that spans land uses and ownerships, and requires silvicultural practices to address their unique biophysical characteristics and management regimes. Our goal was to elucidate multi-scalar urban forest patch governance arrangements as they translated to on-the-ground management in four urban areas (Chicago, New York City, Philadelphia, and Baltimore) within the eastern United States. A transdisciplinary knowledge co-production framework was used to guide identification of the prominent management challenge or dilemma motivating change to forest patch management in each location, and to describe the dynamic interplay of decision-making and governance processes across locations as they advanced toward desired forest conditions. A common management goal existed across all four locations: multi-age, structurally complex forests dominated by regionally native species. Ecological and social concerns affected by local context and city capacity served as starting points prompting management action and new collaborations. Disparate governance arrangements including top-down municipal resources, regional conservation facilitated by landowners, and grass-roots community-driven stewardship led to diverse support-building processes and innovative strategies that served as forces initiating and shaping new management actions. Science and iterative learning and adaptation influenced change in all locations, reinforcing new management arrangements and practices. Among the four study areas, the earliest management of urban forest patches started in the 1980 s, historically lacking embeddedness in urban forest management more broadly, and experiencing challenges with integration into existing governance infrastructure. Ultimately, new management and governance approaches to urban forest patches in all four study areas have evolved uniquely and organically, driven by place-based historical legacies and ongoing socio-ecological feedbacks. The generalization of findings for broader urban forest management guidelines, such as for trees and park, would lead to misguided outcomes.
Habitat alteration and destruction are primary drivers of biodiversity loss. However, the evolutionary dimensions of biodiversity loss remain largely unexplored in many systems. For example, little is known about how habitat alteration/loss can lead to phylogenetic deconstruction of ecological assemblages at the local level. That is, while species loss is evident, are some lineages favored over others? Using a long-term dataset of a globally, ecologically important guild of invertebrate consumers, stream leaf "shredders," we created a phylogenetic tree of the taxa in the regional species pool, calculated mean phylogenetic distinctiveness for >1000 communities spanning >10 year period, and related species richness, phylogenetic diversity, and distinctiveness to watershed-scale impervious cover. Using a combination of changepoint and compositional analyses, we learned that increasing impervious cover produced marked reductions in all three measures of diversity. These results aid in understanding both phylogenetic diversity and mean assemblage phylogenetic distinctiveness. Our findings indicate that, not only are species lost when there is an increase in watershed urbanization, as other studies have demonstrated, but that those lost are members of more distinct lineages relative to the community as a whole..
Under-representations of headwater channels in digital stream networks can result in uncertainty in the magnitude of headwater habitat loss, stream burial, and watershed function. Increased availability of high-resolution (<2 m) elevation data makes the delineation of headwater channels more attainable. In this study, elevation data derived from light detection and ranging was used to predict ephemeral stream networks across a forested and urban watershed in the Maryland Piedmont USA. A method was developed using topographic openness (TO) and wetness index to remotely predict the extent of stream networks. Predicted networks were compared against a comprehensive field survey of the ephemeral network in each watershed to evaluate performance. Comparisons were also made to the U.S. Geological Survey National Hydrography Dataset (NHD) and a flow accumulation approach where a single drainage area threshold defined channel initiation. Although the NHD and flow accumulation methods resulted in low commission errors, omission errors were highest in these networks. The TO-based networks detected a larger number of ephemeral channels, but with higher commission error. Small ephemeral channels with less defined banks or originating at groundwater seeps were difficult to detect in all methods. Comparisons between forested and urban watersheds also highlight the difficulty of identifying headwater channels using topographic attributes in human-modified landscapes.
 Ryan King合作论文数Department of Biology, Baylor University14
 Andrew J. Miller合作论文数10
 Donald E. Weller合作论文数Smithsonian Environmental Research Center9
 Michael Alonzo合作论文数Department of Environmental Science, American University7
 Michael J. Wiley合作论文数Department of Surgery, University of Toronto7
 Christina Bandaragoda合作论文数Department of Civil & Environmental Engineering, University of Washington6
 Philippe G. Vidon合作论文数Department of Forest and Natural Resources Management, College of Environmental Science and Forestry, The State University of New York6
 Erle C. Ellis (艾尔青)合作论文数Department of Geography & Environmental Systems, College of Arts, Humanities, and Social Sciences, University of Maryland, Baltimore County6
 Pierre André Jacinthe合作论文数Center for Earth and Environmental Sciences, School of Science, Indiana University–Purdue University Indianapolis6
 Margaret A. Palmer合作论文数College of Agriculture and Natural Resources, University of Maryland;National Socio-Environmental Synthesis Center5
 David Stevens合作论文数5Molly Van Appledorn合作论文数5Nancy F. Sonti合作论文数4
 Daniel K. Jones合作论文数U.S. Geological Survey, Utah Water Science Center4
 Paul Seelbach合作论文数School for Environment and Sustainability, University of Michigan-Ann Arbor4Liu X合作论文数4Thomas E. Jordan合作论文数Smithsonian Environmental Research Center4Bethany T. Neilson合作论文数Utah Water Research Laboratory, Utah State University4Kimberly A. T. Schreuders合作论文数4
 Xiaopeng Song合作论文数Department of Geographical Sciences, College of Behavioral & Social Sciences, University of Maryland, College Park4
 Jeffery S. Horsburgh合作论文数Utah Water Research Laboratory, Utah State University4
 John Townshend合作论文数Department of Geography, University of Maryland4
 Saurabh Channan合作论文数Department of Geography, University of Maryland4
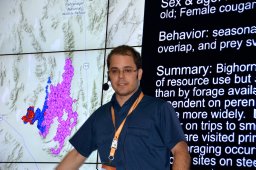 Joseph O. Sexton合作论文数Biospheric Sciences Branch, NASA Goddard Spaceflight Center4
 Joshua Caplan合作论文数3
 Kelly L. Hondula合作论文数National Socio-Environmental Synthesis Center, University of Maryland3Schwartz Katrina Z S合作论文数3
 Kristina Hopkins合作论文数Washington Water Science Center, U.S. Geological Survey3Fisher K合作论文数3
 Dexter H Locke合作论文数3
 Alan Randall合作论文数Department of Agricultural, Environmental, and Development Economics, College of Food, Agricultural, and Environmental Sciences, The Ohio State University3
 Matthew C. LaFevor合作论文数3
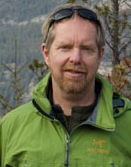 Eric Higgs合作论文数School of Environmental Studies, University of Victoria3Paul W. Seelbach合作论文数Institute for Fisheries Research Michigan Department of Natural Resources3
 Chengquan Huang合作论文数Department of Geographical Sciences, University of Maryland3
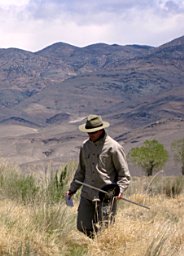 John J. Gutrich合作论文数Environmental Science, Hawaii Pacific University3Mathias J. Collins合作论文数3
 Brendon M. H. Larson合作论文数Department of Botany;University of Toronto;Department of Botany, University of Toronto3
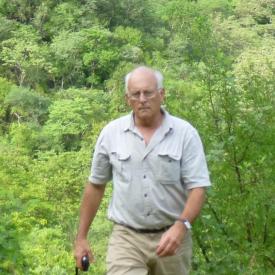 Geoffrey Parker合作论文数Smithsonian Environmental Research Center3Avery Williams合作论文数2Li-Wan Chang合作论文数2
 Colleen Murphy-Dunning合作论文数2Salomón Aguilar合作论文数2
 David Alan Orwig合作论文数2
 Marina Metes合作论文数United States Geological Survey2Hervé Memiaghe合作论文数Inst Rech Ecol Tropicale, Ctr Natl Rech Sci & Technol2
 Adam Dixon合作论文数World Wildlife Fund2
 Pulcherie Bissiengou合作论文数2
 Mitchell Donovan合作论文数2




